Moving Average Slope AnalysisThis is a simple script which allows to do slope analysis on any kind of Moving Average. Simply change the moving average function that you wish to work with , in the script.
Slope analysis may be required for fine-tuning trade automation software , which uses Moving Average for determining optimum enter/exit point.
Read code comments for instructions!
Moving
Moving Average Buy/Sell IndicatorUsing a selected Exponential Moving Average (EMA)/Simple Moving Average (SMA) range, this indicator inserts a Long/Short (buy/sell) indicator overlaid on chart depending on the following conditions:
- LONG/BUY SIGNAL = if SMA value is less than EMA, and both the SMA and EMA are less than the current average price.
- SHORT/SELL SIGNAL = if SMA value is greater than EMA, and both the SMA and EMA are greater than the current average price.
**Intended for use with the 21 and 34 weekly moving average time range. Much more useful for long-term analysis rather than short-term analysis.**

Moving Average Crossover with Shading Signals This script uses 3 moving averages (2 simple moving averages and 1 exponential moving average ) to signal long and short opportunities based on moving average crossovers.
A long SMA (Signal SMA2) is used to determine longer term trend. When the EMA crosses above the Slow SMA1 and price is above the Signal SMA2. The space between the moving averages will shade green and the Signal SMA should also be green.
A sell signal occurs when the EMA crosses below the Slow SMA1 and price is below the Signal SMA2. The space between the moving averages will turn red and the Signal SMA should also be red.
A retracement, consolidation, or reversal may be occurring if the shaded color is yellow.
Use the identifying shapes to learn when to open or close positions.

Dankland Playground Moneymaker - V2“version 2” of my playground bot script. Its essentially a powerhouse suite of strategies. Although it is similar to the previous script, it nets different results as sections have been changed. Such as the somewhat reluctant removal of the Chande Momentum... The RSIs have also been updated, this was one of the main changes. RSIS now include a Moving Average cross of RSI to generate signals above and below the given thresholds instead of simply on crossing a threshold. This should give greater functionality overall. Most functions including Moving Averages have been updated to include a wider range of kinds of moving averages. This includes not just the moving average cross, but MACD and RSIs as well. I tried to perform the same upgrade on the %B, Stochastics and SMI, but hit the unpacked code limit of 60,000 lines... So, more “versions” will have to come for future “upgrades”, with the recognition that there will be cases where the old, “downgraded” versions may perform better and that some people (like myself) may continue to use them on some markets until I/we devise superior settings on the new ones for said markets. For instance, instead of replacing my 1 hr BTCUSD bot (where I used the now deleted Chande to pretty pleasing affect...) I made a new one for LINKUSD 10 min so I can have both running for now and work on replacing the BTCUSD later.
How it works basically is this... you have 16 oscillators which can all be used as independently as you wish. They can be split up into different groups or ran all together.
When in separate groups they should not be able to sell eachothers positions without triggering a full stop loss by turning the Independence/Stop All switches on. Every single oscillator has its own entry and exit position sizing which can be stated as either a percent of balance or a flat amount of contracts (or both combined). Each oscillator has a minimum amount of profit you can tell it to sell it, which is calculated from the average cost of your current position, which does include all groups. This works out to help you average out better entry and exit prices, essentially a method of DCAing.
You can set the minimum sale amount, which is to keep it from placing orders below your exchanges minimum dollar trade cost.
All this functionality combined also ensures more accurate back tests by ensuring that the script simply cannot spend money it doesn't see as in the balance, whereas other scripts will use a percentage of equity, and once 100% of your equity is in BTC for instance, it will keep buying more BTC for free and thus spoof up backtest numbers. If you look through the strategies here, many people claim to have amazing scripts and then you look into it and this is happening and skewing their numbers. These people are either very ignorant or what they made or scam artists and trolls in my opinion.
This version also includes On Bar Close switches for each oscillator. When switched on, signals are only allowed to generate on Bar Close. This helps to prevent retriggering from live signals, which when you are running this many oscillators, will become a problem! However, in most cases, you do not need to generate signals intrabar, as backtests will show, ignoring intrabar buys and sells (intrabar stop losses can still be very important though!) won't exactly keep you from high profitability strategies, but rather, allowing elements of chaos from live indicators moving up and down intrabar will, in fact, drift your actual results further and further from the backtest. You want an accurate backtest though. So choose wisely when you turn these off and you will do better.
The included oscillators are as follows:
NO MORE Chande Momentum cross – REMOVED – I was hitting PINE code limits here so I had to make choices and this one simply had to go. Begone!
Moving Average Cross
MACD cross
%B Bollinger cross
Stochastic cross + region filter
Stochastic RSI cross + region filter
SMII cross and region filter
Three RMIs
Know-Sure-Thing line-cross
Coppock Curve line-cross
TRIX line-cross
RSI of MA w/ MA cross
RSI of MA of KST w/ MA cross
RSI of MA of Coppock Curve w/ MA cross
RSI of MA of Trix w/ MA cross
So the idea is that this is essentially multiple strategies combined into one backtestable house. Balance is calculated for all position sizes in order to try to prevent false entries that plague so many scripts (IE, you set pyramiding to 2, each buy $1000, initial balance $1000, and yet it buys two orders off the bat for $2000 total and nets 400% profit because the second was considered free, happens on 90+% of scripts on Tradingview if you aren't very very careful!)
You tune each indicator and position size them so that they work together as well as you can and in doing so you are able to create a single backtest that is capable of running a bot, essentially, between multiple strategies - you can run a slower Moving Average cross, a faster SMI cross or MACD , or Bollinger that grabs big moves only, all the while having MACD trade small bonuses along the way. This way you can weight the Risk to Reward of each against eachother.
I will not try to claim this is something you can open and with no work have the best bot on the planet. This scripts intention is to take a lot of relatively common trading strategies and combine them under on roof with some risk management and the ability to weigh each against eachother.
If you are looking for a super advanced singular algorithm that tries to capture every peak and valley exactly on the dot, this is not for you. If you are looking for a tool with a high level of customizability, with a publisher who intends to update it to the best of his ability in accordance to seeking to make the best product that I personally can make for both myself and the community (because I will be using this myself of course!) that was specifically designed with the intention of performing well in spot markets by averaging low entry costs and high exit costs, this is for you! That is the exact intention here. It can certainly work with margin, but you will have to take extra care in setting your stop losses. I intend to make a version capable of going short which will be included as part of the package. It may take some work to keep all of the risk management working as well for shorts though. There will be more scripts added to the “package” as I hit the limit on this one a few times and have had to keep some ideas out already.
The current backtest shown is hand-optimized by myself for Link /USD 10min market (Binance US – shouldn't need much work to fit to other exchange markets) with multiple stop losses.

Stepping MAInput desired timeframe and etc
Ex: Timeframe Daily
Input 100
Will display daily moving of 100 on every timeframe

Trend Indicator A-V2 (Smoothed Heikin Ashi Cloud)"Trend Indicator A-V2" and "Trend Indicator B-V2" are updated and improved versions of my initial trend indicators. Totally rethinking the code, adding highs and lows in the calculations, including some more customisation through colour schemes.
In practice, this indicator uses EMAs and Heikin Ashi to provide an overall idea of the trend.
The "Trend Indicator A-V2" is an overlay showing “Smoothed Heikin Ashi” .
The "Trend Indicator B-V2" uses the same values in a different way to measure the momentum of the trend and identify potential trend rejections.
Please, take into account that it is a lagging indicator.

Moving Average BandsUse this script to find buy and sell zones for BTC based on momentum of the move relative to the average asset price over a given period. The script plots a series of offset bands above and below the Simple Moving Average. When price crosses another band further from the SMA, the background is rendered brighter. The brighter the background, the stronger the buy and sell signal is, as the expectation is that price wants to return to the SMA. Settings are adjustable to fine tune to various time frames and assets. Good settings for BTC Daily are length 30, layers at 10, 20, 30, and 40.
On 1H BTC/USD I use length 200, layers at 5, 10, 15, 20 to find decent swing trading opportunities.
On BTC/USD 1D chart, combine with Bitcoin Logarithmic Growth Curve from @mabonyi (original by @quantadelic )for confluence of very reliable signals.

Overlay Indicators (EMAs, SMAs, Ichimoku & Bollinger Bands)This is a combination of popular overlay indicators that are used for dynamic support and resistance, trade targets and trend strength.
Included are:
-> 6 Exponential Moving Averages
-> 6 Simple Moving Averages
-> Ichimoku Cloud
-> Bollinger Bands
-> There is also a weekend background marker ideal for cryptocurrency trading
Using all these indicators in conjunction with each other provide great confluence and confidence in trades and price targets.
An explanation of each indicator is listed below.
What Is an Exponential Moving Average (EMA)?
"An exponential moving average (EMA) is a type of moving average (MA) that places a greater weight and significance on the most recent data points. The exponential moving average is also referred to as the exponentially weighted moving average. An exponentially weighted moving average reacts more significantly to recent price changes than a simple moving average (SMA), which applies an equal weight to all observations in the period.
What Does the Exponential Moving Average Tell You?
The 12- and 26-day exponential moving averages (EMAs) are often the most quoted and analyzed short-term averages. The 12- and 26-day are used to create indicators like the moving average convergence divergence (MACD) and the percentage price oscillator (PPO). In general, the 50- and 200-day EMAs are used as indicators for long-term trends. When a stock price crosses its 200-day moving average, it is a technical signal that a reversal has occurred.
Traders who employ technical analysis find moving averages very useful and insightful when applied correctly. However, they also realize that these signals can create havoc when used improperly or misinterpreted. All the moving averages commonly used in technical analysis are, by their very nature, lagging indicators."
Source: www.investopedia.com
Popular EMA lookback periods include fibonacci numbers and round numbers such as the 100 or 200. The default values of the EMAs in this indicator are the most widely used, specifically for cryptocurrency but they also work very well with traditional.
EMAs are normally used in conjunction with Simple Moving Averages.
" What Is Simple Moving Average (SMA)?
A simple moving average (SMA) calculates the average of a selected range of prices, usually closing prices, by the number of periods in that range.
Simple Moving Average vs. Exponential Moving Average
The major difference between an exponential moving average (EMA) and a simple moving average is the sensitivity each one shows to changes in the data used in its calculation. More specifically, the EMA gives a higher weighting to recent prices, while the SMA assigns an equal weighting to all values."
Source: www.investopedia.com
In this indicator, I've included 6 popular moving averages that are commonly used. Most traders will find specific settings for their own personal trading style.
Along with the EMA and SMA, another indicator that is good for finding confluence between these two is the Ichimoku Cloud.
" What is the Ichimoku Cloud?
The Ichimoku Cloud is a collection of technical indicators that show support and resistance levels, as well as momentum and trend direction. It does this by taking multiple averages and plotting them on the chart. It also uses these figures to compute a "cloud" which attempts to forecast where the price may find support or resistance in the future.
The Ichimoku cloud was developed by Goichi Hosoda, a Japanese journalist, and published in the late 1960s.1 It provides more data points than the standard candlestick chart. While it seems complicated at first glance, those familiar with how to read the charts often find it easy to understand with well-defined trading signals."
More info can be seen here: www.investopedia.com
I have changed the default settings on the Ichimoku to suit cryptocurrency trading (as cryptocurrency is usually fast and thus require slightly longer lookbacks) to 20 60 120 30.
Along with the Ichimoku, I like to use Bollinger Bands to not only find confluence for support and resistance but for price discovery targets and trend strength.
" What Is a Bollinger Band®?
A Bollinger Band® is a technical analysis tool defined by a set of trendlines plotted two standard deviations (positively and negatively) away from a simple moving average (SMA) of a security's price, but which can be adjusted to user preferences.
Bollinger Bands® were developed and copyrighted by famous technical trader John Bollinger, designed to discover opportunities that give investors a higher probability of properly identifying when an asset is oversold or overbought."
This article goes into great detail of the complexities of using the Bollinger band and how to use it.
=======
This indicator combines all these powerful indicators into one so that it is easier to input different settings, turn specific tools on or off and can be easily customised.

MA Cross Ribbon + [RSI,StochRSI,VolOsc,RoC,Compare,Info Panel]
Draws all sorts of useful information directly onto the Chart
Moving Average Ribbon with configurable offsets
Allows you to easily visualize MA Crossovers
Easy to view in the Data Window
RSI Indicator (Overbought, Oversold, Healthy)
Stochastic RSI
Volume Oscillator (Bullish, Bearish, Healthy)
Rate of Change Indicator
Compare Symbol without adding a new scale (Symbol, Timeframe, Divider)
Moving the chart around won't ruin your comparison
Allows you to see the general sentiment of all your configured averages at a glance
100% Configurable
If there is anything you would like added please comment, It's very likely I will be adding more things to this.

SNAP BACK 2.0 Strategy
This strategy is designed to allow you to catch the bounce or "SNAP Back" of an equity that has been in a trend.
1) Once the moving averages are in the order of 200SMA > 50 SMA > 34EMA > 20SMA > 8EMA (or reverse for and uptrend), the strategy is setup.
2) Next you wait for a trigger of the closing price crossing the 8EMA, while there is a desired gap size between the 8EMA and the 20SMA (2-10% of stock value preferred).
3) Exit position based on target profit reached (conservative sell half at 34EMA and engage a trailing stop loss for remainder or set static limit) or price crosses 8EMA or stop loss%
*)This code also allows you to determine your desired backtesting date compliments of alanaster
This code is the product of many hours of hard work on the part of the greater tradingview community. The credit goes to everyone in the community who has put code out there for the greater good.
The idea for the coding came from a video I watched on YouTube presented by TradeStation called Snap Back - thank you guys for the inspiration.
UPDATE: I have coded the other side of the strategy to allow you to take advantage of the same set-up in an uptrend for Short plays. You can turn the up or downsides on, off, or both.
The main intent is to catch the bounces of a falling stock. However, I have found that you can do the inverse and catch the drops in a rising stock (the latter is not as reliable). This also tends to work better on less volatile stocks. I have included a large volume of user defined conditions and display entry and exit conditions on the chart to see how your choices are impacting the script.

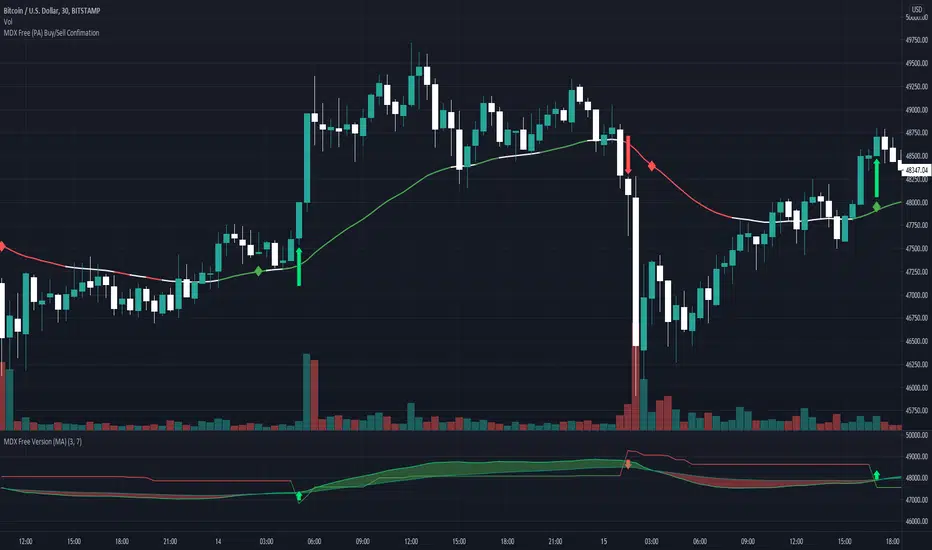
MDX Free (PA) Buy/Sell ConfimationThis is a free version of the MDX Crypto trading "bot". Note that this indicator and the MDX version are based on simple code available on trading view or via google search.
This indicator is based on the super trend indicator to provide buy/sell signals at inflection points of uptrends and downtrends. These inflection points are commonly used as entry/exit points for trading. They are represented on the chart as green (buy) or red (sell) arrow.
This also uses two exponential moving averages. One average is set over 21 bars (fast) and the other is set over 55 bars (slow). When the plots intersect it represents a change in momentum. This is shown on the chart as a red (negative change) or green (positive change) diamonds. When a green diamond follows a green arrow it is considered a confirmed buy. When a red diamond follows a red arrow it is a confirmed sell.
Caution:
Caution this indicator is not reliable on its own, especially on low time scales. When looking back in time this indicator will almost always show a "confirmed buy" before a large increase in price, but on many occasions you can have a "confirmed buy" which is followed by a dump in price, that will not trigger sell signal in time. For best results use with 15m to 1h timeframes
Disclaimer:
This indicator is for informational purposes and should be used for educational purposes only. If you rely on this for trading without additional information you will loose money. I am not a financial advisor, or a professional trader. Use at your own risk.
This is an unpolished version. It may be updated and the source code published if it is used.
Customisable Moving Averages x5This is a Moving Averages pack with 5 lines.
This indicator is different from others because with it you can select the MA type used in calculations for each line.
Available MA types are (currently):
SMA
EMA
WMA
VWMA
RMA
HMA
Also configurable (for each line) are data source (open, close, hlc3, etc) and period.
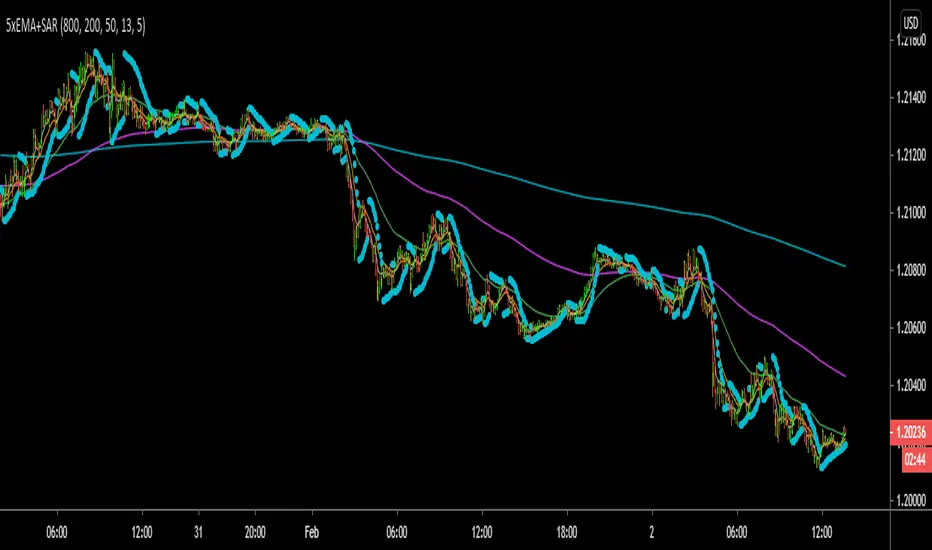
Heavy EMAThis script looks at 5 different EMAs so that you can compare the short term to the long term trend, and combines it with the Parabolic SAR. This can be used to find a great entry into a new or reversing trend.
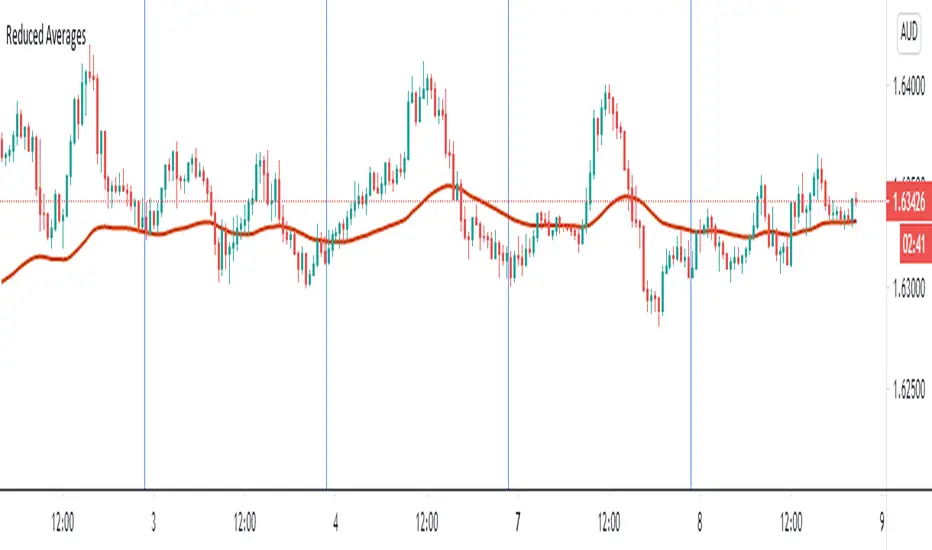
Reduced Averages (20,50,100,200)This script simply takes average value of exponential averages with a goal of reducing the noise on your chart. Many traders use a bunch of averages to identify a trend as they perfectly line up. Reduced Averages does just that. When price is close to a central line, you can comfortbly switch to another chart. When you see it deviating further away, you can enable 20 EMA, 50 EMA, 100 EMA and 200 EMA with a single click.
Combined MA Trend FilterToday I propose a simple but an effective tool to use as a trend identifier.
It is simple because it doesn't require user to tinker with it and it works on all scripts and all time frames.
It is effective because it's based on what I believe to be the most used ma's by the traders who are successful and usually trade with large qty.
So, what's under the hood?
-It's a combination of MA's and its alpha multiplier to replicate effect of higher TF MA without producing the weird square shapes.
-We are utilizing the range between the two as a way to identify "noise areas" or "ranging areas" for the price action, where taking a trade might not be the best decision.
-As soon as bar starts closing above the both MA and its alpha multiplier, it is in strong bullish zone
-And as soon as bar start closing below the same we have a strong bearish zone.
-Bar Colour coding
Lime - Strong Bullish sentiment
Yellow - Weak Sentiment (Ranged area)
Red - Strong bearish sentiment
-This indicator works in two modes, one is noise mode and one is noiseless mode.
When we select noiseless mode, we are utilizing here a filter to reduce noise, which can be also plotted on chart and option for doing so is given in settings.
Some examples?
I've used alpha of 5 in above examples (You can change it to anything you want, depending on your script and TF)
As you can see, it produces far better filtering and keeps you out from possible "noise areas" when trading, it is also good at working as scaling in and out tool for purpose of maximizing the profits when you do catch the trend.
Please note that higher the alpha you use, you will be shifting to higher TF MA, while its difficult to have a set number of set TimeFrame effect replication, its best to keep the alpha multiplier value around 5.
Authors note:
This indicator is free to use for all, I'm only protecting the code to avoid people selling it to unsuspecting new users. It happens a lot on TV.
Past performance does not mean future profit and trader is responsible for his own losses or profits, author does not take any responsibility to wrong application of the tool provided here.
Have a profitable trading journey and enjoy~

MA Cloud with FillMA Cloud with Fill
This is a powerful custom indicator that uses 3 Moving Averages with a 4th Constant 200 MA (can be customized)
This tells you what the market is doing, and what the overall trend of the market is. A good Swing trade or Day trade indicator.
This indicator works on all markets , it was made and based off of normal candles but heiken ashi works fine, it does not repaint and the recommendations for the indicator is as follows..
Best timeframes to use: 5min, 15min, and 1hr. But any timeframe can be used.
Best settings: the preset settings are what I recommend, depending on trading strategy (I swing trade) you can remove the Buy and Sell labels and just use the strong signal and trend confirmations to make the best trades.
Alternate recommended settings are in the settings tab of the indicator. The slashes represent different settings you can adjust to..
(Example:)
Fast MA: 10/20/30
Mid MA: 12/25/35
Slow MA: 50/60/70
Use 10,12,50 together... use 20,25,60 together... use 30,35,70 together.. etc...
There are multiple labels and reading them correctly takes an experienced eye. This will be updated continuously to filter bad signals or to add strong signals!
Buy and Sell signals are good entry or exit points depending on the overall trend.
These occur when the Fast MA crosses over(BUY) or under(SELL) the Mid MA
They can alert when a trend may reverse or a good take profit point or a good place for a new stop loss if trend continues.
The BEST Buy and Sell Signals are when the...
BUY is in the fill (between fast ma and slow ma) or above fast MA
SELL is in the fill (between fast ma and slow ma) or below the slow MA
Strong Buy and Strong Sell signals are even better but more swing trading entry points
These occur when the Fast MA(lime) crosses over(BUY) and the close is over the Fast MA or under(SELL) the Slow MA and close is under the Slow MA
These Strong labels are showing a trend change in the market for the timeframe you are looking at.
The General Bullish and Bearish signals are some of the best signals and show a confirmed trend in the market. These can be effective to trade on alone, otherwise good for confirming a position.
These occur when the Fast MA crosses over (BULLISH) the constant MA (200) or under (BEARISH) the constant MA (200)
The Strong Bullish and Bearish signals are the strongest signals for this indicator.
These occur when the Fast MA crosses over (BULLISH) the constant MA (200) and the close is over the Fast MA or under (BEARISH) the constant MA (200) and the close is under the Slow MA.
Background colors of aqua and red are showing the same general bullish or bearish signals, and can be effective if you want to see that trend change without having the labels showing up.
There are settings available to color the bars depending on the trend.
Green if Fast MA is over the Slow MA and the close is above the Fast MA
Red if the Slow MA is over the FAST MA and the close is under the Slow MA
Gray is when the close is opposite of the trend and between the fill
Purple is when the close is opposite of the trend and is Below the opposite corresponding MA (Above Fast MA when bearish, Below Slow MA when Bullish)
You can also change the fill color between the Fast and Slow MA which colors the fill the same as bar colors but the purple will be a light shade of black in the fill.
There are also Pivot Labels and Alternative Tops and Bottoms signals which are betting opposite of the indicators and can be useful for daytrades to see potential reversals. These are very risky and not recommended to trade on .
These are more for seeing if your trend is holding strong or if there could be a potential reversal in the next few bars if you are looking to exit.
Updates are always being made and I'm betting some of you will be able to find even better stronger settings to put in. The recommended settings are just what I personally have noticed that works best, but all inputs can be customized!
Safe Trading Strategy:
Go to settings and uncheck the buy and sell signals.
(up to you) uncheck the strong buy and strong sell signals.
You will be left with the bullish and bearish signals of both general and strong and these have proven to be some of the strongest trades to take.
If you keep the strong buy and strong sell, these can be good to enter a new position or exit a previous position, depending if bullish or bearish trend confirms but some of these can be false overall trend signals and I do recommend using a different indicator to confirm the reversal or confirmation (RSI, MacD, etc..)
Want to use this indicator or wondering how to add to your chart? DM me or join the link in my profile to get a glimpse at what is all available!
We are all in this together and the more one gains, the more we all succeed!

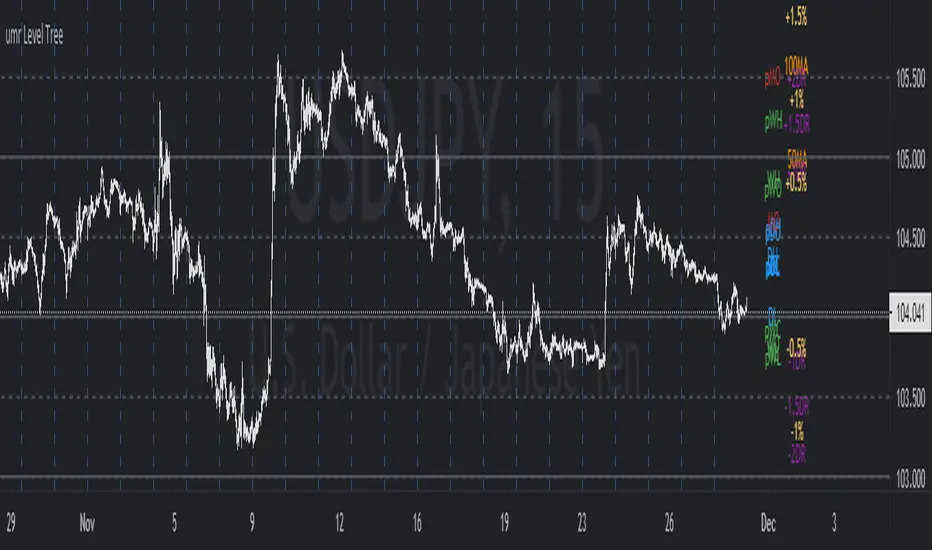
umr Level TreeShows following levels and labels (which can be individually controlled):
OHLC levels of Today, Yesterday, This week, Last week, This Month, Last Month
Daily Simple Moving Averages (50, 100, 200)
Horizontal Grid on 50, 100 pips for FX instruments.
(to do) Add ATR or Std Deviation
(to do) Add Daily Change levels % i.e. 0.5%, 1%, 2%
(to do) Add Daily change in pips levels (for fx) i.e. 50 pips, 100 pips etc
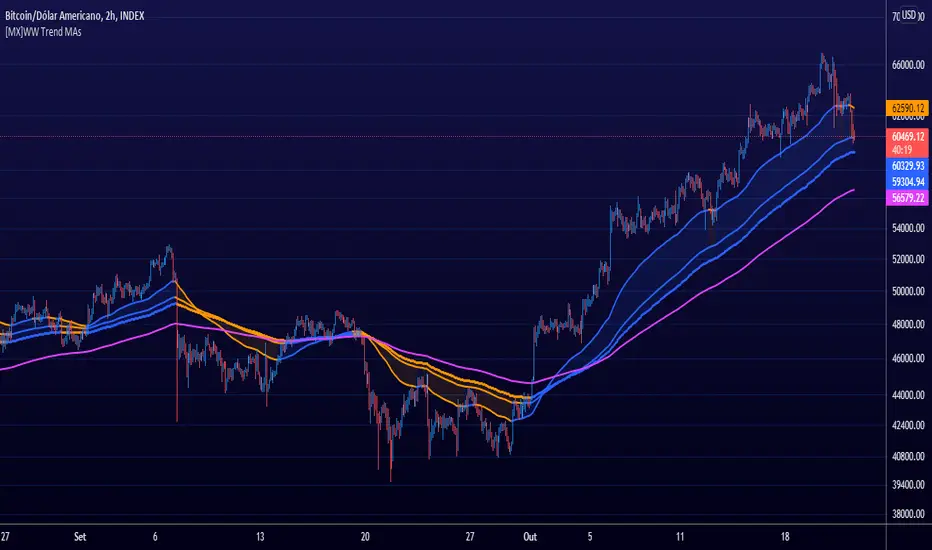
Welles Wilder MA [MX]The average of 34 periods I observe as a mobile S/R, but I usually observe it more when it is in strong trend, and the average of 72 and 89 as trend dictators, if the asset is above them = Bullish , below = Bearish , and the 144 average as the last moving S/R, and also as an S/R even stronger than all other MAs and when the asset loses that average, I see it as final confirmation of the other previous averages.
I give more importance to the average of 89 periods than to 72, because I see it as an extension to the average of 72, as if it were a trend range.
for those who prefer to observe the crossing of short and long averages as a way to see the trend, I also left this option, although I do not use
//////////////////////////////
A média de 34 periodos eu observo como um S/R móvel, mas eu costumo observar ela mais quando está em forte tendência, estando bem bearish ou jeffish, e a média de 72 e 89 como ditadoras de tendência, se o ativo está acima delas = Bullish , abaixo = Bearish , e a média de 144 como o último S/R móvel, e também como um S/R ainda mais forte que todas as outras MA's e quando o ativo perde essa média, eu vejo como confirmação final das outras médias anteriores.
Eu dou mais importância a média de 89 períodos do que a de 72, porque eu vejo ela como uma extensão a média de 72, como se fosse um range de tendência.
para quem prefere observar o cruzamento das médias curtas com as longas como forma de ver a tendência, eu deixei também essa opção, embora eu não use
MA ReboundThe MA Rebound Indicator is a single algorithm that is designed for the 30m charts of Forex, Crypto, Stocks and Indicies.
How to use;
Alerts trigger when the price has rebounded off the Moving Average and several underlying indicators confirm. You also need a higher timeframe correlation to ensure the trend is continuing.
There are a number of rules baked into the code to try and eliminate as many fake signals as possible.
This algorithm is a combination of several indicators but has trend continuation at its heart.
When to trade
The grey shaded area shows the best times to trade.
Wait for the bar to close and place a pending order with a 3 pip gap from the high or low of the candle.
MA Rebound in action
How to Access
Gain access to MA Rebound for your TradingView account through our website, links below.
7 day paid trials, subscriptions and lifetime access are all available.
All tiers give you full instructions on how to trade this strategy.

Tilson T3 and MavilimW Triple Combined StrategyInspired by truly greatful Kivanç Ozbilgic (www.tradingview.com).
The strategy tries to combined three different moving average strategies into one.
Strategies covered are:
1. Tillson T3 Moving Average Strategy
Developed by Tim Tillson, the T3 Moving Average is considered superior to traditional moving averages as it is smoother, more responsive and thus performs better in ranging market conditions as well. However, it bears the disadvantage of overshooting the price as it attempts to realign itself to current market conditions.
It incorporates a smoothing technique which allows it to plot curves more gradual than ordinary moving averages and with a smaller lag. Its smoothness is derived from the fact that it is a weighted sum of a single EMA, double EMA, triple EMA and so on. When a trend is formed, the price action will stay above or below the trend during most of its progression and will hardly be touched by any swings. Thus, a confirmed penetration of the T3 MA and the lack of a following reversal often indicates the end of a trend. Here is what the calculation looks like:
T3 = c1*e6 + c2*e5 + c3*e4 + c4*e3, where:
– e1 = EMA (Close, Period)
– e2 = EMA (e1, Period)
– e3 = EMA (e2, Period)
– e4 = EMA (e3, Period)
– e5 = EMA (e4, Period)
– e6 = EMA (e5, Period)
– a is the volume factor, default value is 0.7 but 0.618 can also be used
– c1 = – a^3
– c2 = 3*a^2 + 3*a^3
– c3 = – 6*a^2 – 3*a – 3*a^3
– c4 = 1 + 3*a + a^3 + 3*a^2
T3 MovingThe T3 Moving Average generally produces entry signals similar to other moving averages and thus is traded largely in the same manner.
Strategy for Tillson T3 is if the close crossovers T3 line and for at least five bars the close was under the T3
2. Tillson T3 Fibonacci Cross
Kivanc Ozbilgic added a second T3 line with a volume factor of 0.618 (Fibonacci Ratio) and length of 3 (fibonacci number) which can be added by selecting the T3 Fibonacci Strategy input box.
Strategy for Tillson T3 Fibo is when the Fibo Line crossover the T3 it gives long signal vice versa.
3. MavilimW
MavilimW is originally a support and resistance indicator based on fibonacci injected weighted moving averages.
Strategy for MavilimW is is if the close crossovers T3 line and for at least five bars the close was under the T3
Hope you enjoy

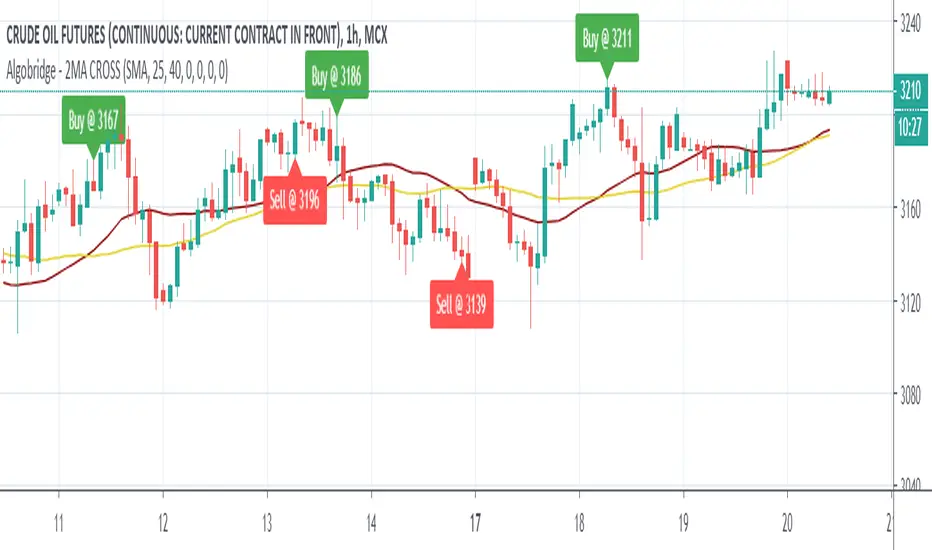
MA_CROSSOVER with SL & TPThis is the Moving Average Script Including the Stoploss and Target Levels. By Default it is working on 25 & 40 Parameters but it can change accordingly.
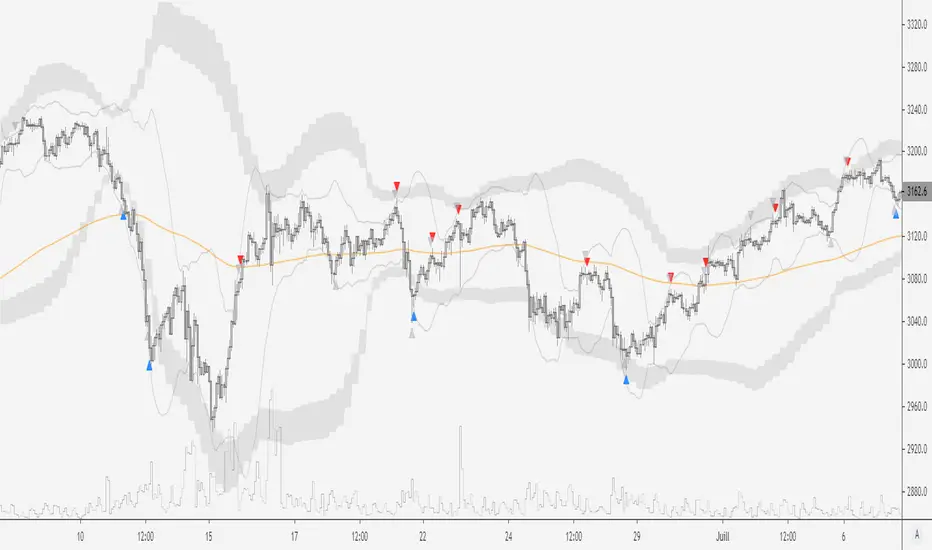
FrameKitHere are the elements that FrameKit adds to your graphic.
The Bollinger Bands of the upper TimeFrame.
As explained above, context bands are present to speed up your analysis and give you interesting areas to position on your local TF.
Also, since there are two elements in the BBs, the bands and the moving average, I have shown you a trace of this moving average for the last 40 candles. This information therefore gives you an additional technical zone to watch out for when the price approaches it, since there could be a price reaction. This may be the less useful information in FrameKit, because I personally use it very little and that's why I only displayed it for the last 40 candles. On the other hand, I don't want to saturate your chart with too much information and leaving the complete MM trace would have been superfluous and useless.
The Bollinger Bands of the local TimeFrame.
The other information that FrameKit offers you is the bollinger bands channel of the local TimeFrame. This channel is called the minor channel. This information is represented by 2 thin lines, identical to BBs. As its name indicates, the minor channel gives us additional information about the local TF and minor market fluctuations. In addition, this channel allows us to secure our position, something we will see in the risk management stage.
A 200-period Moving Average (orange line).
The penultimate information offered by FrameKit is a 200-period moving average. This MM is used a lot by Traders and that's why it's important. The 200MM, combined with another technical framework such as the Fibonacci ratios as instance, offers you once again a better information package and strengthens your conviction about the market and your trading plan. The 200 Moving Average gives a very good idea of the current trend in the medium term and it's always good to keep an eye on it! For example, it can be useful in a context such as pull-back within a trend. Also be aware that you can change the period’s number of the moving average by clicking on the settings button besides the Framekit indicator. Then change the value over EMA Lenght. That said, I recommend using the 200MM since it gives us a good view of the current market.
TD9
Finally, the last information that FrameKit gives us is the TD9 Sequential, that can be activated by going again in the FrameKit settings and checking the box “Show TD9 Sequential”.
Here is the TimeFrame List for the indicator, but you can also access this list with the google sheets on Teachable.
1M = 5M
3M = 15M
5M = 15M
15M = 1H
30M = 2H
1H = 4H
2H = Daily
4H = Daily
Daily = Weekly
Weekly = Monthly
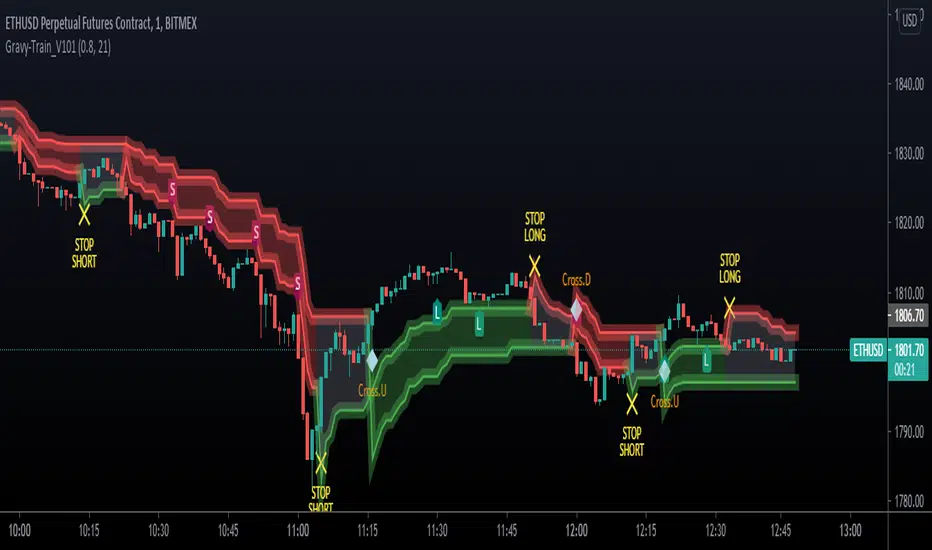
UTG - Gravy TrainThe most complex indicator we've ever developed.
Works on ALL MARKETS!
Gravy Train is a ALL IN ONE - ONE GLANCE indicator.
- It allows you to gauge trend, gives you appropriate LONG & SHORT identifiers
- It identifies when the trades should be over
- Cloud based support & resistance Zones drawn on the chart
- It keeps you OUT of the market in areas of indecision
- It works on ALL timeframes
- Takes the emotion out of trading various markets
- Gravy Train is Unity Trading Groups bread and butter for Scalping, Swing Trading, Position Trading & Day Trading
Unity Trading Group is proud to present Gravy Train!
To gain access to this script, you can find our details in our Signature, use the links below to find out!