Moving Average pooria563sma moving average 20 , 50 , 100, 200 that you choose one of them that you want.
Moving
Artharjan Market AnalysisHi,
I have created Artharjan Market Analysis dashboard to help traders to take complete view of the stocks of a particular sector or a benchmark index and track them simultaneously.
With this indicator dashboard, traders will be able to track 13 scripts simultaneously. This dashboard has following features and will help gain loads of valuable information during intraday as well as positional trading.
Information provided:
1] Traders will be able to track 13 scripts of their choice and get real time Buy/Sell Signals
2] Traders will be able to chose the timeframe of their choice by changing the setting called "Timeframe" OR keep the timeframe as that on the chart by keeping the Timeframe = "Chart".
3] Traders will be able to adjust the thickness of the Moving Averages Plotted on the Chart
4] Traders will be able to select the Table position and Table Text Size.
5] For volume analysis select a separate Lookback period for Daily/Weekly/Monthly timeframes and a separate Lookback period for Intraday timeframe. You may keep both same as per your choice.
6] Plot smoothed RSI (WMA of closing price used as an input for RSI) . Default smoothing used is 5. But if you dont want to use smoothing then set it to 1 and RAW RSI will be plotted.
7] For plotting RSI select a separate Lookback period for Daily/Weekly/Monthly timeframes and a separate Lookback period for Intraday timeframe. You may keep both same as per your choice.
8] For RSI set the Overbought and Oversold Levels of your choice.
9] Similarly user will be able to set its own timeframe for calculating Elders Force Index and Commodity Channel Index, and also set the Overbought and Oversold Levels of your choice.
10] Traders will have a choice to monitor Stock Price with reference to 3 Super Trend indicators based on 3 different parameters of their choice.
11] To calculate the Relative Strength and Moving Average High/Low Bands I have used the lookback period of 55 and used RMA instead of SMA or EMAs since I found that RMAs are more reliable than SMA or EMAs.
12] To measure the relative strength of a Stock w.r.t. a Benchmark Index or a Sectoral Index, user will have to select the RS - Comparative Symbol. This Comparative Symbol (Script) will be used to measure the relative strength of all the 13 scripts.
13] Kindly note that since this Dashboard will monitor 13 scripts simultaneously it will occupy huge space on the chart, hence I have made a provision to select the number of scripts to be shown on the dashboard minimum is 1 and max is 13.
14] With this indicator you will be able to monitor the price action and following indicators.
a) Last Traded Price
b) Price Change (Between Current candle and previous candle of the selected timeframe)
c) Price Change Percentage (Between Current candle and previous candle of the selected timeframe)
d) Volume Change (Between Current candle and previous candle of the selected timeframe)
e) Volume vs. SMA(Volume) with different color shaded ranging from -ve values to 100%, 100% to 200%, 200% to 500% and more than 500%
f) If Price is above VWAP then its a Buy else its a Sell signal
g) Signals based on RSI values and its corresponding relation with Overbought and Oversold Levels -such as Bullish, Bearish, Long Unwinding, Short Covering, Long Buildup, Short Buildup, Neutral levels
h) 3 Supertrend Indicators
i) Central Pivot Range (Calculated on a Daily Timeframe) - If LTP > CPR = Bullish, LTV < CPR = Bearish else Neutral
j) Elders Force Index - If EFI > 0 Buy if EFI < 0 Sell
k) Signals based on CCI values and its corresponding relation with Overbought and Oversold Levels -such as Bullish, Bearish, Long Unwinding, Short Covering, Long Buildup, Short Buildup, Neutral levels
l) Moving Average Envelop of 55 RMA calculated on Highs and Lows. If Low > Upperband = Bullish, if High < Lowerband = Bearish else Neutral
m) Relative Strength (RS). If RS of a Script in comparison to the Comparative Symbol is positive then it will shown in Green else it will be shown in Red color.
Kindly note that for Index scripts have got no volume so all indicators (Volume, SMA(Volume), VWAP and EFI) which require Volume as an Input parameter will be shown in Gray color because there is no volume data available to calculate these Indicator values and determine whether the Index is in Bullish Territory or in Bearish territory.
I hope you would enjoy using this indicator and it will act as a light house in your trading journey.
Warm regards
Rahul Desai
@Artharjan

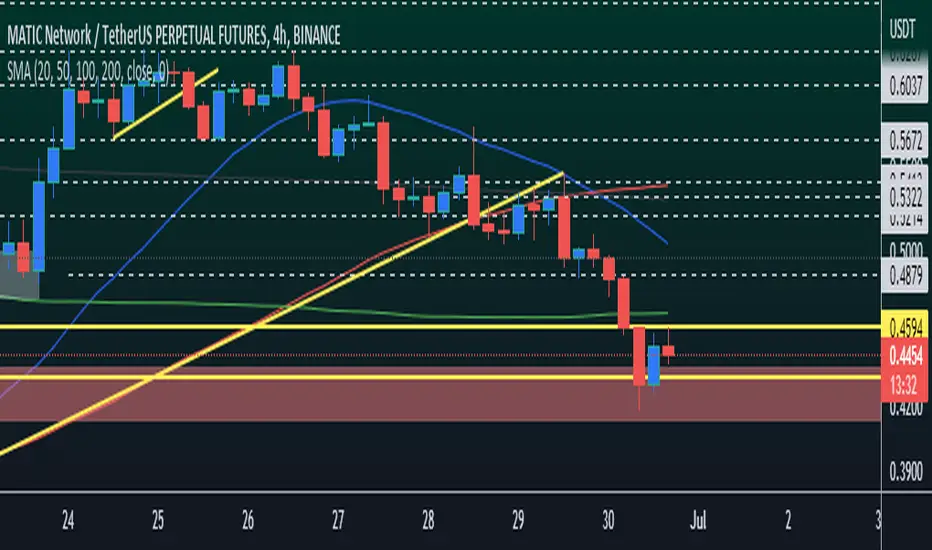
VWAP/EMA50/EMA200We script this one for combining VWAP , EMA50 and EMA200. The tool is fantastic if traders know how VWAP , EMA work? Just adding this script in your favorite and work like charm:
VWAP: How to trade with that
- One of the simplest uses of the VWAP is gauging support and/or resistance.
- A trader who is long a stock can use the VWAP as a target exit if its trading below.
- A stock trading over intraday VWAP may be bullish , while a stock trading under may be bearish .
EMA 50/EMA200: How to trade with that timeframe 50-day or 200-day period
- Identify the trend of market in longterm
- Golden-cross (short term EMA cross above longterm EMA ) is call golden-cross signals. It is opportunity for buying.
- Deal-cross ( short term EMA cross below longterm EMA ) is call dead-cross signals. It is opportunity for selling.
- Identify support levels
- Identify resistance levels
Let me know if you see anything else that should be added/changed.

Weeknights Momentum CloudA very simple moving average cloud to assess momentum. This indicator is not meant to be used for entry triggers, but rather to see when momentum may be shifting to the downside
Can be used on any time frame, and should be used in conjunction to your current trading plan
Distance From Moving AverageThis indicator shows the distance between the current price and the Moving Average price.
Key Features:
Show the distance between price and Moving Average (Read Distance Calculation for more information)
Show Historic Highs and Lows
Show Highest High and Lowest Low
Show current Highest High, current Lowest Low and current distance
Key Indicator Settings:
1. Distance Calculation
There are two ways to calculate the distance:
Spread - Calculate the difference between the price and the moving average
Percentage - Calculate the percentage change between the price and the moving average
2. Moving Average Types
There are 5 different Moving Averages:
EMA
SMA
WMA
VWMA
HMA
3. Highest High and Lowest Low
You can show or hide the Highest High and the Lowest Low plots of the series
4. Historic Highs and Lows
You can show or hide past Highs and Lows of the series
Lookback Length - Let's you adjust the frequency of local highs and lows of the series
5. Current Values
You can show or hide current value labels

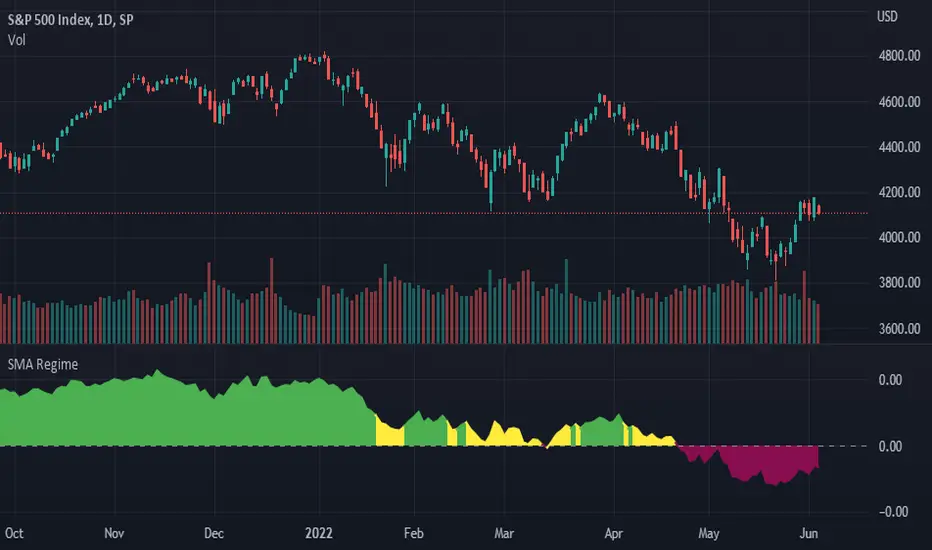
SMA RegimeProvides a color coded indicator based upon both the slope of a moving average of choice, and the asset's position in relation to that moving average. If the specified moving average is downward sloping and the asset closes below the moving average the indicator will be red. If the specified moving average is upward sloping and the asset closes above the moving average the indicator will be green. Any other combination of these two factors will color the indicator yellow indicating indecision.
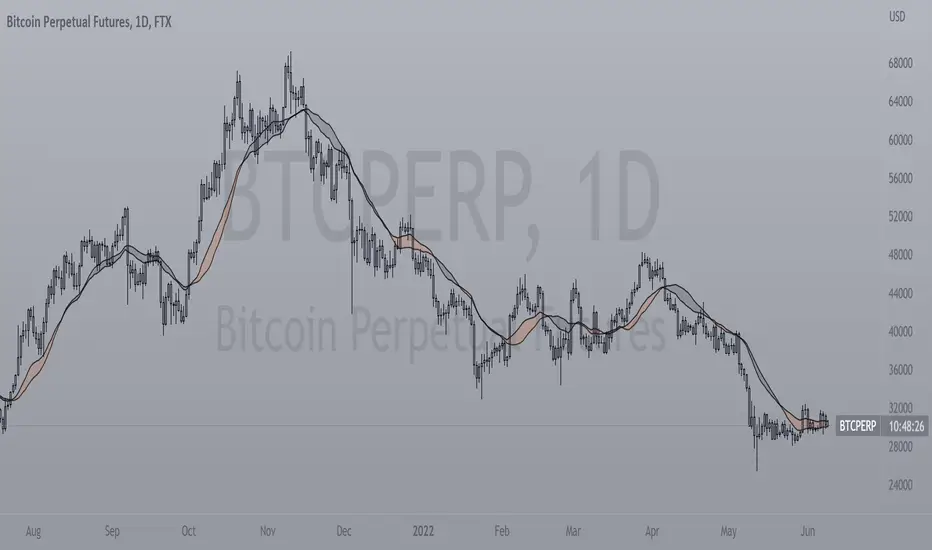
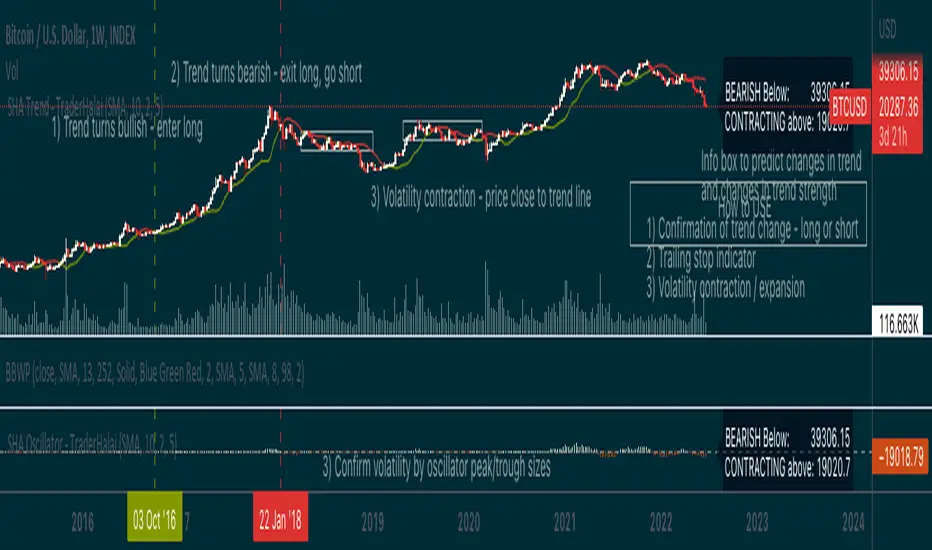
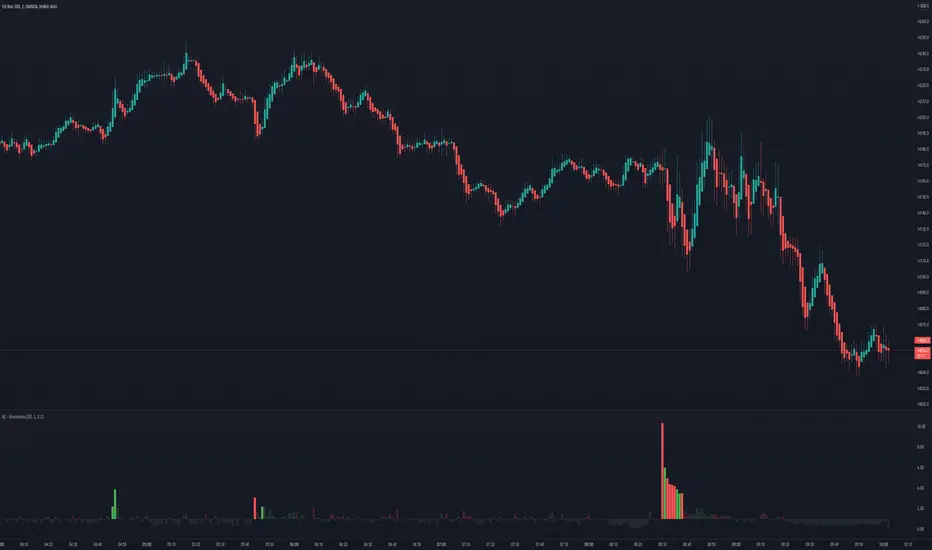
Smoothed Heikin Ashi Trend on Chart - TraderHalaiThis indicator is a predictive tool using Heikinashi to calculate shifts in trade direction.
It works by reverse-engineering the regular candle stick closing price required, to flip the Heiken Ashi candle from Red to Green and vice-versa.
Below, is an earlier indicator that I released and created. This plots this price as an oscillator, which allows traders to get a predictive indicator of a trend change.
This indicator extends upon this functionality by adding a smoothing function to the reverse-engineered regular candle stick closing price, to reduce the choppiness of signals. It also plots the indicator on the chart to allow for easier visual confirmation.
How to use
1) As a directional bias - Bullish or bearish
2) Volatility expansion/contraction - further distance from line means volatility expansion - am planning to release an oscillator version also
3) Trailing stop loss - once you are in a trade
Other Features
Select a moving average period and smoothing calculation method (e.g. SMA / EMA)
Non-repaint mode for backtesting and use/integration with higher timeframes
Final note - Open Source
I am releasing this as open-source for the benefit of the community and to allow further development, scrutiny and criticism. Please feel free to use this indicator as you see fit. If you do use this indicator to create another script, feel free to drop me a note, as I would be highly interested in your idea.
Thanks, and Enjoy!
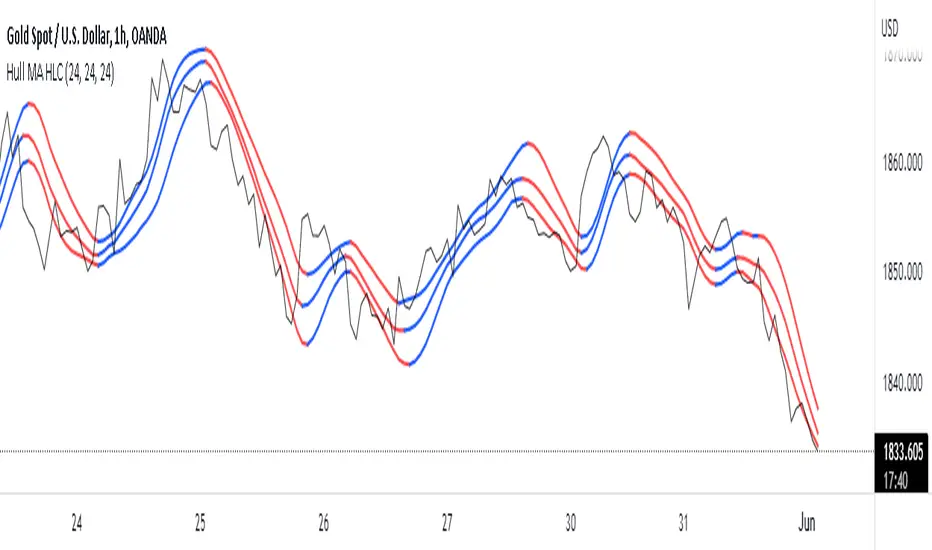
Hull MA HLCThis Indicator calculates and plots 3 Hull Moving Averages with the same period based on the High, Low & Close price.
The color of plot changes to indicate positive or negative slope.
Original Hull MA code written by mohamed982 | Original Triple Hull MA code written by CMKirkham
This triple Hull MA HLC (High Low Close) Pine v5 code written by MaxDecimus 2022
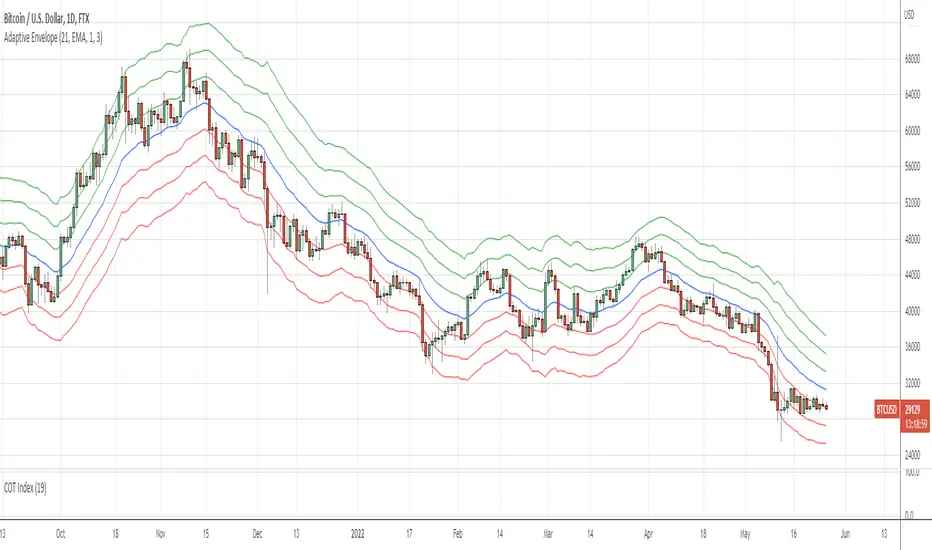
Adaptive EnvelopeI bring to your attention a dynamic indicator Adaptive Envelope .
The main qualitative characteristic of the technical indicator is adaptability. This means that it does not need to be adjusted for each tool. The adaptive envelope itself dynamically adjusts to the volatility of each individual instrument, or even timeframe.
And thanks to a wide range of settings, the indicator can be adjusted to your needs. Let's consider an example of the use of the indicator in trading.
Option #1. The envelope shows the "stretch" of the market - that is, the price of the asset beyond normal volatility. And it is at such moments that the probability of returning to the average is highest. That is, for such a signal, we wait for the exit to the moving average, and when returning with a stop order, we enter the averaging direction.
Option #2. Another option for trading is to buy at the lower level, as well as additional purchases along the lines of the envelope. Exit - on the middle line of the envelope (for shorts on the contrary) - so we have a full adaptability of the strategy. I repeat that due to adaptability, there will be no need to reconfigure when changing market characteristics.
Thank you for attention. Sincerely, Oleksandr Yanchak. Capitalizator.UA
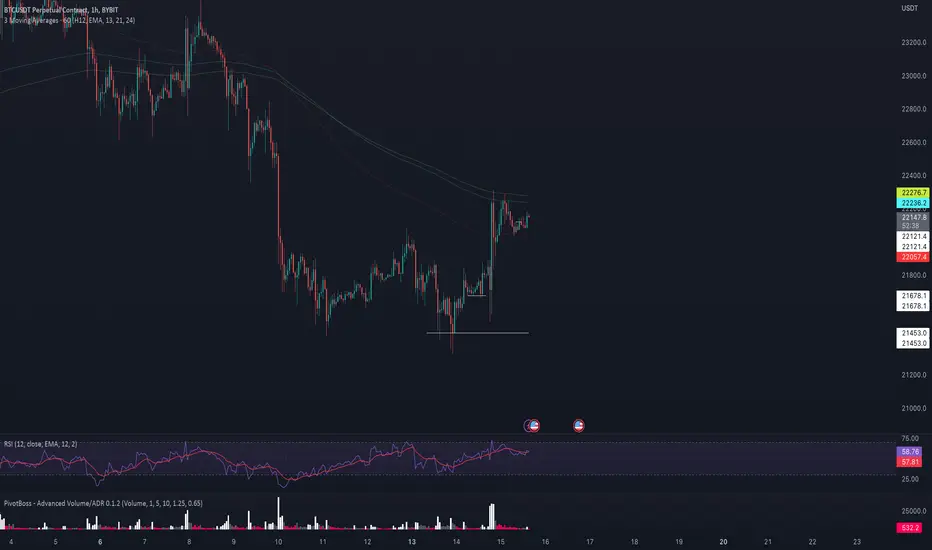
Moving Average Multipliers MTF (Mescu)Includes 4 customizable Moving Average with multipliers and multi-timeframe (MTF).
Tweaks the parameters to your liking, it should be pretty simple to understand
Used here with BTC/USD (1W) to identify good sell and buy zone for Bitcoin.
Got the idea from the 2-year MA Multiplier indicator, but didn't find something of my liking on TradingView, so I made my own.
Drop me a comment if you have any questions, suggestions, improvements.
Mescu
www.tradingview.com

Risk Management & Position Size DashboardRisk Management and Position Size Calculator
This indicator is designed to assist traders by instantly providing the necessary information to execute orders based on defined risk parameters. This is not an indicator that tells you WHEN to buy or sell, but HOW MUCH to buy or sell based on your risk appetite. The indicator is compatible with any strategy and any instrument
The indicator uses some great pinescript features, allowing you to drag and drop your levels directly on the chart for instant feedback from the risk management dashboard. Huge timesaver.
Instructions:
1. The first time you add the indicator to your chart, you will be asked to identify your Entry, Stop and Target levels by clicking on them directly on the chart. You can at any point adjust these levels directly on the chart, or you can manually enter them in settings
2. Setup your risk profile in the indicator settings:
(a) Current Capital: Enter the current value of your trading account
(b) Max Risk Per Trade: Enter the maximum % of your Capital you want to risk per trade
(c) Max Leverage: Enter the maximum leverage you want applied to your account. This comes in handy when you trade on very low timeframes where position sizes can become very large. No matter what you enter here, position size will never exceed Max Risk Per Trade
(d) Stop Ticks: Number of ticks to use above/below the identified high/low for stops
(e) Use Current Price as Entry (Market Orders): By default, the system will use the entry level you have selected for limit orders. If you want to use the system to display data based on current price for market orders, select “Use Current Price as Entry (Market Orders)”
3. Based on your stop and target levels, the system will automatically display the dashboard for Longs (bottom of screen) or Shorts (top of screen). The levels will also be displayed to the right of the current price bar
4. Display Free Trade Level: toggle this on to display the level you should exit 50% of your position to make the trade risk free
5. Dashboard / Text size and level colours and positions are customisable
The Dashboard displays the following information at all times:
1. Entry
2. Stop
3. Trade Risk (%): Percentage price difference between Entry and Stop
4. Max Risk ($): Currency value of loss if the trade is stopped out
5. Size: Position Size to execute your trade based on your risk profile/appetite
6. Size($): Position Size in currency value
7. P&L($): Potential profit to your Capital in currency value
8. P&L(%): Potential profit to your Capital in %
9. R:R: Risk to Reward Ratio
10. % to Target: Percent price needs to move to achieve your target
Hope this helps you with your trading. I built this as I was tired of wasting time opening up spreadsheets or calculators to execute trades - especially on lower timeframes. Making the code open source so if you do make improvements to this I'd love to hear from you. Also open to suggestions.
Happy Trading!
Vtrend MAcross BarColorThis script is an MA crossover using the 10 and 38 EMAs for long and short signals, combined with barcolor highlights to help identify for trend purposes.
What makes it unique are the reversal signals based on candle type, support and resistance levels, key level opens (daily,weekly,monthly,yearly)

TWAP + MA crossover Study [Dynamic Signal Lab]Dear TV'ers,
Hereby the study for the TWAP/moving average crossover, with taking profit options.
moving averages include: EMA , WMA , DEMA , TEMA , VAR, WWMA, ZLEMA , TSF , HULL, TILL
It is also possible to gradually take profit, using:
* minimum consecutive green/red candles
* minimum amount of green/red candles in the last 2-8 candles
* both of the above criteria
The slightly transparent green fill shows how much you are in profit from your entry point
The current default properties should be modified to make this strategy cost-effective, but typically 15 minutes and higher timeframes (up to 6hr) seem to work well for larger (top10 cap) crypto projects. Don't use this script for small-caps as it will get you rekt, due to wild volatility.
Additionally, you'll also be able to continuously take profit, making sure you lock in all those sweet profits. For backtesting: use the strategy version of this script

Dashed Line Moving AveragesHere's a simple script which i concocted using ideas from various authors with the goal of creating a slightly better Moving Average dashed line script imo...I think i managed to do just that and a bit more.. =)
Features:
- Contains one of each VWMA SMA EMA. You can set the input length.
- Ability to set spacing between characters of the plotted moving average line
- Horizontal offset of the moving average lines (just in case)
- Can add any fancy characters that suits your taste e.g ( . , _ , -, !, *, rocket, lava, etc) to the moving average
- If you duplicate the script and modify the "Size" parameter of the plotchar() function's variables with the choices provided in the commented-out code; you can have some fun!
This script is for entertainment & educational purposes only.

Moving Average Deviation by MGLMoving Average Deviation indicates the deviation of the price from the moving average.
Basic settings:
Period: How many candles are taken into calculation. (Default 12)
Source: Default is close. Indicates that the closing price is taken to calculate the moving average.
The type of moving average is SMA (You cannot change this)
Calculations
The indicator bar is formed as a result of the moving average price substrating from the present price. If the value is positive, the bar will appear above the middle 0 line. If the value is negative, the bar will form below it.
The bars on the indicator histogram will appear above the 0 line when the price of the financial instrument plots over the moving average price.
You will see the bars below the 0 line when the price is beneath the MA price.
The bars will be green in colour when the asset‘s price is rising.
They will be red when the price is diminishing.
--- Español
Moving Average Deviation (o Desviación de la media móvil) indica la desviación del precio desde la media móvil.
Configuración básica:
Periodo: Cuántas velas serán tomadas en el cálculo (Por defecto aparecen 12)
Fuente: Por defecto es "close" o precio de cierre. Indica que el precio de cierre es lo que se toma como parte del cálculo para la media móvil.
El tipo de media móvil es el SMA (No puedes cambiar eso).
Cálculos:
Cada barra se forma de color verde (por defecto) si es superior a la anterior barra. Es roja (por defecto) si es de un precio inferior a la anterior.
Y si el valor es positivo, la barra aparecerá en la parte superior de la línea del cero. En caso sea negativo, la barra se formará por debajo.

Bogdan Ciocoiu - GreuceanuDescription
This indicator is an entry-level script that simplifies volume interpretation for beginning traders.
It is a handy tool that removes all the noise and focuses traders on identifying potential smart money injections.
Uniqueness
This indicator is unique because it introduces the principle of a moving average in the context of volume and then compares it with tick-based volume.
Its uniqueness is reflected in the ability to colour code each volume bar based on the intensity of each relevant (volume) unit whilst comparing it with the volume moving average.
Another benefit of this indicator is the colour coding scheme that removes volume below a particular threshold (default set to 1) under the volume moving average.
In addition to the above features, the indicator differentiates the colour of each bar by price direction.
Open source re-use
To achieve this functionality several open source indicators have been used an integrated within the current one.
High-pass filterHigh-pass filter | Pine Utilities series, ready to be used in "study-on-study" fashion |
Represents the difference between the filter and the original unfiltered data.
How to use:
1) Add a filter to your chart (in this particular case it was 4-pole Gaussian filter implemented by @everget, ty man);
2) Tap ... on your's filter status line and choose "Add study/strategy on ...", then choose High-pass filter. Alternatively, add high-pass filter directly to your chart, then High-pass filter's settings -> Basis -> choose the filter you've applied during the step 1;
3) Choose the source (op2 and hlcc4 are available as well);
4) See the difference (literally).
Peace TV

End Point Moving Average [EPMA]The End Point Moving Average was introduced in the October 95 issue of Technical Analysis of Stocks &
Commodities in the article "The End Point Moving Average", by Patrick E. Lafferty.
The Time Series Forecast takes this value and the slope of the regression line to forecast the next day and then plots this forecasted price as today's value.
For interpretation refer to Mr. Lafferty's article.
Please note
From line 10 starts my personal experemental modifications to this script, all above is original formula by Patrick E. Lafferty.

Momentum RibbonThe Momentum Ribbon is a collection of Moving Averages which indicate the severity of pull-backs in a given market.
As the ribbon spreads apart, it indicates more and more significant support/resistance for a trending market. As it is compressed back together, it displays a blue colour to indicate a "cooling" of trend momentum.
Adjustable Moving Average periods and types! You can customize the parameters of your ribbon to your heart's content!

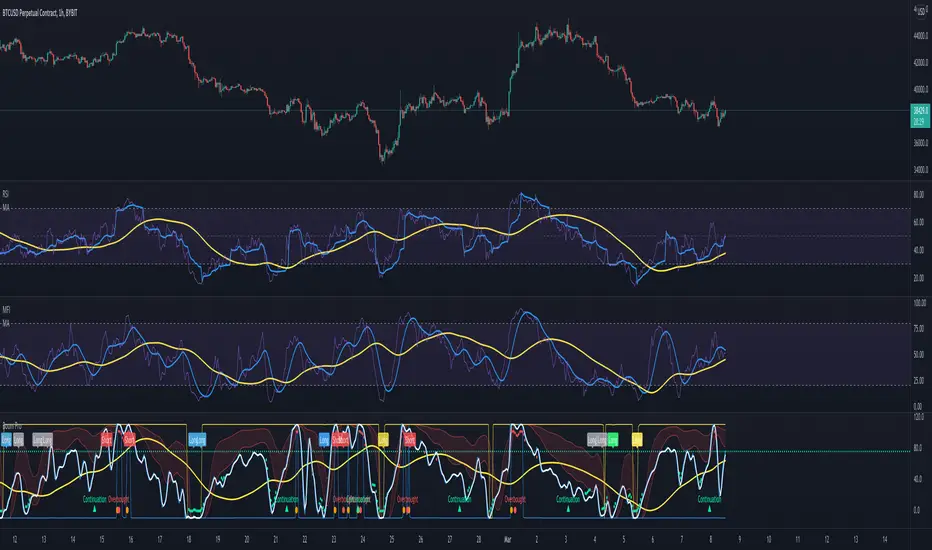
Moving Average Tool for IndicatorsThis indicator drops up to 2 moving average lines on top of any indicator. There are 11 different moving averages to choose from including 2 of my own, ZLSMA and WMA MOD. It also comes with a fixed scale option so you can lock it to an indicators scale. Simply click the enable button and enter the scale high and low of the indicator you want to track. In most cases it is 100-0. To use this moving average tool just load up any indicator like RSI or MFI etc then load up the Moving Average Tool for Indicators and drop it on top. In the settings choose the indicator you want to track in the source box. Now you can easily find entries and identify trends that were not so obvious.
This is a very handy tool that will extend the usability of all your indicators. It can even track other timeframes. Below is a screenshot working with Awesome Oscillator.
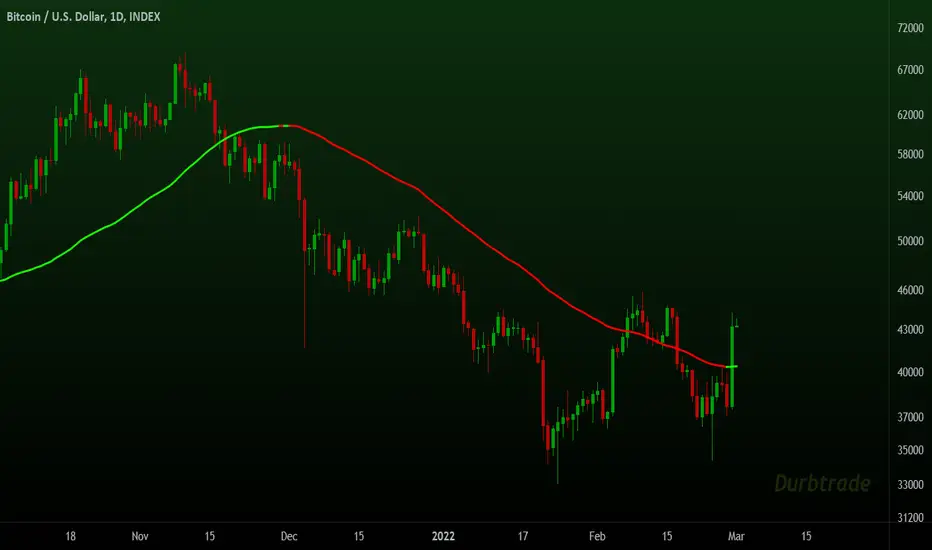
Moving Averages System - DurbtradeMoving Averages System - Durbtrade
1 indicator... customizable.
Displays up to 4 independent Moving Averages (MA's) at once.
Each MA can be 1 of 6 "MA Types" : SMA, EMA, WMA, VWMA, HMA, or DEMA.
There are 7 individual fills...
4 "MA/Source Fills" and 3 "MA/MA Fills".
The "Source" is selectable,
and there is a "Source Plot" option
to display a plot of the source.
No max value for MA "Length".
Each MA has what I call a "Length Multiplier",
and each MA has its own "Offset".
The colors of each MA,
as well as the Source Plot,
can be up/down "Color-Changing", or solid.
"Line Thickness" is unlimited.
Each of the 3 "MA/MA Fills" allow you to select which 2 of the 4 MA's to fill between!
All 7 fills are customizable by above/below colors, and opacity.
All 7 fills include a "Color Swap" option,
in the case that you need to switch the display of the above-color to the below-color,
and the below-color to the above-color!
All plots are scripted to be drawn visually in front of all fills!
Lastly, you can turn off the display of the MA plots and the Source Plot...
allowing the display of only fills!
--------------------------------------------
--------------------------------------------
Let's take a more detailed look!
First, let's go through the settings, and how to use the Moving Averages System.
You can divide the Inputs tab of the indicator settings into 3 main sections...
1 - Moving Averages
2 - Source Plot, and MA/Source Fills
3 - MA/MA fills
Let's discuss the first section, which is where we set up our MA's.
Here, we see the parameters for our 4 Moving Averages :
All 4 MA's can be customized here in the following ways...
- Toggle ON/OFF by checking the checkbox
- Length
- Length Multiplier
- Type (SMA, EMA, WMA, VWMA, HMA, or DEMA)
- Up/Down Color Change ON/OFF
- Line Thickness
- Offset
(The Plot Styles, Up/Down/Solid Colors, and Opacities of all 4 MA's
are customizable under the Style tab of the indicator settings)
There are no maximum value limitations for Length, Line Thickness, and Offset.
Of note, the "Length Multiplier" multiplies the "Length" value by a chosen integer.
This can be used to incrementally scan a wide spectrum of lengths very quickly.
Or it can be used to maintain ratios while increasing the MA display lengths...
just multiply all lengths by the same number.
It can also be used to easily create a moving average ribbon
by using multiple Moving Average Systems all at once.
Or, it can be another method to set up higher-timeframe MA's on a lower-timeframe chart...
for example, if both the chart and indicator are on the 1Hour timeframe,
you can multiply all of your set lengths by 24
to see the 1Day MA's of those same lengths on the 1Hour chart.
Next, lets look at the second section of the Inputs tab of the indicator settings,
where we edit the "Source Plot" and "MA/Source Fills".
We can turn ON/OFF the "Source Plot" -
which plots a line of the "Source" that you have selected -
and edit the parameters :
Checking the "Source Plot" box turns the "Source Plot" ON/OFF.
You can turn Up/Down Color Change ON/OFF,
and adjust Line Thickness and Offset.
(The Plot Style, Up/Down/Solid Colors, and all Opacities of the Source Plot
are customizable under the Style tab of the indicator settings.)
Next is where you can turn ON/OFF and edit each "MA/Source Fill".
Checking the "MA#1/Source Fill" box turns on the fill between MA#1 and the source.
You can choose the color and opacity for the above-color and the below-color.
Need to switch the display of the two colors?... turn on "Color Swap" to easily do just that.
The remaining 3 MA/Source Fills work in the same exact way...
turning on a fill between the associated MA#, and the source.
In total, there are 4 MA/Source Fills... 1 for each MA.
Note that neither the Source Plot, nor any of the MA's, need to be turned on
in order to use the MA/Source Fills.
Finally, lets look at the third section of the Inputs tab of the indicator settings.
This is where we can edit the 3 "MA/MA Fills".
An MA/MA Fill allows you to select any 2 of the 4 MA's that you have set,
and fill the space between them with color :
Checking the MA/MA Fill box turns ON/OFF the associated MA/MA Fill.
Below each ON/OFF switch are 2 boxes where you can select the 2 MA's that you want to fill between.
Select the 2 MA's that you want to use according to their MA#'s.
Next, you have the Above/Below Color/Opacity for the associated MA/MA Fill,
and lastly, the Color Swap option.
The numerical order of the MA#'s that you select here is of no concern,
because each MA/MA Fill has that "Color Swap" option...
and, as before, this swaps the display of the above-color and the below-color.
Note that the MA's do not need to be turned on
in order to use the MA/MA Fills.
--------------------------------------------
Additional Notes :
All colors and opacities of this indicator can be customized.
All fills can have above/below colors, and all plots can have up/down colors.
All fills and plots can be one static color, too.
All plots can be 1 of 10 plot styles:
Line, Line with Breaks, Step Line, Step Line with Diamonds, Histogram,
Cross, Area, Area with Breaks, Columns, or Circles.
All plots use the same single "Source", which is selectable.
And don't forget... you can try applying this indicator to other indicators!
--------------------------------------------
Now, let's take a look at some examples of the Durbtrade Moving Averages System in action!
All 4 MA's plots on, MA Type is SMA, color-changing on, lengths 50, 100, 150, and 200 :
Add the Source Plot, and all 4 MA/Source Fills :
Add the 3 MA/MA fills :
Turn off candles visibility, and turn off MA color-change :
Turn off the MA plots :
Turn off the Source Plot :
...
Here are some other images using the Multi Moving Average Tool :
Here it is on the 1Second :
Here it is on the 3Day :
Here is your 1Day SMA DeathCross :
Use 3 Moving Average Systems at once to build your own EMA Ribbon :
Compare 4 different MA types, all with the same length :
--------------------------------------------
Script Stats :
Pinescript Version : 5
Code Length : 149 Lines
Total Plots : 16
- Visible Plots : 5 (4 MA Plots, 1 Source Plot)
- Invisible Plots : 11 (4 MA Plots, 1 Source Plot, 6 MA/MA Fill Plots)
Total Fills : 7 (4 MA/Source Fills, 3 MA/MA Fills)
Total Colors/Opacities : 29
Total Unique Variables : 92
- Input Variables : 69
- Unique Output Variables : 23
--------------------------------------------
Final Thoughts :
I'm excited to share the Durbtrade Moving Averages System!
I think that this indicator has a wide range of MA-related applications,
an easy-to-use interface with maximum customization, and unique fill features...
all in one indicator.
I feel that it is a quick and useful tool
whether you are just plotting a few moving averages...
or you are creating intense kaleidoscopic tidal waves of colored data!
Either way, I think it is pretty awesome,
and so, I wanted to share it with you...
I hope that you enjoy it and find it useful!
- Please feel free to comment your thoughts, critiques, or suggestions. They are all very helpful!
- Also, please feel free to comment any positive feedback, or awesome screencaps/ideas of the indicator in action!
- Check out my other Pinescript indicators if you like this one... they work well together.
- I hope that you find this script useful.
- Enjoy!
--------------------------------------------
// Durbtrade
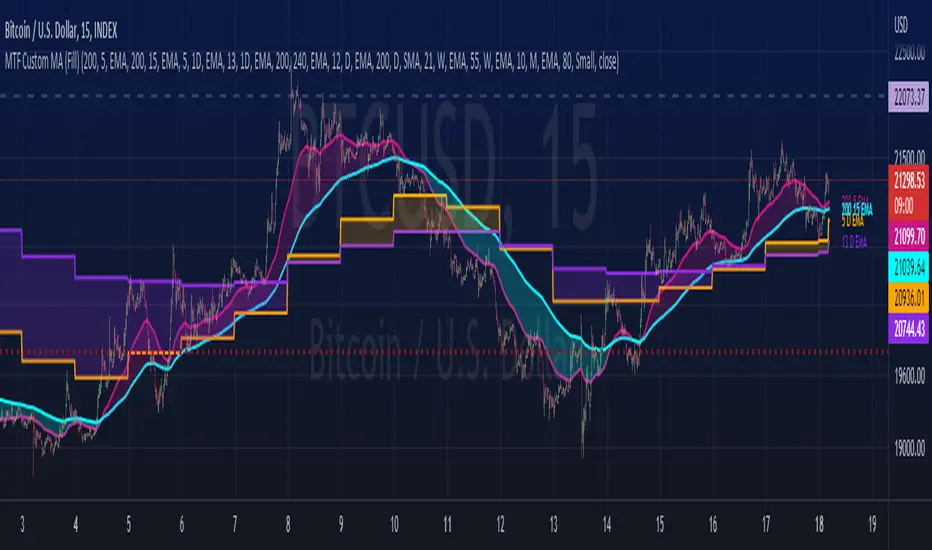
MTF Custom Moving AveragesThis user-friendly indicator allows up to 8 moving averages ( EMA or SMA ) from any timeframe, on any time frame. There are plenty of other MTF MA indicators, each with their own pros and cons. I wanted to make one without the cons:
- Independently set each MA to Exponential or Simple
- No preset lengths
- No preset timeframes
- Optional labels to help keep track of the period/length/type of each plot
- Clean, intuitive input layout
- More than enough MAs available to use one indicator for several use cases... just check/uncheck the ones that are relevant to each chart
Watch for death crosses on the 4hr while monitoring the "Bull Market Support band" (Weekly 21 EMA and 20 SMA ) and checking the Monthly 10 EMA for major support or resistance. Toggle between half of the available MAs for long term BTC trends and use the others for your alts. Use this one indicator to support multiple strategies.
Please leave a comment if you find it useful or have suggestions!
Inspired by the first MTF indicator I found: Weekly Moving Average by TommyTompsen.
Weighted Least Squares Moving AverageLinearly Weighted Ordinary Least Squares Moving Regression
aka Weighted Least Squares Moving Average -> WLSMA
^^ called it this way just to for... damn, forgot the word
Totally pwns LSMA for some purposes here's why (just look up):
- 'realistically' the same smoothness;
- less lag;
- less overshoot;
- more or less same computationally intensive.
"Pretty cool, huh?", Bucky Roberts©, thenewboston
Now, would you please (just look down) and see the comparison of impulse & step responses:
Impulse responses
Step responses
Ain't it beautiful?
"Motivation behind the concept & rationale", by gorx1
Many been trippin' applying stats methods that require normally distributed data to time series, hence all these B*ll**** Bands and stuff don't really work as it should, while people blame themselves and buy snake oil seminars bout trading psychology, instead of using proper tools. Price... Neither population nor the samples are neither normally nor log-normally distributed. So we can't use all the stuff if we wanna get better results. I'm not talking bout passing each rolling window to a stat test in order to get the proper descriptor, that's the whole different story.
Instead we can leverage the fact that our data is time-series hence we can apply linear weighting, basically we extract another info component from the data and use it to get better results. Volume, range weighting don't make much sense (saying that based on both common sense and test results). Tick count per bar, that would be nice tho... this is the way to measure "intensity". But we don't have it on TV unfortunately.
Anyways, I'm both unhappy that no1 dropped it before me during all these years so I gotta do it myself, and happy that I can give smth cool to every1
Here is it, for you.
P.S.: the script contains standalone functions to calculate linearly weighted variance, linearly weighted standard deviation, linearly weighted covariance and linearly weighted correlation.
Good hunting