Indicador Pine Script®
Nuvem de Ichimoku

Estratégia Pine Script®

Indicador Pine Script®
IchiMA ChannelEstrategia basada en un principio de ichimoku, Green Long , Red Short.
Make it simple.
Indicador Pine Script®

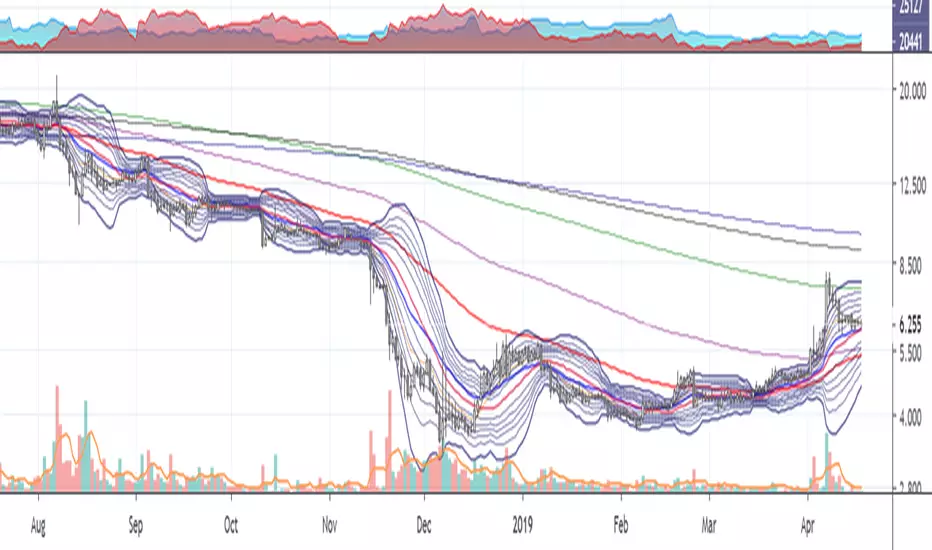
HARA's favorite indicator by Theo ParkThis indicator contains :
4 Ichimoku clouds
8 Moving Averages
1 Fibonacci Bollinger Bands
2 Normal Bollinger Bands
Indicador Pine Script®
Indicador Pine Script®

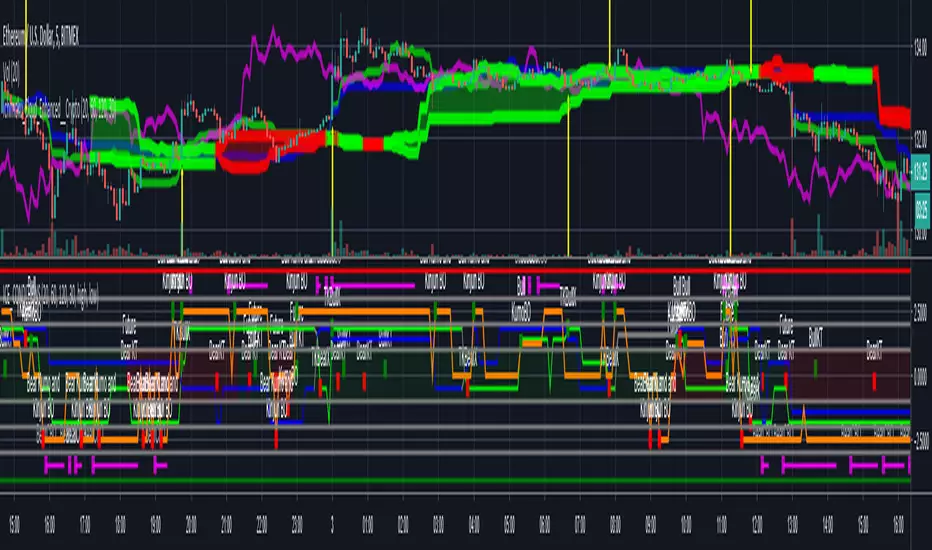
Ichimoku Cloud Enhanced - Conditions IndicatorOriginal Cloud code base from "Ichimoku Cloud Enhanced For Crypto"
Link here
At a glance simplified rendering of ichimoku cloud elements and algorithmic detection of all ichimoku cloud events. Has alert conditions for all/most events you would want.
Central red/green band represents the cloud and the current "future" cloud colour.
Kumo Twists are shown for when they are both below/above the current candle and for when they first appear in the "future" cloud.
Orange line represents close and it's relative position to the cloud and Kinjun.
Tenkan and Kinjun, crosses and relative position to the cloud (blue/green lines). Will show crosses if they occurred above/in/below the cloud etc.
Chikouspan Breakouts (above/below cloud & price action) fuchsia lines.
It should have all the logic required to build a strategy from IC conditions by combining them however you want.
-------------------------------------------------------
If you find it useful please consider a tip/donation to the rumpy liquidation recovery fund : BTC - 3BMEXEDyWJ58eXUEALYPadbn1wwWKmf6sA
Indicador Pine Script®
Daily, Monthly & Weekly Clouds (use on day chart)This indicator offers Ichimoku clouds for periods 1, 7, and 30. When used on the DAILY chart these correspond to the D, W & M time frames respectively.
The indicator just has the clouds right now because that's all I use. It doesn't have tenken, kijun or anything right now.
Indicador Pine Script®

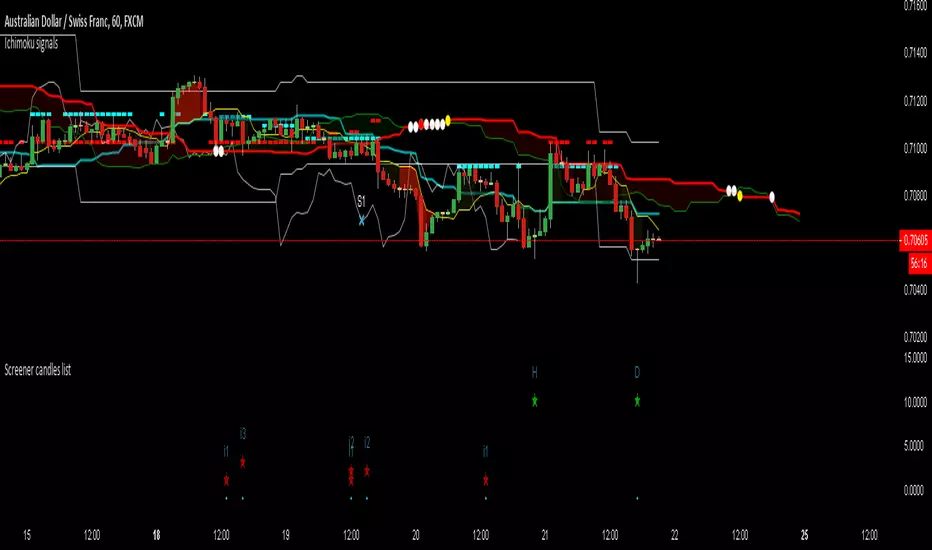
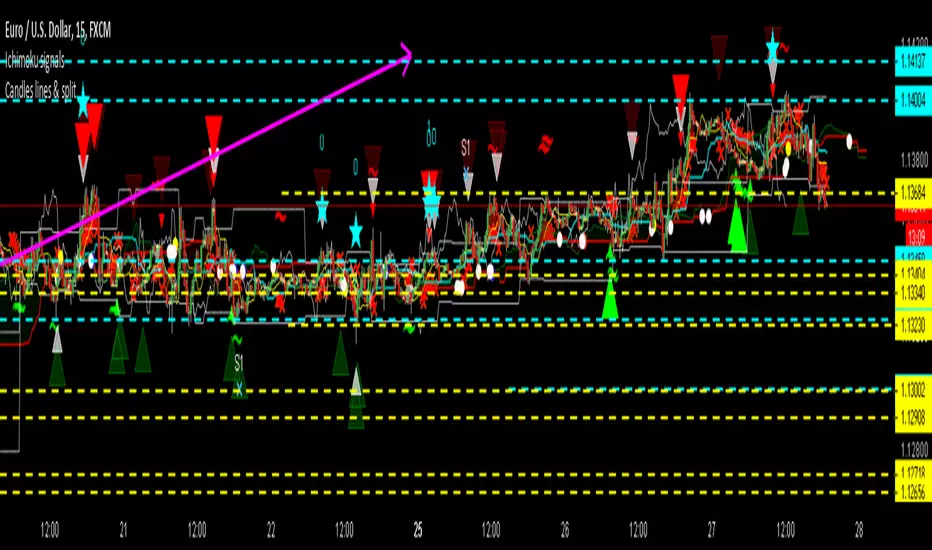
Candles lines & splitTrigger alerts when candle pattern are detected.
More conditions are shown : if previous ichimoku levels are touched, if divergence is being raised.
Indicador Pine Script®
MBY_Trade1HBITFINEX:ETHUSD
Hi.
This is MBY_LAB.
This indicator is a paid indicator.
The color of the moving average reflects MACD.
The signal line in the middle of the screen is the Ichimoku baseline.
And you can also trade through the Bollinger Band at the same time, and you can turn it off when you need it.
You can see the Fibonacci resistance line and supporting line at a glance.
We have set the background color to distinguish between bearish and burlish.
Please use strategy test in 1 hour time frame.
Please give me a message.
Estratégia Pine Script®

Complete Ichimoku Trader *modified*I just found this script from @kingthies here and like it. So i just made some changes and added some little code into it.
Reduced some noise for the signals. Hope anyone can enjoy it. But keep in mind, did not test it on live trading! Had just some time and love to work in pine :)
Original
Happy Trading
Indicador Pine Script®

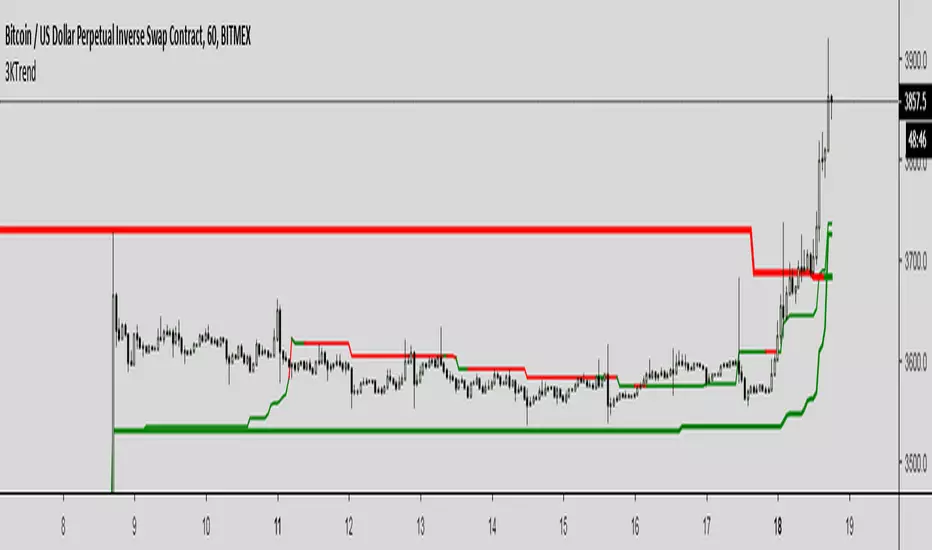
Triple Kijun Trend by SpiralmanIspired from "Oscars Simple Trend Ichimoku Kijun-sen" by CapnOscar
Script displays 3 kijun lines: one for current TF, second one emulates it for TF 4 times higher, third one for x16.
For example on 1H chart there will be 3 kijuns: one for 1H, second one for 4H (emulated), third one for 16H (emulated).
Kijuns change colors based on their position relative to price.
Kijun Sen
The base line, the slower EMA derivative, and a dynamic representation of the mean. With that said, the Kijun serves as both critical support and resistance levels for price. How does it work, and why would the Kijun be superior to commonly used moving average indicators? Fun fact: The Kijun dynamically equalizes itself to be the 50% retracement (or 0.5 Fibonacci level) of price for any given swing, and price will ALWAYS gravitate to the Kijun at some point regardless of how far above or below it is from it. By taking the median of price extremes, the Kijun accounts for volatility that other MAs or EMAs do not. A flat horizontal Kijun means that price extremes have not changed, and that the current trend losing momentum. Crypto-adjusted calculation: (highest high + lowest low) / 2 calculated over the last 60 periods.
Indicador Pine Script®
OBV-Ichimoku [by: Bijan Ajdary]This indicator adds Tenkansen and 3 types of Kijunsen and ChikouSpan and Kumo to the OBV chart.
Just like the Ichimoku indicator, only with the difference that, OBV was used instead of the price,
And making it highly efficient for professional traders and Analyzers.
Email: bj.ajdary@gmail.com
Telegram Id: @The_Last_Savior
Indicador Pine Script®

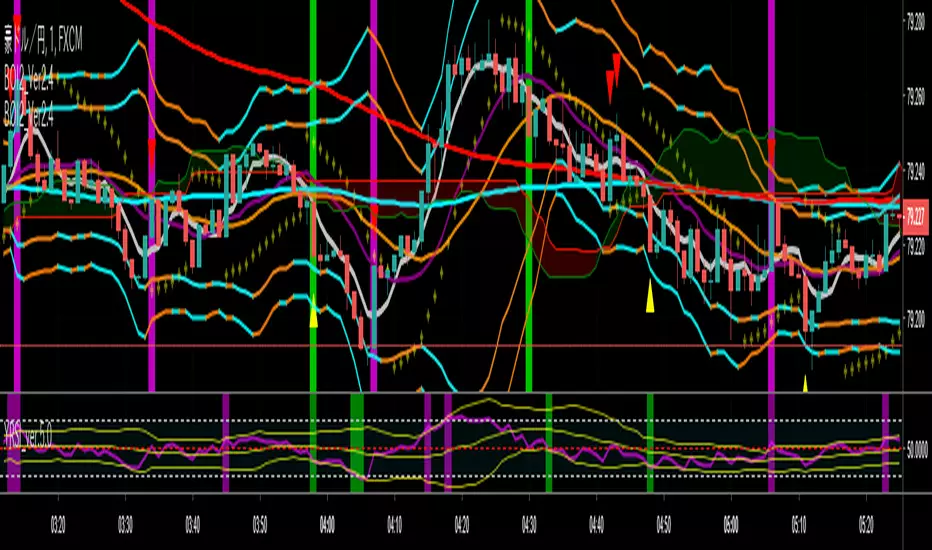
yutas_BOindicator2Ver .1.0
High-low sign indicator for binary option only.
バイナリーオプション専用ハイローサインインジケーター。
Indicador Pine Script®
[OZ]MTF Ichimoku CloudBased on this script from RicardoSantos:
This script can display Ichimoku cloud , SSA , SSB , Chikou, Kijun and Tenkan from another time frame.
With it you can apply Karen Péloille's MTF Ichimoku Kinko Hyo advanced trading techniques on TradingView.
By default Tenkan is not displayed (fully transparent).
The original script has been enhanced to draw the full cloud beyond the price and to draw the Chikou.
Indicador Pine Script®

Ichimoku trendfollowingIchimoku più che un indicatore potrebbe essere considerato un sistema di trading.
Ho quindi voluto implementare una strategia che utilizzasse soltanto i segnali che offre per l'ingresso ed uscita per verificarne l'efficacia nel lungo periodo su i diversi strumenti.
I segnali che offre sono i seguenti:
1) il prezzo taglia la tenkan (segnale molto debole per un ingresso)
2) il prezzo taglia la kijun (possibile trade in controtrend fino alla kumo)
3) tenkan incrocia la linea kijun
4) uscita della linea chikou span dal prezzo: se la linea è sotto il prezzo valutare solo short, se sopra valutare solo long, se sopra il prezzo si è in correzione ed è meglio restare flat
5) prezzo entra dentro la kumo. (Non si entra in posizione dentro la kuno)
6) la kumo cambia colore (conferma direzione del trend in atto)
7) uscita dal prezzo dalla kumo
8) uscita della tenkan dalla kumo (conferma situazione)
9) uscita kijun dalla kumo (conferma situazione)
10) trend in corso con chiusura del prezzo fra la chikou span da una parte, tenkan, kijun e kumo dall'altra.
Ichimoku è solitamente utilizzato come sistema trendfollowing, quindi considererò solo i segenti possibili ingressi:
1) breakout kumo (inizio trend di lungo periodo)
2) pullback (inizio trend di medio periodo o ripresa trend dopo correzione profonda con pullback su kumo)
le uscite tradizionali sono:
1) prezzo chiude sotto la kijun
2) SL inizialmente su minimo candela che rompe il livello
Filtri da applicare ai singoli ingressi:
Filtro long:
Close>kumo and chikou span > prezzo corrispondente and
Filtro short
Close
Estratégia Pine Script®

ZenTrading MTFA Trend TerritoryBetaversion
This is a multiple timeframe analysis script using ichimoku that checks where price (close) is on different timeframes.
Green : Price is in bullish territory
Orange : Price is in consolidation
Red: Price is in bearish territory.
The script looks at 15 min, 1 Hr, 4 HR, D, W, M timeframes. Not all will be relevant (depending on trading timeframe and on asset).
Possible to toggle timeframes on and off (15 min and M timeframes may not be relevant for the asset or timeframe you trade on, switch them off for a cleaner chart)
Indicador Pine Script®

Estratégia Pine Script®

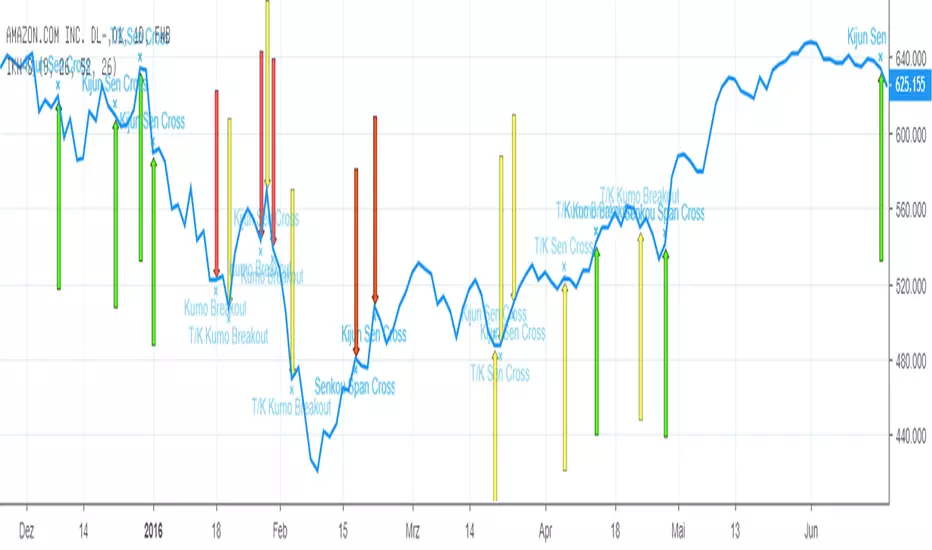
Ichimoku Kincho Hyo - Buy/Sell SignalsThe following (neutral/strong) signals are implemented:
Tenkan Sen/ Kijun Sen Komu Breakout
Tenkan Sen/ Kijun Sen Cross
Kijun Sen Cross
Kumo Breakout
Senkou Span Cross
Indicador Pine Script®
Indicador Pine Script®

Indicador Pine Script®

4 Ichimoku Clouds 2 BB by Theo ParkYou can use 4 Ichimoku Clouds and 2 Bollinger Bands with this indicator
Indicador Pine Script®

Indicador Pine Script®
