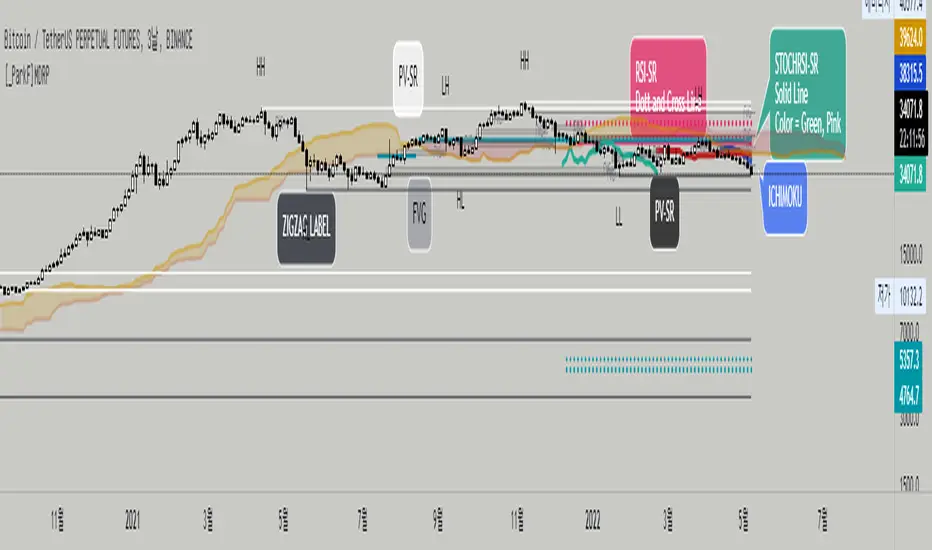
[_ParkF]MDRPThis indicator indicates that 'Momentum Discrepancy Reversal Point' = 'MDRP'.
Mixing and modifying several general indicators to find support and resistance
It is created to predict the change point of the trend by overlaying it on the chart.
The 4 support and resistance lines are drawn live, and the changed support and resistance lines are
It erases the line and overlays it again with a new line.
For each support and resistance, you can modify the color or line thickness, number of expressions, etc. in the input menu.
1. _____RSI-SR
Based on Wilder's RSI formula, overbought and oversold
Changes are detected and overlaid on the chart in the form of 2 resistances and 2 supports.
2. _____STOCHRSI-SR
Using the general stochastic and Wilder's RSI calculations,
Detect changes in overbought and oversold areas
It overlays the chart in the form of 1 resistance and 1 support.
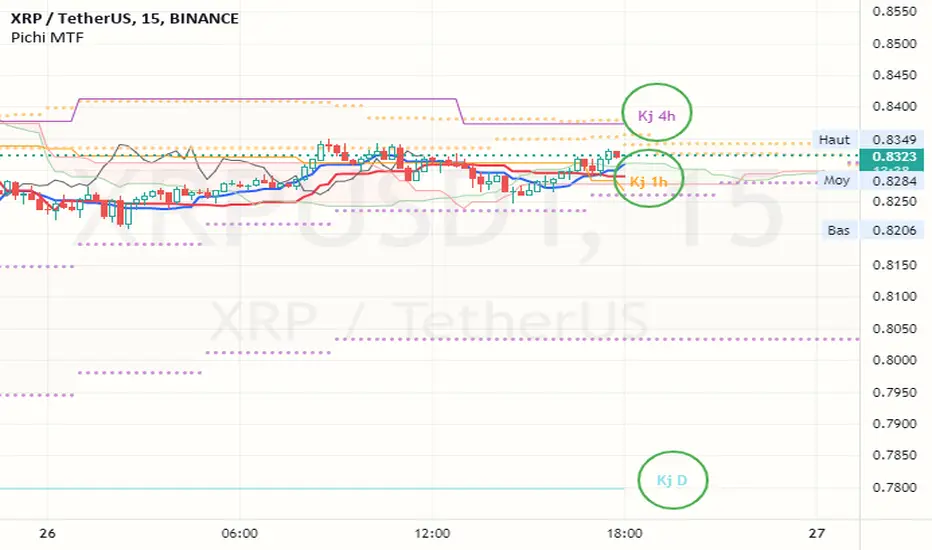
3. _____PV-SR
Pivot-based support and resistance will be overlaid on the chart,
By default, 10 pivot lines are drawn, but by modifying the count in the input menu,
You can modify the number of overlays.
4. _____FVG
'Fair value gaps' refers to gaps within consecutive candles.
This section is overlaid in the form of a box,
The default is to draw 10 FVG boxes, but set count in the input menu.
You can modify the number of overlays by editing.
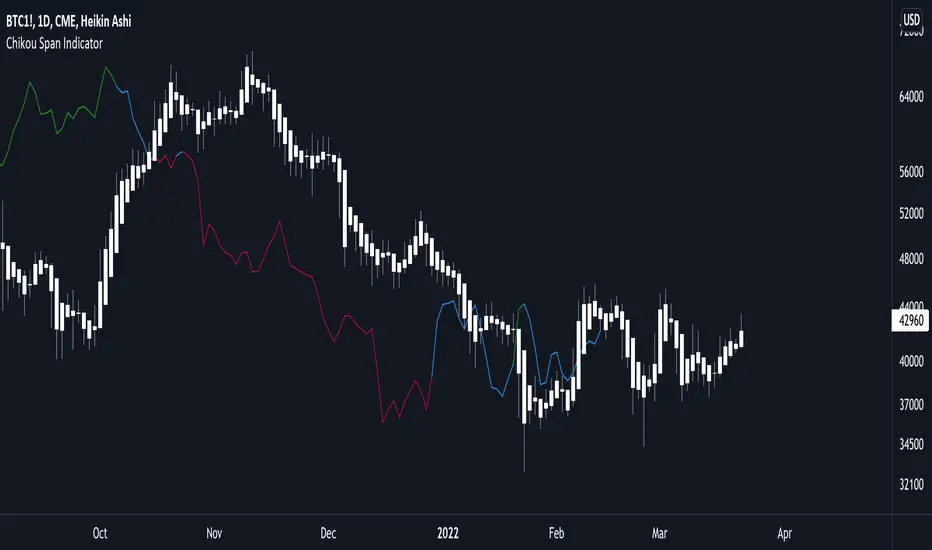
5. _____ZIGZAG
This is to find MDRP by overlaying the low and high prices of the current trend on the chart.
ZIGZAG labels near supports and resistances of 1, 2, 3 and 4 can increase the reliability of the MDRP.
The default value of live in the input menu is true, but if it is false, the closing price is checked and drawn.
Reduce false signals.
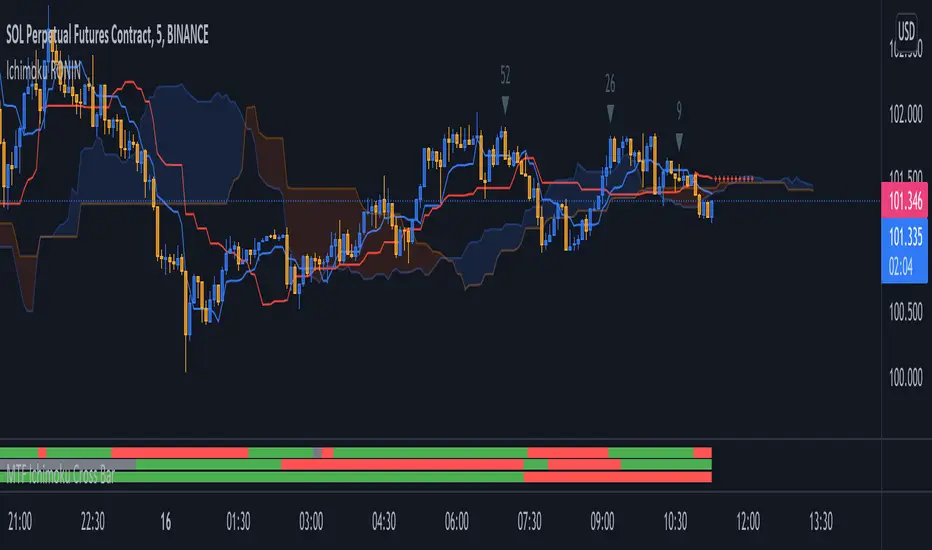
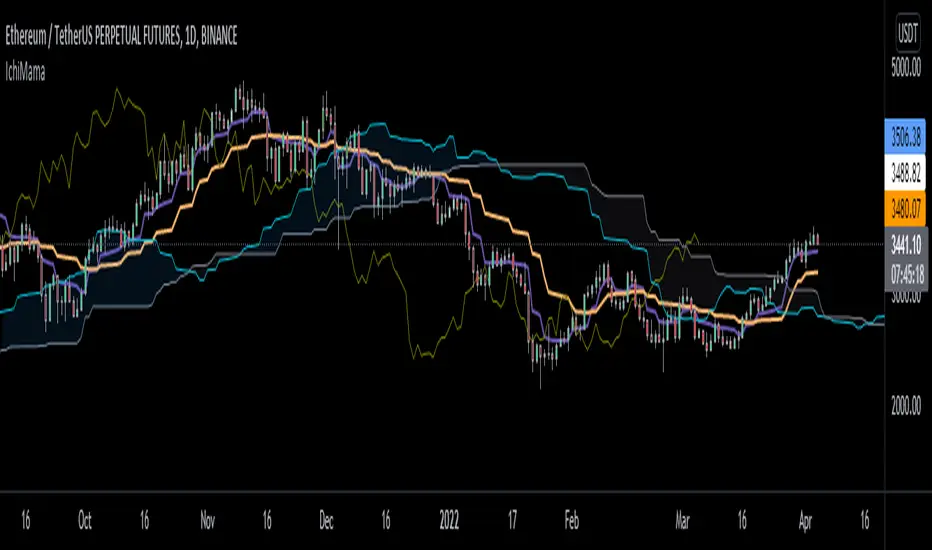
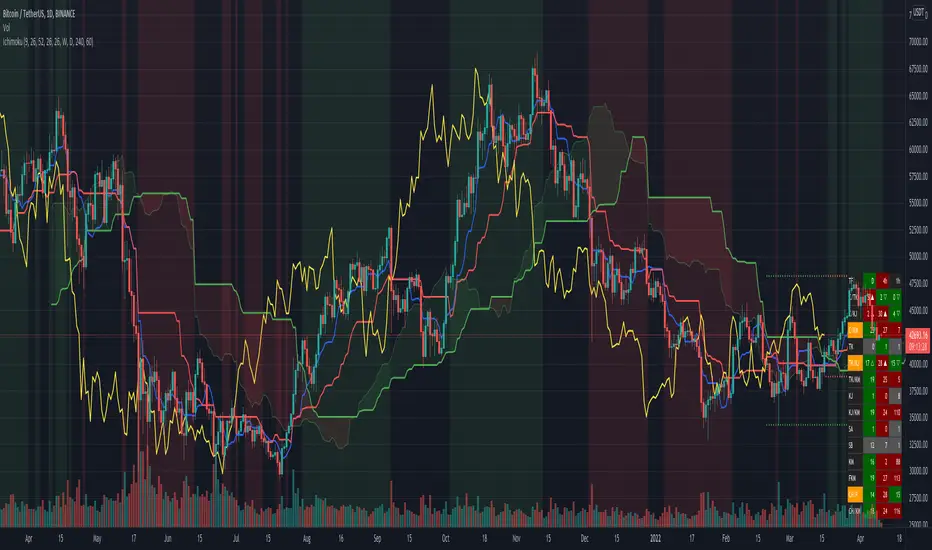
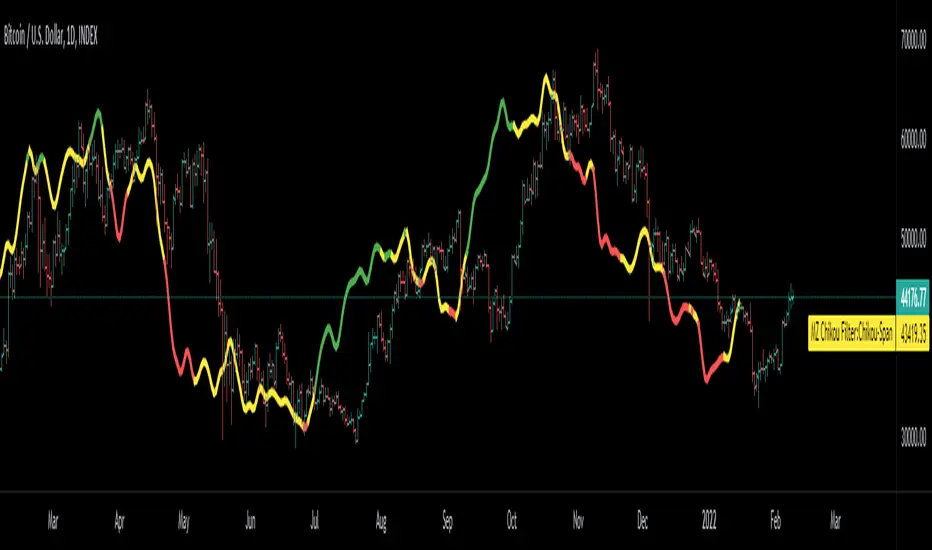
6. _____ICHIMOKU
The 5 lines of ICHIMOKU were overlaid with the default values of 9, 26, 52, 26,
Lines other than LeadLine A and B that are overlaid on the chart are overlaid on the chart only as much as the period value of each line.
* The _____FVG indicator cited the source of 'makuchaku'.
------------------------------------------------------------------------------------------------------------------------------------------------------------------------
이 지표는 'Momentum Discrepancy Reversal Point' = 'MDRP'를
찾기 위해 여러개의 일반적 지표들을 혼합, 수정하여 지지와 저항의 형태로
차트에 overlay 시켜 트렌드의 변화 지점을 예측 하기 위해 만들어졌습니다.
4개의 지지와 저항선은 실시간으로 그려지게 되며, 변화된 지지와 저항은 기존의
선을 지우고 새로운 선으로 다시 표시 됩니다.
각 지지와 저항은 input 메뉴에서 색 또는 선의 두께, 표현할 개수 등을 수정할 수 있습니다.
1. _____RSI-SR
Wilder's RSI 계산식을 기반으로 과매수, 과매도 영역에서의
변화를 감지하여 2개의 저항과 2개의 지지의 형태로 차트에 표시 됩니다.
2. _____STOCHRSI-SR
일반적 스토캐스틱과 Wilder's RSI의 계산식을 이용하여
과매수, 과매도 영역에서의 변화를 감지하여
1개의 저항과 1개의 지지의 형태로 차트에 표시됩니다.
3. _____PV-SR
Pivot을 기반으로 한 지지와 저항을 차트에 표시 하게 되며,
기본값은 10개의 Pivot선이 그려지게 되지만 input 메뉴에서 count를 수정하여
표시할 개수를 수정할 수 있습니다.
4. _____FVG
'Fair value gaps'는 연속된 캔들 안에서의 갭 구간을 말합니다.
이 구간을 박스의 형태로 표시한 것이며,
기본값은 10개의 FVG 박스가 그려지게 되지만 input 메뉴에서 count를
수정하여 표시할 개수를 수정할 수 있습니다.
5. _____ZIGZAG
현재 트렌드의 저가와 고가를 차트에 표시하여 MDRP를 찾기 위한 것으로
1, 2, 3, 4의 지지와 저항 부근에서의 ZIGZAG 라벨은 MDRP의 신뢰도를 높혀줄 수 있습니다.
input 메뉴에서의 live 기본값은 체크되어 있지만 체크를 해제하면 종가를 확인하고 그려지기에
거짓 신호를 줄일 수 있습니다.
6. _____ICHIMOKU
ICHIMOKU의 5개의 선은 기본값인 9, 26, 52, 26으로 표시하였으며,
차트에 표시되는 선행스팬 1과 2를 제외한 전환선, 기준선, 후행스팬은 각 선의 기간값만큼만 차트에 표시 되게 하였습니다.
Indicador Pine Script®