3 BAR ENGULFING SETUPScript that highlights bullish and bearish engulfing candles after two candles in the opposite direction.
Engulfingpattern

EngulfingThe script highlights a Bullish/Bearish Engulfing 2 candlesticks pattern on the main chart screen, and has a preset alert condition. Please use an oscillator that shows oversold and overbought conditions with this script (i.e. StochRSI oscillator).

Engulfing Candle IndicatorThis script shows you where a candle is either bullish or bearish engulfing the previous candle.
A GREEN triangle below the bar pointing UP indicates that the candle is BULLISH engulfing the previous candle
A RED triangle ABOVE the bar pointing DOWN indicates that the candle is BEARISH engulfing the previous candle

Bullish Engulfing Backtest This is a bullish reversal pattern formed by two candlesticks. Following a downtrend,
the first candlestick is a down candlestick which is followed by an up candlestick
which has a long real body that engulfs or contains the real body of the prior bar.
The Engulfing pattern is the reverse of the Harami pattern.
WARNING:
- For purpose educate only
- This script to change bars colors.

Bullish Engulfing Strategy This is a bullish reversal pattern formed by two candlesticks. Following a downtrend,
the first candlestick is a down candlestick which is followed by an up candlestick
which has a long real body that engulfs or contains the real body of the prior bar.
The Engulfing pattern is the reverse of the Harami pattern.
WARNING:
- This script to change bars colors.

Engulfing Candle by Atilla YurtsevenI have been backtesting many known strategies. I have created this Engulfing Candle indicator which makes it easy to detect engulfing candles. I have also added a short/long signals.
Description:
Engulfing candle: If a candle's high is higher than the previous candle's high and low is lower than previous candle's low, it is called Engulfing Candle. If the Engulfing candle's color is red, it is bearish, if green it is bullish.
Strategy: There are many strategies out there. The most known is creating pending orders after a few pips away from the direction of the engulfing candle. Assuming we have a bullish engulfing candle. At the beginning of the next candle, we simply create a buy-stop order (pending order) over 5 pips of the previous candle's (engulfing candle) high. Let's say bullish engulfing candle's high was 1.16051. In this case, we create a buy-stop at 1.16101. Also please take spread into account! If our order is not filled in the same candle, simply cancel the pending order.
This indicator does not repaint. Once signal occurs, it will not be removed. However, engulfing candle's type (bearish or bullish) can only be confirmed by the end of the bar!
I actually don't use Engulfing candle's in my trading. I am sharing this indicator in case you may need it.
Disclaimer: Past performance is not an indication of future performance. All the information in this article, including the algorithm & indicator, was provided and published for informational purposes only and should not be considered legal or financial advice. Use at your own risk!
Happy trading :)
Atilla Yurtseven

RSI Swing SignalThis indicator is a tool designed to be used with Steven Hart's RSI Exhaustion strategy. For more information google TheTradingChannel or look him up on YouTube :)
The default RSI settings for this strategy are:
RSI Overbought: 80
RSI Oversold: 20
Length: 7
When the RSI gets above 80, the line will turn red and the script will begin looking for a specific type of engulfing candle to go short. The same is true when the RSI gets below 20, but the line will turn green and look for longs. It is best used as a back-testing aid, but it can also be used to send emails or SMS alerts whenever the conditions are met. It can also be used as an alternative colored RSI indicator by removing the signals in the settings menu and changing the RSI parameters to whatever you normally use. This can aid in RSI divergence and overbought/sold strategies.
Entries:
The bright green and bright red lines represent the first type of engulfing candle.
The dark green and red lines represent the second type of engulfing candle.
Some pairs perform best with only one of these entries, while others work fine with both.
This is a counter-trend or consolidation strategy, and is best used in combination with trend-continuation or trend-following strategies. As always, make sure you back-test it before you use it to trade as it works better on some pairs than others.

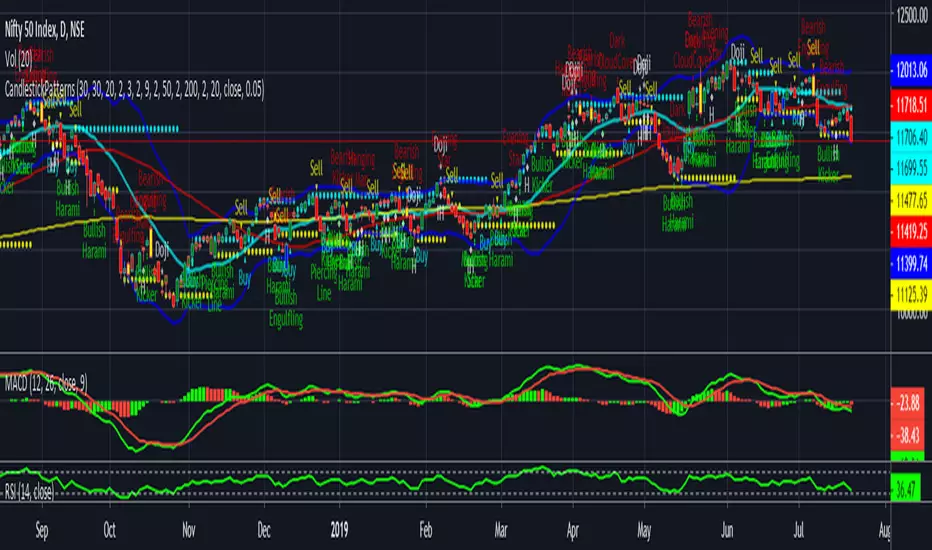
CandlestickPatternsIf moving average SMA (green line) crosses above SMA (red line) is uptrend , stock price will move up gradually. If suppose moving average SMA (green line) crosses below SMA (red line) is downtrend, stock price will move down. Also please validate with MACD & RSI for reference will get more clarification.
The default script have:
1) Bollinger Bands
2) Moving Average
3) Buy & Sell Signals
4) Engulfing patterns (like Doji , Bearish Harami, Bullish Harami, Bearish Engulfing , Bullish Engulfing , Piercing Line, Bullish Belt, Bullish Kicker, and Bearish Kicker)
The Piercing Line, Bullish Belt, and the Kickers will usually show up better in the daily charts.
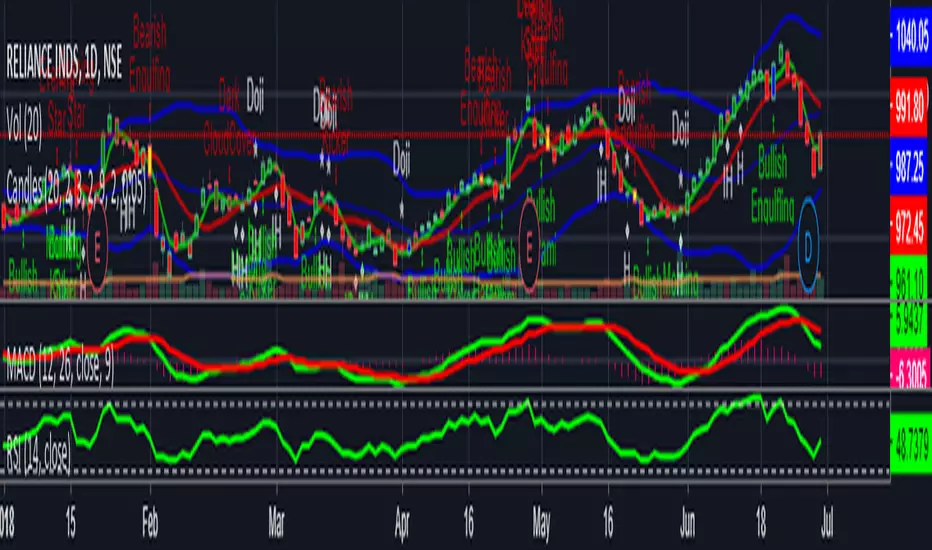
CandlesThe default script has: Bolinger Bands, Moving Average and Doji , Bearish Harami, Bullish Harami, Bearish Engulfing , Bullish Engulfing , Piercing Line, Bullish Belt, Bullish Kicker, and Bearish Kicker. The Piercing Line, Bullish Belt, and the Kickers will usually show up better in the daily charts.
Please note if moving average SMA (green line) crosses above SMA (red line) is uptrend , stock price will move up gradually. If suppose moving average SMA (green line) crosses below SMA(red line) is downtrend, stock price will move down. Also please validate with MACD & RSI for reference will get more clarity.
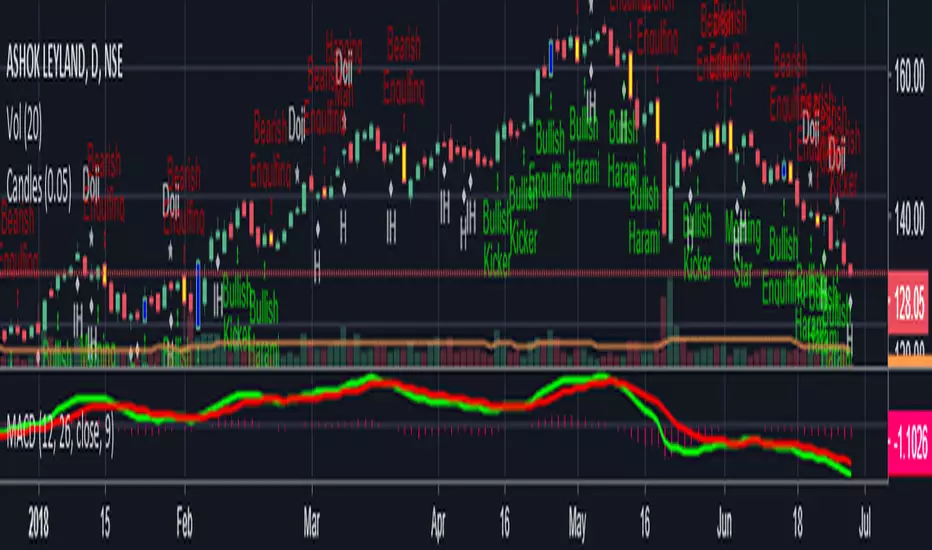
CandlesThe default script has: Doji , Bearish Harami, Bullish Harami, Bearish Engulfing , Bullish Engulfing , Piercing Line, Bullish Belt, Bullish Kicker, and Bearish Kicker. The Piercing Line, Bullish Belt, and the Kickers will usually show up better in the daily charts

candlestick pattern recognitionThe default script has: Doji , Bearish Harami, Bullish Harami, Bearish Engulfing , Bullish Engulfing , Piercing Line, Bullish Belt, Bullish Kicker, and Bearish Kicker. The Piercing Line, Bullish Belt, and the Kickers will usually show up better in the daily charts .

PA Patterns Multi CRYPTOThis is the version for cryptocurrencies of my scanner for forex majors
The scope of this script is to work as a scanner of pin bars and engulfing candles of the crypto market.
Best to use with time frames Daily and 4h, lower timeframes gives too many results and may be noisy without trend filter.
Next improvement will be:
- To display in a better way the results, but actually you have to zoom in and out if some results are overlapping.
As the other one, this has alerts and trend filter.
If you like it, please leave a comment and follow me.
Thank you.

PA Patterns Multi tickerThe scope of this script is to work as a forex scanner of pin bars and engulfing candles of the majors.
Best to use with time frames Daily and 4h, lower timeframes gives too many results and may be noisy.
Next improvement will be:
- To display in a better way the results, but actually you have to zoom in and out if some results are overlapping.
- To add allarms (this is easy).
If you are interested in it, I could implement also for cryptos.
Please let me have your feedbacks!
SD_Bull_Bear_Engulfing_Rsi_SdThis strategy combines the idea of a bullish or bearish candle engulfing coupled with standard deviation (a 100% increase or a 50% decrease). The exit condition is placed if the percentage increase is achieved or 35<rsi<65.
The strategy requires refinement so please test the script and let know what can be incorporated to improve the efficiency.

Bullish and Bearish Engulfing Patterns auto detectionThis simple indicator detects automatically most important bullish and bearish candlestick patterns formations. Used to locate potential supply and demand imbalances.
Copyright 2017 Alfonso Moreno www.set-and-forget.com
