engulfingpattern
Indicadores, Estratégias e Bibliotecas
Engulf Scan Introduction: The Engulf Scan indicator helps users identify bullish and bearish engulfing candlestick patterns on their charts. These patterns are often used as signals for trend reversals and are important indicators for traders. Engulf Scan signals are generated when an engulfing pattern is swallowed by another candlestick of the opposite...
🔵 Introduction The candlestick engulfing pattern is important pattern in technical analysis that can be observed in candlestick charts. This pattern occurs when a complete candle engulfs or "engulfs" the body of a previous candle, meaning that the body of the new candle completely covers the body of the previous candle. The candlestick engulfing pattern has two...
Will add some more patterns and conditions in it in future, for now its for detecting PERFECT Engulfings only. Use these Engulfing to take a trade when it get detected on support/resistance
This is an "Engulfing" indicator. The "Engulfing" candle pattern is a reversal pattern that can appear at the end of an uptrend or downtrend. The indicator includes the following inputs or settings: 1. `tolerance`: This defines the percentage difference in size that there must be between the body of the current candle and that of the previous candle to consider...
Japanese below / 日本語説明は英文の後にあります。 ------------------------- *This indicator is based on upslidedown's "Liquidity Engulfing Candles ". It's a very cool indicator. thank you. It has 2 functions: show the Liquidity Engulfing on HTF and candle color change when displacement occurs. === Function description === 1. Liquidity Engulfing on HTF This indicator gives...
This is an experimental candlestick pattern that combines pinbars and engulfing patterns as my own implementation. These signals can be used as a possible reversal points based on timeframe used or set wick size. Of course these signals should never be used on their own but rather can be used as another confluence of possible entry signal. Functional and Manual...
Liquidity engulfing candles (LEC) are a variant of a common candlestick pattern: engulfing candles but with a couple extra conditions applied. These conditions expect highs/lows to be taken out in order to show a continuation or reversal signal. Filter 1: Stop Hunt Wick Filter This filter requires the candle to wick into the prior candles high or low ( bullish =...
A simple script to filter out bullish and bearish engulfing candles. Size of candles can be filtered.
A simple indicator that marks FULL CANDLE engulfing candles... current high > previous high current low < previous low bullish: close > open (triangle below) bearish: close < open (triangle above) A lot of the engulfing indicators available are body only. I created a FULL CANDLE indicator because that's what I prefer using. Can be useful for...
Indicator showing volume impulse & engulfing candlestick pattern. You can set up multiple parameter for both events. Volume Impulse : Volume Period : Lenght of the average volume calculated. Volume Multiplier : Factor to compare actual volume with average volume. Engulfing Pattern : VS avg body : Let you chose to compare body candle to...
Probably the most complicated script you have seen... The Engulfing Candle Script that ACCTUALLY finds the engulfing candles. This indicator is a part of my new script I am creating and I will be realising soon. Hope it helps. I really don't understand why other people were making it so complicate LOL
DECP is simple and easy to use! It detects bullish and bearish engulfing candlestick patterns. After detecting the patterns I've said, it mentions that the pattern is going to continue its direction to up or down. But remember candlestick patterns don't determine targets and it's possible that predicted directions fail. So use it carefully and enjoy it!
Bearish and Bullish engulfing Candle Auto Detection
Indicator that highlights Hammer, Inverted Hammer, Engulfing, and Harami candlestick patterns. Great for those looking for a quick way to show the most popular reversal patterns on the charts. Options will allow you to select to show Hammers, Engulfing or Harami patterns only. You choose the combinations that you want. Great tool to learn and training your...
I am really excited to publish my work, I know its at the beginning but there is a lot to come in the future. I am writing a script to identify the candlestick patterns. In this version, I have added Hammer and Hanging Man Pattern in the first version, I know its less but its a beginning, I will keep adding the new information in my script in upcoming...
Hello traders This is a simple algorithm for a Tradingview strategy tracking a convergence of 2 unrelated indicators. Convergence is the solution to my trading problems. It's a puzzle with infinite possibilities and only a few working combinations. Here's one that I like - Engulfing pattern - Price vs Moving average for detecting a breakout Definition...
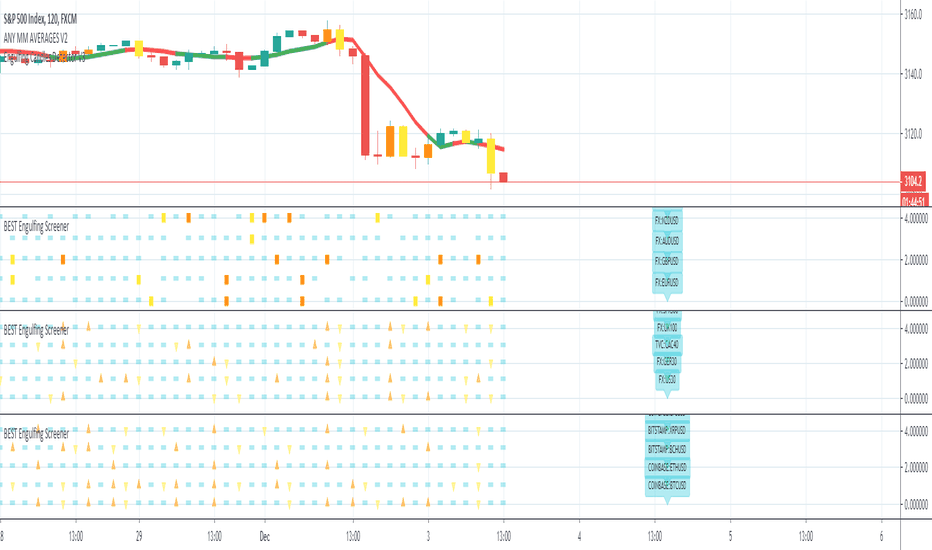
Hello traders Continuing deeper and stronger with the screeners serie. I keep getting requests private messages and requests saying that screeners aren't possible with TradingView. My answer is always... "Reallyyy ??" (I never find a better answer than that...) I'll publish a few screeners just for everyone to understand what can be done with Pinescript. We...
This script detects an event created by Oliver Velez is called Bull / Bear 180, in the following images the event is detailed: - The size of the control bar can be set compared to a number of previous bars - The minimum % of the control bar body can be set - You can filter by trend - Possibility of seeing fast and slow media with direction detection and...


![Engulfing [TradingFinder] Bullish & Bearish CandleStick Pattern XAUUSD: Engulfing [TradingFinder] Bullish & Bearish CandleStick Pattern](https://s3.tradingview.com/b/b9xIfkEj_mid.png)


![Liquidity Engulfing & Displacement [MsF] BTCUSDT.P: Liquidity Engulfing & Displacement [MsF]](https://s3.tradingview.com/r/rXN2YTsl_mid.png)

![Engulfing Pinbar [serkany88] BTCUSDTPERP: Engulfing Pinbar [serkany88]](https://s3.tradingview.com/e/EN4zmIA6_mid.png)

![Liquidity Engulfing Candles [upslidedown] BTCUSDT: Liquidity Engulfing Candles [upslidedown]](https://s3.tradingview.com/q/QpnPfNK6_mid.png)


![[LixxChartz] Engulfing Candle Auto Finder GC1!: [LixxChartz] Engulfing Candle Auto Finder](https://s3.tradingview.com/6/68zkA6CD_mid.png)


