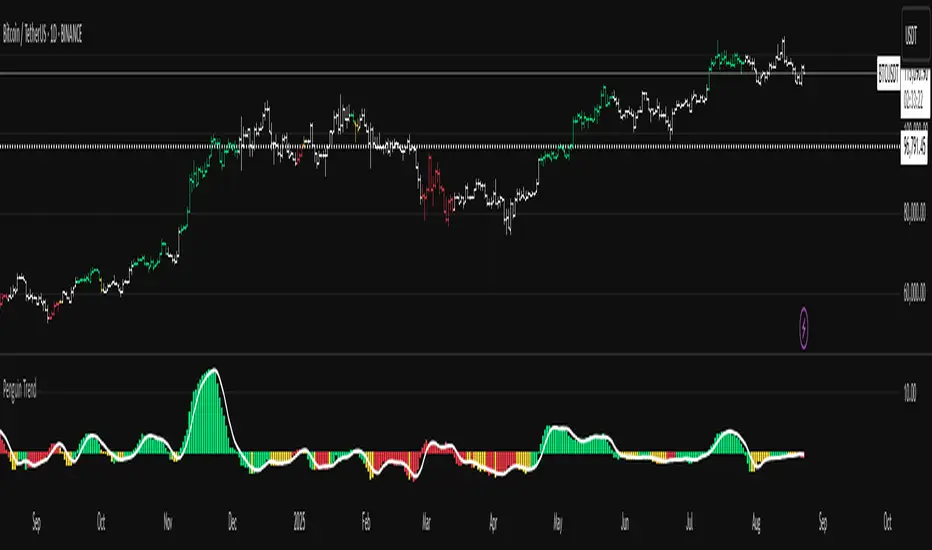
Penguin TrendMeasures the volatility regime by comparing the upper Bollinger Band to the upper Keltner Channel and colors bars with a lightweight trend state. Supports SMA/EMA/WMA/RMA/HMA/VWMA/VWAP and a selectable calculation timeframe. Default settings preserve the original look and behavior.
Penguin Trend visualizes expansion vs. compression in price action by comparing two classic volatility envelopes. It computes:
Diff% = (UpperBB − UpperKC) / UpperKC × 100
* Diff > 0: Bollinger Bands are wider than Keltner Channels -> expansion / momentum regime.
* Diff < 0: BB narrower than KC -> compression / squeeze regime.
A white “Average Difference” line smooths Diff% (default: SMA(5)) to help spot regime shifts.
Trend coloring (kept from original):
Bars are colored only when Diff > 0 to emphasize expansion phases. A lightweight trend engine defines four states using a fast/slow MA bias and a short “thrust” MA applied to ohlc4:
* Green: Bullish bias and thrust > fast MA (healthy upside thrust).
* Red: Bearish bias and thrust < fast MA (healthy downside thrust).
* Yellow: Bullish bias but thrust ≤ fast MA (pullback/weakness).
* Blue: Bearish bias but thrust ≥ fast MA (bear rally/short squeeze).
Note: By default, Blue renders as Yellow to preserve the original visual style. Enable “Use true BLUE color” if you prefer Aqua for Blue.
How it works (under the hood):
* Bollinger Bands (BB): Basis = selected MA of src (default SMA(20)). Width = StdDev × Mult (default 2.0).
* Keltner Channels (KC): Basis = selected MA of src (default SMA(20)). Width = ATR(kcATR) × Mult (defaults 20 and 2.0).
* Diff%: Safe division guards against division-by-zero.
* MA engine: You can choose SMA / EMA / WMA / RMA / HMA / VWMA / VWAP for BB/KC bases, Diff smoothing, and the trend components (VWAP is session-anchored).
* Calculation timeframe: Set “Calculation timeframe” to compute all internals on a chosen TF via request.security() while viewing any chart TF.
Inputs (key ones):
* Calculation timeframe: Empty = use chart TF; if set (e.g., 60), all internals compute on that TF.
* BB: Length, StdDev Mult, MA Type.
* KC: Basis Length, ATR Length, Multiplier, MA Type.
* Smoothing: Average Length & MA Type for the “Average Difference” line.
* Trend Engine: Fast/Slow lengths & MA type; Signal (kept for completeness); Thrust length & MA type (defaults replicate original behavior).
* Display: Paint bars only when Diff > 0; optional Zero line; optional true Blue color.
How to use:
1. Regime changes: Watch Diff% or Average Diff crossing 0. Above zero favors momentum/continuation setups; below zero suggests compression and potential breakout conditions.
2. State confirmation: Use bar colors to qualify expansion: Green/Red indicate expansion aligned with trend thrust; Yellow/Blue flag weaker/contrarian thrust during expansion.
3. Multi-timeframe analysis: Run calculations on a higher TF (e.g., H1/H4) while trading a lower TF chart to smooth noise.
Alerts:
* Diff crosses above/below 0.
* Average Diff crosses above/below 0.
* State changes: GREEN / RED / YELLOW / BLUE.
Notes & limitations:
* VWAP is session-anchored and best on intraday data. If not applicable on the selected calculation TF, the script automatically falls back to EMA.
* Default parameters (SMA(20) for BB/KC, multipliers 2.0, SMA(5) smoothing, trend logic and bar painting) preserve the original appearance.
Release notes:
v6.0 — Rewritten in Pine v6 with structured inputs and guards. Multi-MA support (SMA/EMA/WMA/RMA/HMA/VWMA/VWAP). Calculation timeframe via request.security() for multi-TF workflows. Safe division; optional zero line; optional true Blue color. Original visuals and behavior preserved by default.
License / disclaimer:
© waranyu.trkm — MIT License. Educational use only; not financial advice.
Osciladores Centrados
SMA+MACD+RSI+Stoch Entry📌 Tools Used:
• SMA 21, SMA 50, SMA 200
• MACD (12, 26, 9)
• Pivot Point Standard
• RSI (length 75)
• Stochastic (14, 3, 3)
Trading Timeframe:
• Usable on all timeframes
Chart Preparation:
• Analyze the overall market trend and the instrument being traded
• Set an appropriate timeframe according to the market
• Apply SMA 21, SMA 50, SMA 200
• Apply MACD and Pivot Point Standard
• Ensure a proper market trend by checking the position of SMA 21, SMA 50, and SMA 200 relative to each other
If there are too many crossings between SMA 21, SMA 50, and SMA 200, do not enter any trades until the market trend stabilizes
Conditions for Entering a Long Trade (Bullish Trigger):
• Candle closes above the pivot line
• Confirm an uptrend by checking that SMA 21 is above SMA 50, and SMA 50 is above SMA 200
• RSI is above the midpoint
• Presence of a suitable corrective step with normal slope, considering the strength of the previous step
• MACD histogram indicates bullish momentum
• Stochastic shows a bullish crossover from below
Conditions for Entering a Short Trade (Bearish Trigger):
• Candle closes below the pivot line
• Confirm a downtrend by checking that SMA 21 is below SMA 50, and SMA 50 is below SMA 200
• RSI is below the midpoint
• Presence of a suitable corrective step with normal slope, considering the strength of the previous step
• MACD histogram indicates bearish momentum
• Stochastic shows a bearish crossover from above

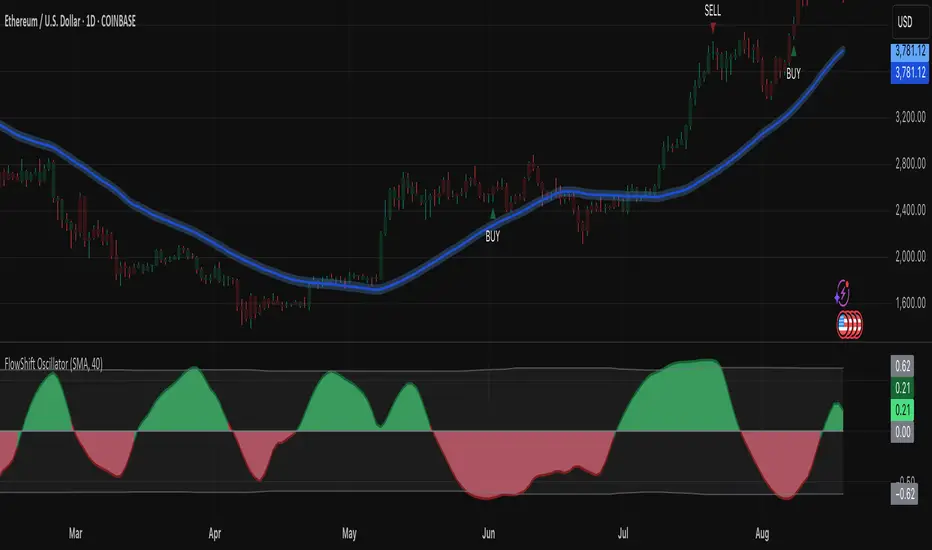
FlowShift OscillatorFlowShift Oscillator
Overview
The FlowShift Oscillator is a sophisticated momentum indicator designed to capture short-term shifts in market strength, identify trend acceleration, and highlight potential reversals. Combining baseline trend analysis with normalized momentum displacement and volatility-adjusted thresholds, FlowShift provides traders with a responsive, adaptive, and visually intuitive tool suitable for multiple timeframes and asset classes. Whether used for intraday scalping or longer-term trend following, FlowShift helps traders make informed decisions with precision and confidence.
Features
Customizable Baseline Moving Average : Select from SMA, EMA, SMMA (RMA), WMA, or VWMA to define the underlying trend. Adjustable length allows for tuning to specific market conditions.
Normalized Momentum Calculation : Measures price displacement relative to the baseline MA, removing minor fluctuations while preserving meaningful momentum shifts.
Volatility-Adjusted Thresholds : Dynamic upper and lower bounds adapt to market volatility, helping identify overextended bullish or bearish conditions.
Optional Signal Markers : Buy/Sell triangles indicate potential turning points when momentum reaches critical levels, aiding trade timing and decision-making.
Visual Enhancements : Customizable area fills, line colors, and optional candle tinting allow traders to quickly interpret momentum, bias, and trend direction.
Flexible Timeframe Compatibility : Effective across all timeframes, from 1-minute intraday charts to daily and weekly analysis.
How It Works
FlowShift calculates the displacement of price from a baseline moving average to identify deviations from the prevailing trend. This displacement is normalized and smoothed using exponential moving averages, producing a clean oscillator line that highlights genuine momentum changes. The oscillator’s dynamic thresholds are determined by a percentile of recent absolute values, providing an adaptive reference for extreme conditions in both bullish and bearish markets.
Signals
Buy Signal : Triggered when the oscillator crosses above prior lows in an oversold region, suggesting potential upward momentum.
Sell Signal : Triggered when the oscillator crosses below prior highs in an overbought region, indicating potential downward momentum.
Signals are optional and can be displayed as triangles on the chart to clearly mark potential entry and exit points.
Visual Interpretation
FlowShift Line & Area : The oscillator line and area highlight momentum direction and intensity. Upward momentum is shown in green tones, downward momentum in red.
Baseline MA & Glow : Displays the selected baseline moving average with optional glow for trend reference.
Candle Tinting : Optionally tints bars based on the baseline MA bias, providing an at-a-glance view of market sentiment.
Usage Notes
FlowShift is best used in conjunction with other trend confirmation tools or support/resistance analysis.
Dynamic thresholds help identify potential reversal points, but traders should consider overall market context and not rely solely on signals.
Customize the baseline MA type and length to fit your trading style; shorter lengths increase sensitivity, while longer lengths provide smoother trend representation.
Use the optional signal markers as guidance for trade timing, combining with risk management strategies for optimal results.
Conclusion
FlowShift Oscillator delivers a powerful, adaptive, and visually intuitive approach to momentum analysis. By combining baseline trend assessment, normalized momentum, and dynamic volatility scaling, it enables traders to anticipate market shifts, spot trend accelerations, and make timely trading decisions across a wide range of markets and timeframes.
Capiba Custom RSI with Divergences v2
🇬🇧 English
Summary
This indicator is an enhanced and customizable version of the classic RSI, designed to provide clearer and more powerful trading signals. It combines an alternative, more price-sensitive RSI calculation with an automatic divergence detection, which is one of the most effective tools for predicting trend reversals and finding high-probability entry and exit points.
Built upon the compilation of knowledge and open-source codes from the community, this script has been refined to be an all-in-one tool for traders who base their strategies on momentum and trend exhaustion.
Key Features and How to Use
Ultimate RSI and Signal Line (Momentum)
What it is: The main indicator (white line) is an RSI variation that reacts more dynamically to changes in price volatility. It is accompanied by a signal line (orange, by default), which is a moving average of the RSI itself, serving to smooth the indicator and generate crossover signals.
How to use for Entries/Exits:
Buy Signal (Short-Term): Crossover of the RSI line (white) above the signal line (orange).
Sell Signal (Short-Term): Crossover of the RSI line (white) below the signal line (orange). These are momentum signals, ideal for confirming a trend or for scalping.
Automatic Divergence Detection (Reversal Signals) This is the most powerful feature of the indicator. A divergence occurs when the price moves in one direction and the momentum indicator moves in the opposite direction, signaling a likely exhaustion of the current trend.
Bullish Divergence (Green Line):
What it is: The price makes a lower low, but the RSI makes a higher low.
Meaning: Selling pressure is decreasing. It is a strong signal of a potential market bottom and an excellent entry opportunity for a long position.
Bearish Divergence (Red Line):
What it is: The price makes a higher high, but the RSI makes a lower high.
Meaning: Buying pressure is losing strength. It is a strong signal of a potential market top and an excellent exit opportunity for a long position or an entry for a short position.
Customizable Overbought & Oversold Levels
The horizontal lines (default 80 and 20) and the colored areas show when the asset is overextended to the upside (overbought) or downside (oversold), helping to contextualize the divergence and crossover signals.
Recommended Strategy
For maximum effectiveness, combine the signals:
High-Probability Entry (Buy): Look for a Bullish Divergence (green line) forming in the oversold zone. Confirm the entry when the RSI line crosses above its signal line.
High-Probability Exit (Sell): Look for a Bearish Divergence (red line) forming in the overbought zone. Confirm the exit or new short entry when the RSI line crosses below its signal line.
Acknowledgements
This indicator was developed by compiling and customizing excellent open-source ideas and codes shared by the TradingView community. Special thanks to everyone who contributes to the advancement of technical analysis.

Capiba Ultimate Suite (RSI, MA Cloud & Volatility)
🇬🇧 English
Summary
This indicator, Capiba Ultimate Suite, is a powerful compilation of various open-source technical analysis tools, refined and integrated into a single, cohesive, and functional package. The goal is to provide a complete system with clear entry and exit signals, ideal for traders operating in trending and volatile markets.
The combination of a custom momentum oscillator (Ultimate RSI), a moving average cloud for trend definition, and a volatility oscillator for range analysis transforms this script into a true trading suite.
Disclaimer: This indicator is most effective in markets with a defined trend (bullish or bearish) and may generate less reliable signals during periods of strong consolidation.
Components and How to Use
Ultimate RSI with Crossover Signals (Entries and Exits)
What it is: A variation of the classic RSI, designed to be more reactive to price movements.
Entry Signals (Buy): A green arrow (▲) appears below the candle when the Ultimate RSI line crosses above its momentum line (EMA). This is a signal of a potential start of an upward move.
Exit Signals (Sell): A red arrow (▼) appears above the candle when the Ultimate RSI crosses below its momentum line. This is a signal of potential weakening or trend reversal.
Moving Average Cloud (Trend Filter)
What it is: A cloud formed by the space between a short-term moving average (default 55) and a long-term one (default 233).
How to use for signal validation:
Uptrend: When the cloud is green (Short MA > Long MA), buy signals (▲) are strengthened. Sell signals can be seen as partial profit-taking.
Downtrend: When the cloud is red (Short MA < Long MA), sell signals (▼) are strengthened. Buy signals should be treated with extreme caution as they are against the main trend.
Candle Coloring (Quick Momentum Reading)
Lime Green: Strong bullish momentum (RSI > 50 and above its EMA).
Red: Strong bearish momentum (RSI < 50 and below its EMA).
Blue: Overbought level reached.
Yellow: Oversold level reached.
Volatility Ruler (Breakout Analysis)
What it is: The green (high) and red (low) lines mark the range of the last 'N' candles. The Vol: X.XX label on the right measures the current volatility against its historical average.
How to use:
Vol < 1.00: Contracting volatility ("Squeeze"). The market is "coiling the spring." Watch for an impending breakout of the range lines.
Vol > 1.00: Expanding volatility. Confirms the strength of a breakout that has already occurred. Very high values may indicate exhaustion.
Use the ruler to identify false breakouts: a candle closing outside the line but with a very low Vol value is more likely to be a false signal.
Acknowledgements
This indicator is the result of compiling and adapting open-source concepts and codes available in the TradingView community. Thanks to all the developers who share their knowledge.
>>>>>>>>>>>>>>>>>>>>>>>>>>>>>>>>>>>>>>>>>>>>>>>>>>>>>>>>>>>>>>>>>>>>>>>>

RRG Relative Strength# RRG Relative Strength (RRG RS)
Compare any symbol to a benchmark using two RRG-style lines: **RS-Ratio** (trend of relative strength) and **RS-Momentum** (momentum of that trend). Both are centered at **100**:
- **RS-Ratio > 100** → outperforming the benchmark
- **RS-Ratio < 100** → underperforming
- **RS-Momentum** often **leads** RS-Ratio (crosses 100 earlier)
# How it works
1) Relative Strength (RS): RS = Close(symbol) / Close(benchmark)
2) Normalize around 100: smooth RS with EMA and divide RS by that EMA
3) RS-Ratio: EMA( RS / EMA(RS, Length), LenSmooth ) * 100
4) RS-Momentum: RS-Ratio / EMA(RS-Ratio, LenSmooth) * 100
# Inputs
- Length (default 14): normalization window for RS
- Length Smooth (default 20): smoothing window for RS-Ratio & RS-Momentum
# Benchmark (auto)
- US: SP:SPX (S&P 500)
- Vietnam: HOSE:VNINDEX
- Crypto: INDEX:BTCUSD
(Modify the mapping if needed, or replace with your own input.symbol().)
# How to read
- Improving: RS-Momentum crosses above 100 while RS-Ratio turns up
- Leading: RS-Ratio > 100 with RS-Momentum ≥ 100
- Weakening: RS-Momentum drops below 100; RS-Ratio often follows
# Timeframes & presets
- Works on Daily and Weekly charts
- Daily (fast): 14 / 20
- Approx. weekly behavior on Daily: 50 / 60
Note: Values usually hover near 100 (e.g., ~90–110) but are not strictly bounded. Ensure your symbol and benchmark trade in comparable sessions/currencies.

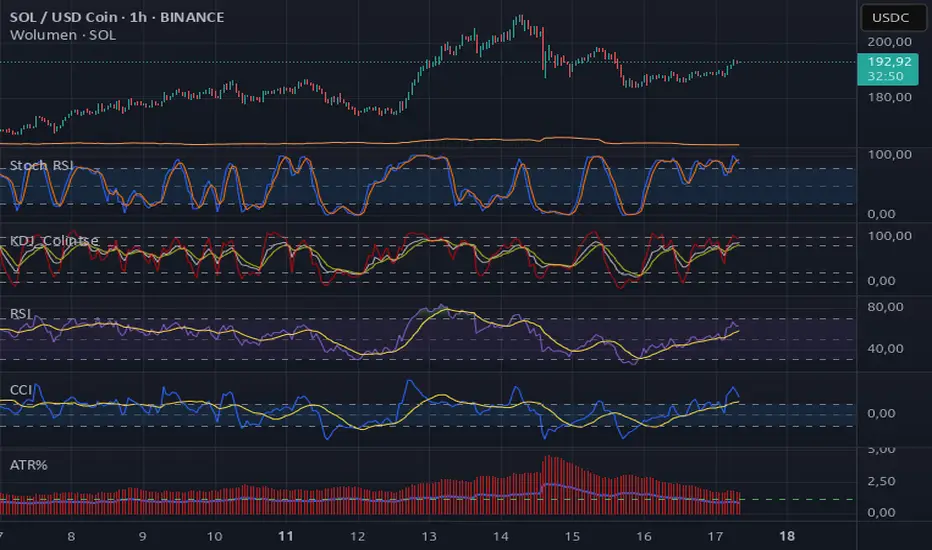
Average True Range %The ATR% oscillator measures market volatility as a percentage of the closing price, smooths it using a chosen method (RMA, SMA, EMA, or WMA), and compares it to the threshold levels of 0.95% and 1.20%.
QFisher-R™ [ParadoxAlgo]QFISHER-R™ (Regime-Aware Fisher Transform)
A research/education tool that helps visualize potential momentum exhaustion and probable inflection zones using a quantitative, non-repainting Fisher framework with regime filters and multi-timeframe (MTF) confirmation.
What it does
Converts normalized price movement into a stabilized Fisher domain to highlight potential turning points.
Uses adaptive smoothing, robust (MAD/quantile) thresholds, and optional MTF alignment to contextualize extremes.
Provides a Reversal Probability Score (0–100) to summarize signal confluence (extreme, slope, cross, divergence, regime, and MTF checks).
Key features
Non-repainting logic (bar-close confirmation; security() with no lookahead).
Dynamic exhaustion bands (data-driven thresholds vs fixed ±2).
Adaptive smoothing (efficiency-ratio based).
Optional divergence tags on structurally valid pivots.
MTF confirmation (same logic computed on a higher timeframe).
Compact visuals with subtle plotting to reduce chart clutter.
Inputs (high level)
Source (e.g., HLC3 / Close / HA).
Core lookback, fast/slow range blend, and ER length.
Band sensitivity (robust thresholding).
MTF timeframe(s) and agreement requirement.
Toggle divergence & intrabar previews (default off).
Signals & Alerts
Turn Candidate (Up/Down) when multiple conditions align.
Trade-Grade Turn when score ≥ threshold and MTF agrees.
Divergence Confirmed when structural criteria are met.
Alerts are generated on confirmed bar close by default. Optional “preview” mode is available for experimentation.
How to use
Start on your preferred timeframe; optionally enable an HTF (e.g., 4×) for confirmation.
Look for RPS clusters near the exhaustion bands, slope inflections, and (optionally) divergences.
Combine with your own risk management, liquidity, and trend context.
Paper test first and calibrate thresholds to your instrument and timeframe.
Notes & limitations
This is not a buy/sell signal generator and does not predict future returns.
Readings can remain extreme during strong trends; use HTF context and your own filters.
Parameters are intentionally conservative by default; adjust carefully.
Compliance / Disclaimer
Educational & research tool only. Not financial advice. No recommendation to buy/sell any security or derivative.
Past performance, backtests, or examples (if any) are not indicative of future results.
Trading involves risk; you are responsible for your own decisions and risk management.
Built upon the Fisher Transform concept (Ehlers); all modifications, smoothing, regime logic, scoring, and visualization are original work by Paradox Algo.

Intraday Spark Chart [AstrideUnicorn]The Intraday Spark Chart (ISC) is a minimalist yet powerful tool designed to track an asset’s performance relative to its daily opening price. Inspired by Nasdaq's trading-floor analog dashboards, it visualizes intraday percentage changes as a color-coded sparkline, helping traders quickly gauge momentum and session bias.
Ideal for: Day trading, scalping, and multi-asset monitoring.
Best paired with: 1m to 4H timeframes (auto-warns on higher TFs).
Key metrics:
Real-time % change from daily open.
Final daily % change (updated at session close).
Daily open price labels for orientation.
HOW TO USE
Visual Guide
Sparkline Plot:
A green area/line indicates price is above the daily open (bullish).
A red area/line signals price is below the daily open (bearish).
The baseline (0%) represents the daily open price.
Session Markers:
The dotted vertical lines separate trading days.
Gray labels near the baseline show the exact daily open price at the start of each session.
Dynamic Labels:
The labels in the upper left corner of each session range display the current (or final) daily % change. Color matches the trend (green/red) for instant readability.
Practical Use Cases
Opening Range Breakouts: Spot early momentum by observing how price reacts to the daily open.
Multi-Asset Screening: Compare intraday strength across symbols by choosing an asset in the indicator settings panel.
Session Close Prep: Anticipate daily settlement by tracking the final % change (useful for futures/swing traders).
SETTINGS
Asset (Input Symbol) : Defaults to the current chart symbol. Choose any asset to monitor its price action without switching charts - ideal for intermarket analysis or correlation tracking.

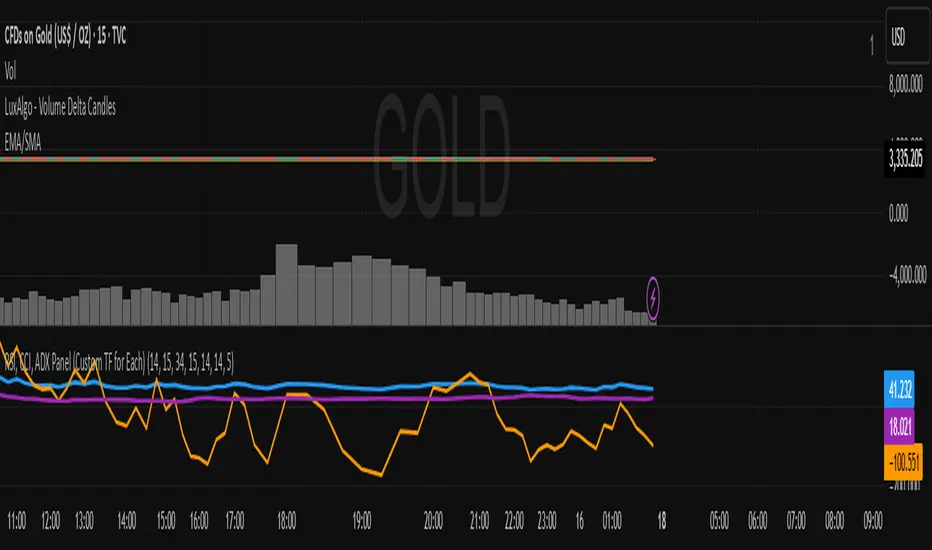
RSI, CCI, ADX Panel (Custom TF for Each)RSI, CCI, ADX Panel (Custom TF for Each)
This indicator combines RSI, CCI, and ADX into a single panel, allowing traders to view three key momentum/trend signals together. Each indicator can be calculated on its own custom timeframe, making it useful for multi-timeframe analysis.
Features:
RSI (Relative Strength Index): Measures momentum, useful for identifying overbought/oversold conditions.
CCI (Commodity Channel Index): Detects cyclical movements and potential reversals.
ADX (Average Directional Index): Evaluates trend strength without regard to direction.
Independent timeframe selection for RSI, CCI, and ADX.
Distinct colors for each indicator (RSI = Blue, CCI = Orange, ADX = Purple).
Single consolidated panel for compact analysis.
This tool is designed to give a multi-perspective view of market strength, momentum, and trend in one place.
[L2] Enhanced MACD Support-Kisslooking for support line, before pumping, script can find where possible points for enter

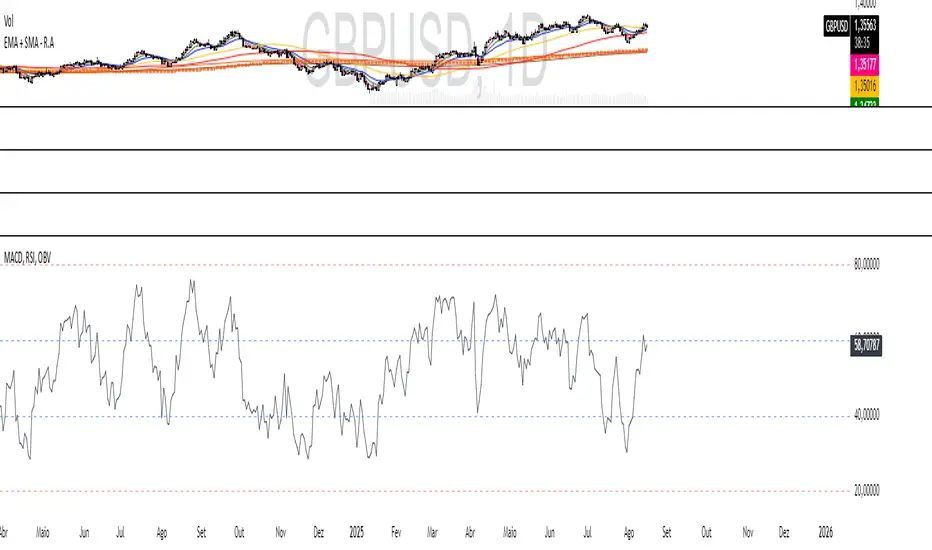
MACD, RSI, OBV - R.A TraderRudá Alves Trader - Custom Indicator
This indicator was developed for the students of Rudá Alves trader. It combines the OBV, RSI, and MACD oscillators into a single tool.
WA-%Chg with BackgroundDescription
The WA-%Chg with Background indicator measures the percentage change in a selected price source over a user-defined period. It allows traders to visually and quickly assess bullish and bearish momentum through dynamic color coding and background shading.
Percentage Change Calculation – Uses ta.roc to determine the rate of change over the chosen length.
Customizable Alerts – Set upper (HiAlert) and lower (LoAlert) thresholds to get notified when momentum crosses bullish or bearish trigger levels.
Dynamic Line Coloring – Blue when above the bullish threshold, red when below the bearish threshold, and gray when in neutral territory.
Background Highlighting – Light blue shading for bullish zones, light red shading for bearish zones.
User Customization – Modify calculation length, colors, and alert thresholds to suit your trading style.
This tool is useful for identifying breakout conditions, momentum shifts, and potential reversals at a glance. Traders can combine it with other indicators for confirmation.
Disclaimer
This indicator is provided for educational purposes only and should not be considered financial advice. Past performance of any indicator or strategy is not indicative of future results. Trading in financial markets involves significant risk, including the risk of losing capital. Always perform your own analysis and consult with a qualified financial advisor before making any investment decisions. The author assumes no liability for any losses incurred from the use of this tool.

U Table • LITEA compact, educational version of my workflow that combines trend, momentum, trend strength, and a clean trigger:
Trend: EMA Fast vs EMA Slow (auto-lengths by chart TF)
Momentum: RSI > 50 for longs / < 50 for shorts
Strength: ADX above a user-set threshold (fallback implementation; can be replaced by ta.adx() when available)
Trigger: price crosses the Bollinger basis (center line)
Signals
LONG: crossover(close, BB basis) while EMA Fast > EMA Slow, RSI > 50, ADX > threshold
SHORT: crossunder(close, BB basis) while EMA Fast < EMA Slow, RSI < 50, ADX > threshold
Visuals
EMA Fast / EMA Slow / BB basis
Markers “L” / “S” on triggers
Latest confirmed pivot high/low (broken line style)
Small diagnostics table (ADX, EMA relation, RSI, last pivots) on the last bar
Inputs
Pivot length: pivot confirmation window (default 5)
ADX threshold: minimum trend strength to allow signals (default 20)
Notes
Signals are intended to be evaluated on bar close. Intrabar values may change until the bar closes.
Pivot lines appear after confirmation; they do not repaint once confirmed.
No external data or security() calls are used.
This LITE build focuses on clarity and speed (few calculations, overlay-friendly). It can be used as a stand-alone study or as a scaffold for your own research and risk management.

Triple EMA with Alert | 21, 50, 200 EMA Strategy + Crossover🚀 Boost your trading edge with the Triple EMA with Alert — a professional-grade indicator designed for traders who want precise, real-time trend confirmation across short, medium, and long-term market movements.
🔹 What Makes This Indicator Powerful?
Three Adjustable EMAs — Default: 21, 50, 200 periods (fully customizable 1–200).
Toggle Visibility — Show only the EMAs you need for your strategy.
Real-Time Alerts — Get notified instantly when:
EMA 1 crosses EMA 2 → short-term trend change.
EMA 2 crosses EMA 3 → medium-term trend alignment.
Works on All Markets & Timeframes — Forex, crypto, stocks, indices, and commodities.
🔹 Why Traders Love It
📊 Multi-Timeframe Trend Confirmation — Filter out noise and trade with market momentum.
🎯 Accurate Crossover Signals — Identify bullish and bearish momentum shifts.
🔔 Hands-Free Monitoring — Alerts keep you informed even when you’re away from the chart.
💡 Versatile for Any Strategy — Perfect for scalping, swing trading, or long-term investing.
🔹 How to Use It
Bullish Signal — EMA 1 crossing above EMA 2 or EMA 2 crossing above EMA 3.
Bearish Signal — EMA 1 crossing below EMA 2 or EMA 2 crossing below EMA 3.
Combine with support/resistance zones, RSI, or volume for higher probability trades.
📌 Pro Tip:
Use EMA 21 & EMA 50 for momentum confirmation.
Use EMA 200 to spot the overall market direction.
If you’re serious about trend trading with precision, the Triple EMA with Alert will keep you one step ahead of market moves — no more missed entries or exits.

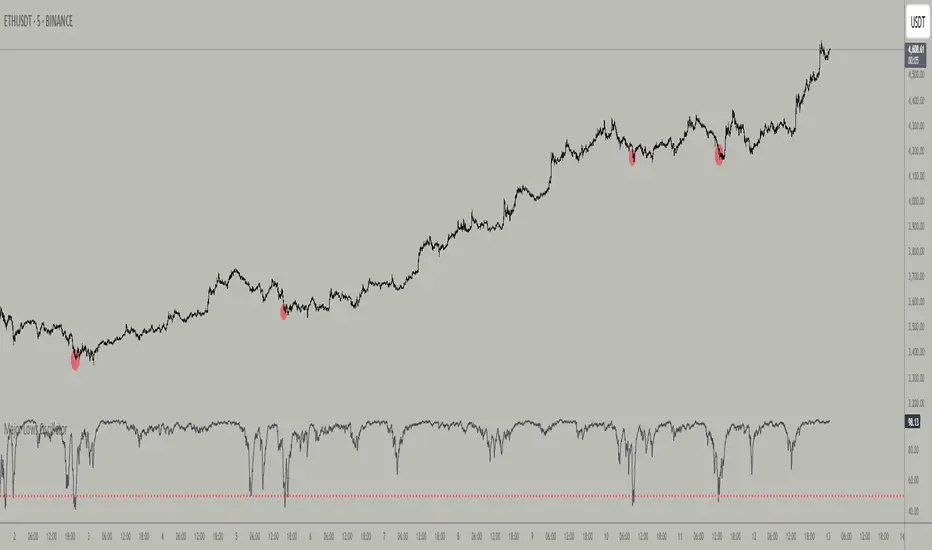
Major Lows OscillatorDescription
The Major Lows Oscillator is a custom technical indicator designed to identify significant low-price areas by normalizing the current closing price relative to recent lowest lows and highest highs. The oscillator calculates a normalized price percentage over a configurable lookback period, applies exponential moving averages for smoothing, and inverts the result to highlight potential market bottoms.
Calculation Details
Lowest Low Lookback : Finds the lowest low over a user-defined period (default 100 bars).
Highest High Lookback : Calculates the highest high over a short period (default 1 bar), providing a dynamic normalization range.
Normalization : Normalizes the current close within the range defined by the lowest low and highest high, scaled to 0-100.
Smoothing : Applies a 10-period EMA, inversion, and weighted smoothing combining the last valid value and current oscillator reading.
Final Output : Applies a final EMA (period 1) and inverts the oscillator (100 - value) to emphasize major lows.
Features
Customizable midline level for signal alerts (default 50).
Visual midline reference line.
Alerts trigger on oscillator crossing below midline for automated monitoring.
Usage
Useful for complementing existing setups or integration in algorithmic trading strategies.
Changing the input parameters opens new ways to leverage the asymmetric range concept, allowing adaptation to different market regimes and enhancing the oscillator’s sensitivity and utility.
Examples of input combinations and their potential purposes include:
Extremely Asymmetric Setting: Lowest Low Lookback = 200, Highest High Lookback = 1
Focuses on deep long-term lows contrasted with immediate highs, ideal for spotting strong oversold levels within an otherwise bullish short-term momentum.
Symmetric Lookbacks: Lowest Low Lookback = Highest High Lookback = 50
Balances the range equally, creating a normalized oscillator that treats recent lows and highs with the same weight — useful for markets with balanced volatility.
Short but Equal Lookbacks: Lowest Low Lookback = Highest High Lookback = 10
Highly sensitive to recent price swings, this setting can detect rapid shifts and is suited for intraday or very short-term trading.
Inverted Extreme: Lowest Low Lookback = 1, Highest High Lookback = 100
Highlights very recent lows against a long-term high range, possibly signaling quick dips in a generally overextended market.
Inputs
Midline Level : Threshold for alerts (default 50).
Lowest Low Lookback Period : Bars evaluated for lowest low (default 100).
Highest High Lookback Period : Bars evaluated for highest high (default 1).
Alerts
Configured to trigger once per bar close when the oscillator crosses below the midline level.
---
Disclaimer
This indicator is for educational and analytical use only.
SMT Oscillator: Smarter Money Divergence Detector [PhenLabs]📊Phenlabs - SMT Oscillator: Smarter Money Divergence Detector
Version: PineScript™v6
📌Description
The SMT Oscillator is a sophisticated tool designed to identify smart money divergence between two correlated assets. By analyzing the momentum and volume-weighted price action of a primary and secondary symbol, traders can spot subtle shifts in market dynamics that often precede significant price movements. This indicator is built to provide a clearer, more filtered view of inter-market relationships, solving the common problem of false signals and market noise. Its primary purpose is to equip traders with a quantifiable edge in detecting potential reversals or continuations that are not obvious on a standard price chart.
🚀Points of Innovation
Dual-Symbol Divergence Core: Directly compares momentum (RSI or MACD) between two user-selected symbols to pinpoint true SMT divergence.
Volume-Weighted Analysis: Integrates volume delta into the divergence calculation, giving more weight to moves backed by significant market participation.
Entropy Filter for Noise Reduction: Employs an entropy calculation to filter out low-quality signals during choppy or consolidating market conditions.
Predictive Forecast Line: Utilizes a linear regression model to project the oscillator’s future trajectory, offering a forward-looking glimpse of potential momentum shifts.
Customizable Signal Sensitivity: Allows fine-tuning of overbought and oversold levels to adapt to different market volatilities and trading styles.
Integrated Signal Alerts: Provides built-in alerts for bullish/bearish zero crosses and overbought/oversold conditions.
🔧Core Components
Momentum Engine: The user can select either RSI or MACD as the underlying engine for the divergence calculation, allowing for flexibility in analysis.
Normalization Function: Price data from both symbols is normalized using percentage change to ensure a true “apples-to-apples” comparison, regardless of their nominal price differences.
Divergence Calculator: The core algorithm that subtracts the secondary symbol’s momentum from the primary’s and normalizes the result using the combined standard deviation.
Smoothing Mechanism: An Exponential Moving Average (EMA) is applied to the raw oscillator output to reduce choppiness and provide a clearer signal line.
🔥Key Features
Multi-Asset Comparison: Go beyond single-asset analysis by comparing correlated pairs like ES/NQ or BTC/ETH to uncover hidden trading opportunities.
Heatmap Visualization: An optional heatmap mode provides an intuitive visual representation of divergence strength, making it easier to gauge market sentiment at a glance.
Configurable Lookback and Timeframe: Adjust the lookback period and analysis timeframe to suit your specific strategy, from short-term scalping to long-term trend analysis.
Signal Markers: Visual markers are plotted directly on the chart for bullish and bearish zero-line crossovers, providing clear entry and exit signals.
🎨Visualization
SMT Oscillator Line: The primary visual element, colored blue for bullish (positive) divergence and orange for bearish (negative) divergence.
Zero Line: A solid horizontal line at the zero level, indicating the equilibrium point between the two assets. Crossovers of this line signal a shift in relative strength.
Overbought/Oversold Zones: Dotted lines at the +80 and -80 levels (customizable) that highlight extreme divergence readings, often indicating potential exhaustion points.
Forecast Line: A predictive line that plots the anticipated path of the oscillator, giving traders an advanced warning of potential changes in momentum.
📖Usage Guidelines
Setting Categories
Primary Symbol
Default: (Chart Symbol)
Description: The main asset you are analyzing. Leave blank to use the symbol currently on your chart.
Secondary Symbol
Default: CME_MINI:ES1! (used with NASDAQ futures due to inherent heavy correlation
Description: The asset to compare against the primary symbol.
Lookback Period
Default: 14
Range: 8-100
Description: Controls the calculation window for momentum (RSI/MACD). Higher values result in a smoother, less sensitive oscillator.
Divergence Type
Default: RSI
Options: RSI, MACD
Description: Choose the momentum indicator to use for the divergence calculation.
Enable Volume Weighting
Default: true
Description: When enabled, gives more weight to divergence signals that are accompanied by significant volume.
✅Best Use Cases
Identifying high-probability reversal points by spotting divergence in overbought or oversold territory.
Confirming the strength of a trend by observing sustained positive or negative divergence.
Pairs trading by taking a long position on the outperforming asset and a short position on the underperforming one during a divergence.
Risk management by recognizing when a current trend is losing its underlying momentum.
⚠️Limitations
Requires Correlated Assets: The indicator’s effectiveness is highly dependent on the selection of two assets with a known correlation (e.g., ES and NQ).
Not a Standalone System: Divergence signals should be used in conjunction with other forms of analysis (price action, market structure) and not as a complete trading system.
Lagging by Nature: As it is based on moving averages and past price data, the oscillator is inherently lagging and may not capture all rapid price changes.
💡What Makes This Unique
Combined Momentum & Volume: Unlike standard oscillators, it fuses momentum with volume delta for a more robust “Smart Money” perspective.
Noise-Filtering Mechanism: The proprietary entropy filter is a unique feature designed to weed out insignificant market chatter and focus on high-conviction signals.
🔬How It Works
Data Normalization:
The script first normalizes the price data of the two selected symbols into percentage changes. This ensures that the comparison is fair, regardless of the difference in their price scales.
Momentum Calculation:
It then calculates the chosen momentum value (either RSI or MACD histogram) for each of the normalized price series.
Divergence Computation:
The core of the indicator lies in subtracting the momentum of the secondary symbol from the primary one. This raw divergence is then optionally weighted by volume and filtered for market noise (entropy) to produce the final oscillator value.
💡Note:
For best results, use this indicator on adequate timeframes to filter out market noise. Always confirm signals with price action analysis before entering a trade.

Momentum_EMABand📢 Reposting Notice
I am reposting this script because my earlier submission was hidden due to description requirements under TradingView’s House Rules. This updated version fully explains the originality, the reason for combining these indicators, and how they work together. Follow me for future updates and refinements.
🆕 Momentum EMA Band, Rule-Based System
Momentum EMA Band is not just a mashup — it is a purpose-built trading tool for intraday traders and scalpers that integrates three complementary technical concepts into a single rules-based breakout & retest framework.
Originality comes from the specific sequence and interaction of these three filters:
Supertrend → Sets directional bias.
EMA Band breakout with retest logic → Times precise entries.
ADX filter → Confirms momentum strength and avoids noise.
This system is designed to filter out weak setups and false breakouts that standalone indicators often fail to avoid.
🔧 How the Indicator Works — Combined Logic
1️⃣ EMA Price Band — Dynamic Zone Visualization
Plots upper & lower EMA bands (default: 9-period EMA).
Green Band → Price above upper EMA = bullish momentum
Red Band → Price below lower EMA = bearish pressure
Yellow Band → Price within band = neutral zone
Acts as a consolidation zone and breakout trigger level.
2️⃣ Supertrend Overlay — Reliable Trend Confirmation
ATR-based Supertrend adapts to volatility:
Green Line = Uptrend bias
Red Line = Downtrend bias
Ensures trades align with the prevailing trend.
3️⃣ ADX-Based No-Trade Zone — Choppy Market Filter
Manual ADX calculation (default: length 14).
If ADX < threshold (default: 20) and price is inside EMA Band → gray background marks low-momentum zones.
🧩 Why This Mashup Works
Supertrend confirms trend direction.
EMA Band breakout & retest validates the breakout’s strength.
ADX ensures the market has enough trend momentum.
When all align, entries are higher probability and whipsaws are reduced.
📈 Example Trade Walkthrough
Scenario: 5-minute chart, ADX threshold = 20.
Supertrend turns green → trend bias is bullish.
Price consolidates inside the yellow EMA Band.
ADX rises above 20 → trend momentum confirmed.
Price closes above the green EMA Band after retesting the band as support.
Entry triggered on candle close, stop below band, target based on risk-reward.
Exit when Supertrend flips red or ADX momentum drops.
This sequence prevents premature entries, keeps trades aligned with trend, and avoids ranging markets.
🎯 Key Features
✅ Multi-layered confirmation for precision trading
✅ Built-in no-trade zone filter
✅ Fully customizable parameters
✅ Clean visuals for quick decision-making
⚠ Disclaimer: This is Version 1. Educational purposes only. Always use with risk management.

THE TRINTY - Multi-Timeframe MACD Alignment (Single Alert)Analyzes up to 3 timeframes at the same time waiting for MACD alignment plus determines when it's very bullish, very bearish, or just mixed. Ideal for traders who only want to trade in high probability markets to increase your chances at success. Also, there's only 1 single alert system that you can set for each pair making things much easier instead of setting separate bullish and bearish alerts like most other indicators.

Relative Strength Range RankRelative Strength Range Rank – Chart Asset vs. Benchmarks
Description:
This indicator calculates and ranks the relative strength position of the current chart’s asset against up to five user-defined comparison symbols. By default, the comparison set is USDT.D, USDC.D and DAI.D.
Calculation method:
The same oscillator calculation is applied identically to the current chart’s asset and all comparison symbols:
For each symbol:
Determine the lowest low over LOWEST bars.
Determine the highest high over HIGHEST bars.
Calculate normalized position within range:
raw_osc = (close - lowest_low) / (highest_high - lowest_low) * 100
Apply a 10-period EMA to smooth raw_osc.
Invert and scale to match assets direction:
raw_osc = 100 - EMA_10(raw_osc)
Apply weighted smoothing:
smoothed = 0.191 * previous_value + 0.809 * current_value
Apply a final 1-period EMA to reduce jitter.
Output is the inverted smoothed oscillator value, representing the relative strength rank.
This function is implemented as calculate_oscillator() and used for all input symbols plus the current chart symbol, ensuring consistency in comparative analysis.
Plotting:
Each comparison symbol oscillator is plotted in the indicator pane.
The current chart oscillator is always plotted in black.
Alert condition:
Boolean chart_osc_above_all is true when the current chart oscillator is strictly greater than all other comparison oscillator values.
The alert chart_osc_crossed_above triggers only on the first bar where chart_osc_above_all changes from false to true.
Smoothing advantage:
The smoothing sequence (EMA → weighted smoothing → EMA) is designed to reduce short-term noise while preserving responsiveness to changes in price position.
The initial EMA(10) filters random fluctuations.
The weighted smoothing step (0.191 * prev + 0.809 * current) reduces overshoot and dampens oscillations without introducing significant lag, unlike longer EMAs.
The final EMA(1) step ensures stability in the plotted oscillator without visible jaggedness.
This combination yields a signal that is both smooth and reactive, making relative strength comparisons more precise.
Inputs:
Sym 1–5: up to five comparison tickers.
Lowest low lookback period ( LOWEST ).
Highest high lookback period ( HIGHEST ).
Color for plotted comparison lines.
Output:
Oscillator values from 0 to 100, where higher values indicate that the asset’s current price is closer to the highest high of the lookback period, and lower values indicate proximity to the lowest low.
Sorted table showing all selected assets ranked by oscillator value.
Optional alert when the current chart asset leads all selected assets in oscillator value.
Short Description:
Computes range-normalized oscillator values for the chart asset and up to 5 symbols, using EMA and weighted smoothing to reduce noise while preserving responsiveness; optional alert when the chart asset exceeds all others.

WaveRider Momentum OscillatorWaveRider Momentum Oscillator
The WaveRider Momentum Oscillator applies principles inspired by fluid dynamics to model price momentum as a flowing system, rather than relying on traditional static calculations. By interpreting market movement through the lens of velocity, viscosity, and turbulence—core concepts in fluid mechanics—this indicator offers a more adaptive and nuanced view of momentum that adjusts dynamically to changing market conditions.
Conceptual Foundation
Velocity: Just as fluid velocity measures the speed of flow at a point, WaveRider calculates momentum velocity by measuring the rate of price change over a specified period, smoothed to reduce noise.
Viscosity: In fluid dynamics, viscosity represents internal friction that resists flow. Here, viscosity is modeled based on volatility, modulating momentum signals to account for the “thickness” or noise level of the market. High volatility increases viscosity’s damping effect, reducing false signals during turbulent price action.
Turbulence: Turbulence characterizes sudden, chaotic changes in fluid flow. WaveRider detects rapid acceleration bursts in momentum analogous to turbulence, highlighting moments when momentum is shifting sharply and potentially signaling strong upcoming price moves.
Technical Features and Interpretation
Adaptive Momentum Calculation: Momentum is scaled by volatility-adjusted viscosity, making the oscillator less prone to whipsaws and more responsive during stable trends.
Turbulence Burst Detection: The oscillator incorporates a turbulence factor, identifying abrupt momentum accelerations that traditional oscillators often miss. This feature provides early warning signals of potential breakout or reversal points.
HSV Gradient Color Mapping: The oscillator visualizes acceleration using a continuous hue gradient—ranging from red (deceleration) through yellow (neutral) to green (acceleration). This continuous color transition provides intuitive, real-time insight into momentum dynamics beyond mere numeric values.
Pivot Point Identification: WaveRider automatically marks momentum pivots, signaling local maxima and minima in momentum flow. These points serve as critical confirmation markers for potential entry and exit decisions.
How to Interpret WaveRider
Colors:
Green hues indicate positive acceleration — momentum is increasing, favoring bullish positions.
Yellow hues represent neutral momentum — the market is consolidating or pausing.
Red hues signal negative acceleration — momentum is weakening, suggesting caution or bearish bias.
Oscillator Direction:
An upward sloping oscillator line reflects strengthening momentum.
A downward slope indicates weakening momentum or a potential reversal.
Pivot Labels:
▲ (Pivot Low): Denotes local momentum troughs; potential points to consider initiating long positions.
▼ (Pivot High): Marks local momentum peaks; useful for identifying possible short entries or profit-taking zones.
Summary
By grounding momentum analysis in fluid dynamics, WaveRider transcends the limitations of traditional oscillators. It accounts for the market’s inherent volatility and captures real-time acceleration changes, enabling traders to detect meaningful momentum shifts with greater accuracy and clarity.
WaveRider is designed for traders seeking a scientifically informed tool that adapts fluidly with market conditions—offering deeper insight into momentum flow and better timing for entries and exits.

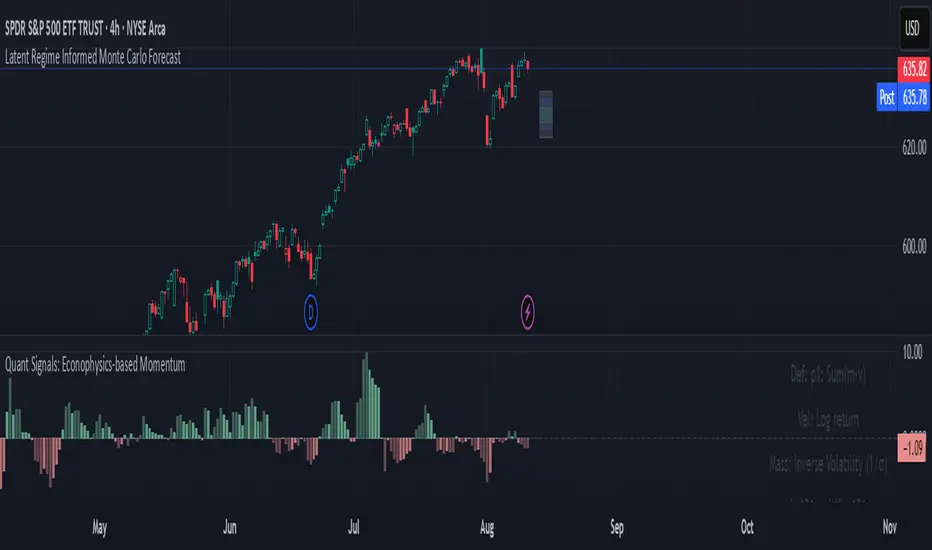
Quant Signals: Econophysics-based MomentumPhysical Momentum Switcher (p0 / p1 / p2 / p3)
This indicator implements a “physical momentum” concept from quantitative finance research, where momentum is defined similarly to physics:
Momentum (p) = Mass × Velocity
Instead of using only the standard cumulative return (classic momentum), it lets you switch between multiple definitions:
p0: Cumulative return over the lookback period (no mass, just price change).
p1: Sum of (mass × velocity) over the lookback period.
p2: Weighted average velocity = (Σ mass×velocity) ÷ (Σ mass).
p3: Sharpe-like momentum = average velocity ÷ volatility (massless).
Velocity can be measured as:
Log return: ln(Pt / Pt-1)
Normal return: (Pt / Pt-1 – 1)
Mass (for p1/p2) can be defined as:
Unit mass (1) — equal weighting, equivalent to traditional momentum.
Turnover proxy — Volume ÷ average volume over k bars.
Value turnover proxy — Dollar volume ÷ average dollar volume.
Inverse volatility — 1 ÷ return volatility over a specified period.
Features:
Switchable momentum definition, velocity type, and mass type.
Adjustable lookback (k) and smoothing period for the signal line.
Optional ±1σ display bands for quick overbought/oversold visual cues.
Alerts for crosses above/below zero or the signal line.
Table display summarizing current settings and values.
Typical uses:
Momentum trading: Buy when PM > 0 (or crosses above the signal), sell/short when PM < 0 (or crosses below).
Contrarian strategies: Reverse the logic when testing mean-reversion effects.
Cross-asset testing: Apply to different instruments to see which PM definition works best.
SMI Base-Trigger Bullish Re-acceleration (Higher High)Description
What it does
This indicator highlights a two-step bullish pattern using Stochastic Momentum Index (SMI) plus an ATR distance filter:
1. Base (orange) – Marks a momentum “reset.” A base prints when SMI %K crosses up through %D while %K is below the Base level (default -70). The base stores the base price and starts a waiting window.
2. Trigger (green) – Confirms momentum and price strength. A trigger prints only if, before the timeout window ends:
• SMI %K crosses up through %D again,
• %K is above the Trigger level (default -60),
• Close > Base Price, and
• Price has advanced at least Min ATR multiple (default 1.0× the 14-period ATR) above the base price.
A dashed green line connects the base to the trigger.
Why it’s useful
It seeks a bullish divergence / reacceleration: momentum recovers from deeply negative territory, then price reclaims and exceeds the base by a volatility-aware margin. This helps filter out weak “oversold bounces.”
Signals
• Base ▲ (orange): Potential setup begins.
• Trigger ▲ (green): Confirmation—momentum and price agree.
Inputs (key ones)
• %K Length / EMA Smoothing / %D Length: SMI construction.
• Base when %K < (default -70): depth required for a valid reset.
• Trigger when %K > (default -60): strength required on confirmation.
• Base timeout (days) (default 100): maximum look-ahead window.
• ATR Length (default 14) and Min ATR multiple (default 1.0): price must exceed the base by this ATR-scaled distance.
How traders use it (example rules)
• Entry: On the Trigger.
• Risk: A common approach is a stop somewhere between the base price and a multiple of ATR below trigger; or use your system’s volatility stop.
• Exits: Your choice—trend MA cross, fixed R multiple, or structure-based levels.
Notes & tips
• Works best on liquid symbols and mid-to-higher timeframes (reduce noise).
• Increase Min ATR multiple to demand stronger price confirmation; tighten or widen Base/Trigger levels to fit your market.
• This script plots signals only; convert to a strategy to backtest entries/exits.
