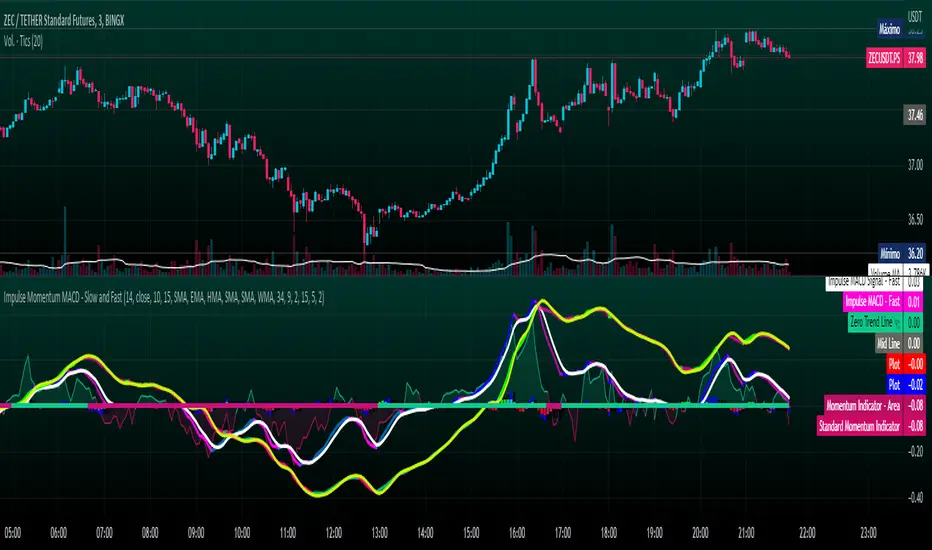
Impulse Momentum MACD - Slow and FastImpulse Momentum MACD - Slow and Fast
The Momentum indicator is a technical indicator that measures the speed and strength of the price movement of a financial asset. This indicator is used to identify the underlying strength of a trend and predict potential changes in price direction, when the indicator crosses the zero line, it can signal a change of direction in the price trend.
On the other hand, the MACD is an indicator used to identify the trend and strength of the market and shows the difference between two exponential moving averages ( EMA ) of different periods. The MACD is commonly used to determine the direction of an asset's price trend.
COPOSITION AND USE OF THE INDICATOR
This script is an implementation of the Impulse Momentum MACD indicator with two variations: slow and fast. It uses a combination of the Momentum indicator and the Moving Average Convergence/Divergence (MACD) indicator to identify trend reversals and momentum changes in an asset's price.
The combination of both indicators can help traders identify market entry and exit opportunities. The Impulse Momentum MACD is a Modified MACD, it is formed by filtering the values in a range of Modifiable Moving Averages by calculating their high and low ranges,This indicator has two parts: a slow part and a fast part. The slow part uses input values for the lengths of the moving averages and the length of the signal for the MACD indicator. The fast part uses different input values for the lengths of the moving averages. Also, each part has its own set of line colors and histogram colors for easy visualization.
The script also includes inputs to choose the type of moving average to use (SMA, EMA, etc.), the lookback period, the colors for the histogram lines and bars, and a zero trend line (also known as a horizontal trend line). ).
* Highest performing custom settings for the zero trend line. For Operations of:
- One Minute: Trend Line Time Frame = Five Minutes.
- Three Minutes: Trend Line Time Frame = Fifteen Minutes.
- Five Minutes: Trend Line Time Frame = Thirty Minutes.
- Fifteen Minutes: Trend Line Time Frame = Sixty Minutes.
Rules For Trading
🔹 Bullish:
* The Zero Horizontal Trend Line should be in Green Color.
* The Slow Histogram Bar should be in Green Color.
* The Fast Histogram Bar must be in Blue or Black Color or No Bar Appears.
* The Momentum Line or Momentum Area must be in Green Color.
crosses:
- When the Impulse Momentum MACD Slow line crosses the Impulse Momentum MACD Slow signal line upwards.
- When the Impulse Momentum MACD Fast line crosses the Impulse Momentum MACD Fast signal line upwards.
- Note 1: A Position is Opened when the condition of any of the aforementioned crossovers is met.
- Note 2: If the two aforementioned crossings anticipate the condition of the Zero Horizontal Tendency Line because it is in Red; A position is only opened immediately when the Zero Horizontal Trend line turns Green.
🔹 Bearish:
* The Zero Horizontal Trend Line should be in Red Color.
* The Slow Histogram Bar should be in Red Color.
* The Fast Histogram Bar must be in Blue or Black Color or No Bar Appears.
* The Momentum Line or Momentum Area must be in Red Color.
crosses:
- When the Impulse Momentum MACD Slow line crosses the Impulse Momentum MACD Slow signal line downwards.
- When the Impulse Momentum MACD Fast line crosses the Impulse Momentum MACD Fast signal line downwards.
- Note 1: A Position is Opened when the condition of any of the aforementioned crossovers is met.
- Note 2: If the two aforementioned crossings anticipate the condition of the Zero Horizontal Tendency Line because it is Green, an immediate position is only opened when the Zero Horizontal Tendency line turns Red.
This script can be used in different markets such as forex, indices and cryptocurrencies for analysis and trading. However, it is important to note that no trading strategy is guaranteed to be profitable, and traders should always conduct their own research and risk management.
Osciladores Centrados
Know Sure Thing + RibbonFrom now on this will be the main indicator I will be using.
The mathematical foundation of KST is elegant and trustworthy. I took the time to share this beautiful (in my opinion) indicator, because you will probably be seeing it in my future ideas.
I am not a trader, this indicator was made to analyze mainly long-term charts, and trend-continuation/change analysis.
The purpose of this indicator is not to give entry/exit points. However, the 9-period EMA (tightest EMA) can serve as an alternative to the classic "9-period MA signal line".
Tread lightly, for this is hallowed ground.
-Father Grigori

Stochastic Momentum Index (SMI) of Money Flow Index (MFI)"He who does not know how to make predictions and makes light of his opponents, underestimating his ability, will certainly be defeated by them."
(Sun Tzu - The Art of War)
▮ Introduction
The Stochastic Momentum Index (SMI) is a technical analysis indicator that uses the difference between the current closing price and the high or low price over a specific time period to measure price momentum.
On the other hand, the Money Flow Index (MFI) is an indicator that uses volume and price to measure buying and selling pressure.
When these two indicators are combined, they can provide a more comprehensive view of price direction and market strength.
▮ Improvements
By combining SMI with MFI, we can gain even more insights into the market. One way to do this is to use the MFI as an input to the SMI, rather than just using price.
This means we are measuring momentum based on buying and selling pressure rather than just price.
Another way to improve this indicator is to adjust the periods to suit your specific trading needs.
▮ What to look
When using the SMI MFI indicator, there are a few things to look out for.
First, look at the SMI signal line.
When the line crosses above -40, it is considered a buy signal, while the crossing below +40 is considered a sell signal.
Also, pay attention to divergences between the SMI MFI and the price.
If price is rising but the SMI MFI is showing negative divergence, it could indicate that momentum is waning and a reversal could be in the offing.
Likewise, if price is falling but the SMI MFI is showing positive divergence, this could indicate that momentum is building and a reversal could also be in the offing.
In the examples below, I show the use in conjunction with the price SMI, in which the MFI SMI helps to anticipate divergences:
In summary, the SMI MFI is a useful indicator that can provide valuable insights into market direction and price strength.
By adjusting the timeframes and paying attention to divergences and signal line crossovers, traders can use it as part of a broader trading strategy.
However, remember that no indicator is a magic bullet and should always be used in conjunction with other analytics and indicators to make informed trading decisions.

WillyCycle Oscillator&DoubleMa/ErkOzi/"This code creates a technical analysis indicator used to calculate and visualize the WillyCycle oscillator and double moving average indicators on the price of a financial asset. The functionality can be summarized as follows:
*Calculate the WillyCycle oscillator: The WillyCycle is an oscillator calculated based on the highest and lowest values of an asset. This oscillator is used to measure overbought or oversold conditions of the asset.
*Calculate the double moving average: The double moving average helps determine trends by calculating the short-term and long-term moving averages of asset prices.
*Use the WillyCycle oscillator and double moving average indicators together: The WillyCycle oscillator is combined with the double moving averages to provide a clearer indication of overbought and oversold conditions.
*Visualize the indicator with color coding: The indicator is color-coded to show overbought and oversold conditions. Additionally, line and background colors are changed to make the indicator more readable.
Many parameters can be adjusted on the indicator: The indicator can be customized and modified by the user. For example, the period of the WillyCycle oscillator and the lengths of the double moving averages can be adjusted."
The strategy is based on two indicators - the WillyCycle oscillator and the double moving average. The WillyCycle oscillator measures overbought and oversold conditions of the asset based on its highest and lowest values. The double moving average calculates short-term and long-term moving averages of the asset's price, which can help identify trends.
The WillyCycle oscillator and the double moving average are combined in this strategy to provide a clearer indication of overbought and oversold conditions. When the WillyCycle oscillator indicates that the asset is oversold and the short-term moving average crosses above the long-term moving average, it may signal a buy opportunity. Conversely, when the WillyCycle oscillator indicates that the asset is overbought and the short-term moving average crosses below the long-term moving average, it may signal a sell opportunity.
To make it easier for traders to read and interpret the indicator, color-coding is used to indicate overbought and oversold conditions. The user can also customize the indicator by adjusting parameters such as the period of the WillyCycle oscillator and the lengths of the double moving averages.
*ıt provides successful buy and sell signals for price reversals.
*You can open counter trades in overbought and oversold areas by following the averages.

Stochastic Momentum Index (SMI) Refurbished▮Introduction
Stochastic Momentum Index (SMI) Indicator is a technical indicator used in technical analysis of stocks and other financial instruments.
It was developed by William Blau in 1993 and is considered to be a momentum indicator that can help identify trend reversal points.
Basically, it's a combination of the True Strength Index with a signal line to help identify turning points in the market.
SMI uses the stochastic formula to compare the current closing price of an asset with the maximum and minimum price range over a specific period.
He then compares this ratio to a short-term moving average to create an indicator that oscillates between -100 and +100.
When the SMI is above 0, it is considered positive, indicating that the current price is above the short-term moving average.
When it is below 0, it is considered negative, indicating that the current price is below the short-term moving average.
Traders use the SMI to identify potential trend reversal points.
When the indicator reaches an extreme level above +40 or below -40, a trend reversal is possible.
Furthermore, traders also watch for divergences between the SMI and the asset price to identify potential trading opportunities.
It is important to remember that the SMI is a technical indicator and as such should be used in conjunction with other technical analysis tools to get a complete picture of the market situation.
▮ Improvements
The following features were added:
1. 7 color themes, for TSI, Signal and Histogram.
2. Possibility to customize moving average type for TSI/Signal.
3. Dynamic Zones.
4. Crossing Alerts.
5. Alert points on specific ranges.
5. Coloring of bars according to TSI/Signal/Histogram.
▮ Themes
Examples:
▮ About Dynamic Zones
'Most indicators use a fixed zone for buy and sell signals.
Here's a concept based on zones that are responsive to the past levels of the indicator.'
The concept of Dynamic Zones was described by Leo Zamansky ( Ph .D.) and David Stendahl, in the magazine of Stocks & Commodities V15:7 (306-310).
Basically, a statistical calculation is made to define the extreme levels, delimiting a possible overbought/oversold region.
Given user-defined probabilities, the percentile is calculated using the method of Nearest Rank.
It is calculated by taking the difference between the data point and the number of data points below it, then dividing by the total number of data points in the set.
The result is expressed as a percentage.
This provides a measure of how a particular value compares to other values in a data set, identifying outliers or values that are significantly higher or lower than the rest of the data.
▮ What to look for
1. Divergences/weakening of a trend/reversal:
2. Supports, resistances, pullbacks:
3. Overbought/Oversold Points:
▮ Thanks and Credits
- TradingView and PineCoders: for SMI and Moving Averages
- allanster: for Dynamic Zones

Colorful Moving Averageswhat is Colorful Moving Averages?
This indicator allows you to use your favorite moving averages in their advanced form.
what it does?
It gives you easy access to the following information with a single indicator: the direction and momentum of the price,
rate of change of momentum (acceleration),
time-dependent change in momentum,
and all the other information a moving average provides.
it paints the selected moving average type according to the momentum it has, and also shows the momentum and acceleration values in a table. colors are interpreted as follows: the color of the moving average is red, the momentum is negative; A green color means the momentum is positive, and a yellow color means the momentum is 0. As the momentum changes, the moving average takes on different shades of these 3 colors. how it actually works can be easily understood at a glance.
"Δ" sign indicates momentum compressed between 100 and -100.
"Γ" sign indicates the momentum of the momentum, that is the acceleration. its values are compressed between 100 and -100.
how it does it?
it uses this formulas:
how to use it?
First, select the moving average type you want to use. then set the length and source. Now, with a single indicator, you can observe both the distance of the price from the mean, its instantaneous momentum relative to the last candle by looking at the symbol "Δ", the current change of momentum by looking at the symbol "Γ", and the time-dependent change in its momentum by looking at the colors. you can also see the maximum and minimum points where the momentum is equal to 0.

[blackcat] L2 Super OscillatorLevel2
Background
A super oscillator with overbought and oversold detections.
Function
Represented by a white line, this Super Oscillator indicator identifies instruments that are overbought or oversold, which can be an important part of determining buy and sell points. An oversold market is a market that has fallen sharply and is expected to recover. In this indicator, gray candlesticks are used at the bottom to show that an oversold zone is near and a red candlestick shows that the overbought zone is ending. On the other hand, an overbought market has risen sharply and could be ripe for a decline. Yellow line dips are used to indicate overbought zones.
Remarks
Feedbacks are appreciated.

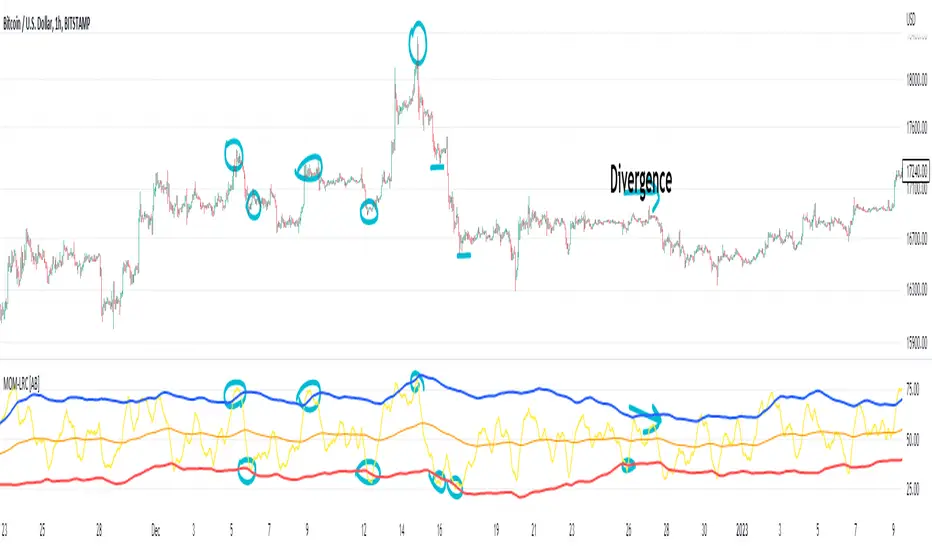
(Very promising) [Abdullah Ahmed] Momentum indicator V.1Description: MOM-LRC is a powerful technical analysis indicator designed to provide traders with signals based on the momentum of an asset's price and its deviation from its mean value. The indicator calculates the exponential RSI and uses a custom function to determine the percentage change from the mean. The upper and lower bands of the momentum channel are then calculated using linear regression of the rate of change from the mean. The channel multiplier can be adjusted to increase or decrease the sensitivity of the indicator.
How to use :
1 - Using MOM-LRC , look for buy signals when the price of the asset is below the lower border of the channel and retracing up. The opposite is true in the case of sell signals.
2 - It is also used in the case of negative and positive divergences, just as you use RSI
The indicator can be used on any time frame and any asset, making it a versatile tool for traders of all levels.
features:
Calculates exponential RSI and percentage change from the mean
Uses linear regression to calculate upper and lower bands of momentum channel
Adjustable channel multiplier for increased sensitivity
Suitable for any time frame and any asset
Happy trading!
Supertrend ANY INDICATOR (RSI, MFI, CCI, etc.) + Range FilterThis indicator will generate a supertrend of your chosen configuration on any of the following indicators:
RSI
MFI
Accum/Dist
Momentum
On Balance Volume
CCI
There is also a RANGE FILTER built into the scripts so that you can smooth the indicators for the supertrend. This is an optional configuration in the settings. Also, you can change the oversold/overbought bounds in the settings (they are removed entirely for indicators without bounds).
If you find this indicator useful, please boost it and follow! I am open to suggestions for adding new indicators to this script, it's very simple to add new ones, just suggest them in the comments.

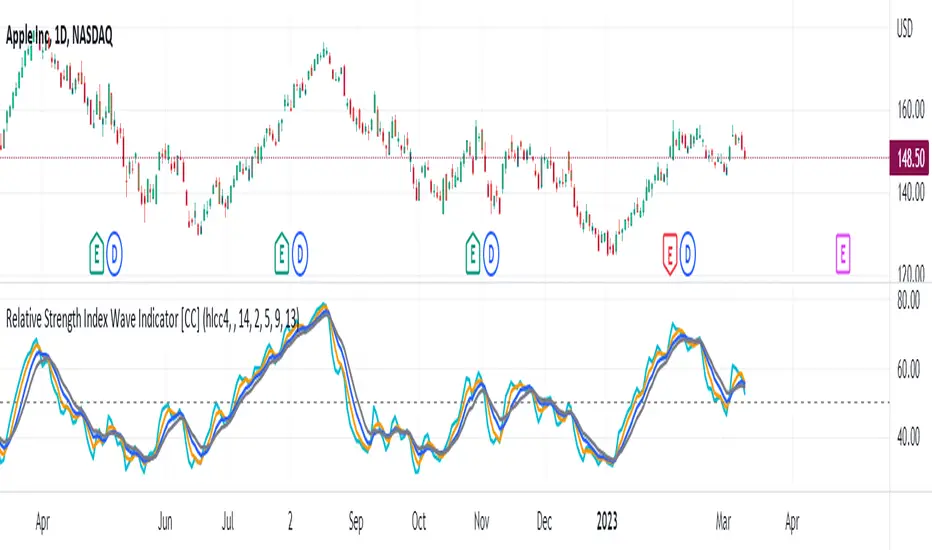
Relative Strength Index Wave Indicator [CC]The Relative Strength Index Wave Indicator was created by Constance Brown (Technical Analysis for the Trading Professional), and this is a unique indicator that uses the weighted close formula, but instead of using the typical price values, it uses the RSI calculated from the various prices. It then creates a rainbow by smoothing the weighted RSI with four different lengths. As far as the buy or sell signals with this indicator go, I did change things from the original source, so feel free to experiment and let me know if anything works better for you. I decided to do a variation of the original source and create buy and sell signals based on crossovers, but my version only uses the first and second smoothed RSI lines. You could also average all of the lines and buy when the average is rising and sell when it starts to fall. I have used my typical buy and sell signals to use darker colors for strong signals and lighter colors for normal signals. Because of the rainbow effect from the wave, the color changes will only appear for the bar itself when you enable that setting.
Let me know if there is any other script you would like to see me publish! I will have plenty more RSI scripts to publish in the next week. Let me know if you like this indicator series.
MACD & RSI Overlay (Expo)█ Overview
The MACD & RSI Overlay (Expo) trading indicator is a technical analysis tool that combines two popular indicators, the Relative Strength Index (RSI ) and the Moving Average Convergence Divergence (MACD ), and overlays them onto the price chart. The indicator oscillates relative to price, so it plots the RSI and MACD around price while still displaying the same insights as the regular MACD and RSI indicators. This feature gives traders a unique perspective, allowing them to see the relationship between price, momentum, and trend in a single chart.
This indicator is a valuable addition to any trader's technical analysis toolkit, whether they are a beginner or an experienced trader.
█ MACD
█ RSI
The RSI comes with overbought and oversold areas, which can be set by the trader.
█ MACD & RSI
█ Trend Feature
What sets the MACD & RSI Overlay indicator apart is its ability to factor in the underlying trend. This feature makes the indicator more useful than ever before, as traders can use it to filter trades in the direction of the trend. By considering the underlying trend, traders can gain valuable insights into market trends.
█ Benefits
One of the primary benefits of having the MACD and RSI plotted directly on the price chart is that it provides a more intuitive understanding of the relationship between price, momentum, and trend. Traders can quickly identify the direction of the trend by observing the price movement relative to the MACD and RSI lines. In addition, by having these indicators plotted on the chart, traders can quickly identify potential buy and sell signals and develop new trading strategies.
█ How to use
One of the most popular strategies is to use the MACD & RSI Overlay indicator to look for crossings. A crossing occurs when the MACD and RSI lines cross over each other or when they cross over the signal line. These crossings can signal potential trend reversals and momentum shifts. For example, if the MACD line crosses over the signal line from below, it could indicate a bullish signal, while a cross from above could indicate a bearish signal.
-----------------
Disclaimer
The information contained in my Scripts/Indicators/Ideas/Algos/Systems does not constitute financial advice or a solicitation to buy or sell any securities of any type. I will not accept liability for any loss or damage, including without limitation any loss of profit, which may arise directly or indirectly from the use of or reliance on such information.
All investments involve risk, and the past performance of a security, industry, sector, market, financial product, trading strategy, backtest, or individual's trading does not guarantee future results or returns. Investors are fully responsible for any investment decisions they make. Such decisions should be based solely on an evaluation of their financial circumstances, investment objectives, risk tolerance, and liquidity needs.
My Scripts/Indicators/Ideas/Algos/Systems are only for educational purposes!
Ehlers Stochastic Center Of Gravity [CC]The Stochastic Center Of Gravity Indicator was created by John Ehlers (Cybernetic Analysis For Stocks And Futures pgs 79-80), and this is one of the many cycle scripts that I have created but not published yet because, to be honest, I don't use cycle indicators in my everyday trading. Many of you probably do, so I will start publishing my big backlog of cycle-based indicators. These indicators work best with a trend confirmation or some other confirmation indicator to pair with it. The current cycle is the length of the trend, and since most stocks generally change their underlying trend quite often, especially during the day, it makes sense to adjust the length of this indicator to match the stock you are using it on. As you can see, the indicator gives constant buy and sell signals during a trend which is why I recommend using a confirmation indicator.
I have color-coded it to use lighter colors for normal signals and darker colors for strong signals. Buy when the line turns green and sell when it turns red.
Let me know if there are any other scripts you would like to see me publish!

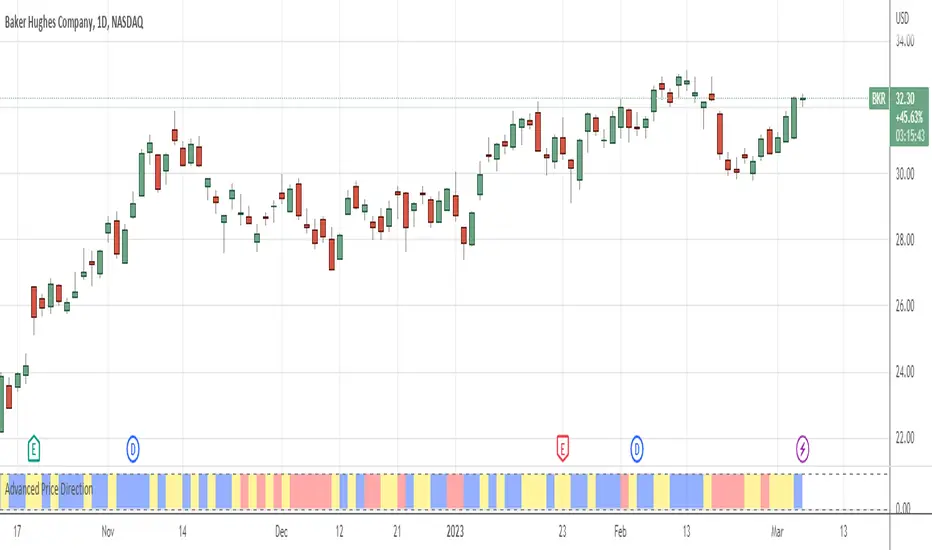
Advanced Price Direction AlgorithmPrices can go up or down or falter in their movement.
This code evaluates this by looking at two consecutive bars or sets of bars.
If you put the set size to 1, the current and previous bar is evaluated.
If put to 2, the last2 and the 2 before these are evaluated.
Default is 12 because this seems to coincide with trend changes.
This code provides an advanced way to evaluate what the price does in a sort of three-value Boolean with the values up, down or falter.
I use this code in indicators I develop where price direction is taken into account.
The simple output makes it possible to use it as an indicator on its own.
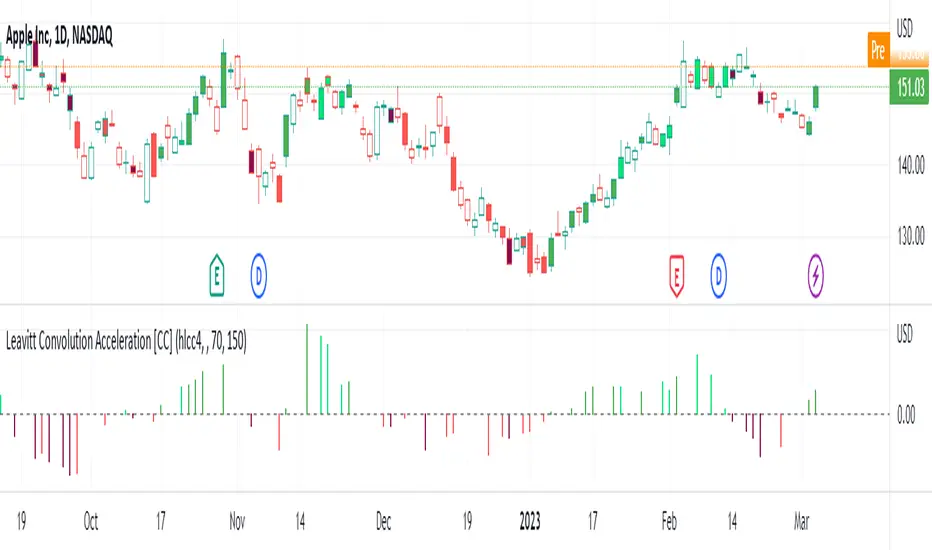
Leavitt Convolution Acceleration [CC]The Leavitt Convolution Slope indicator was created by Jay Leavitt (Stocks and Commodities Oct 2019, page 11), who is most well-known for creating the Volume-Weighted Average Price indicator. This indicator didn't have a good explanation or description so I custom-coded most of it. The way it works is it will give trend spikes in the direction of the underlying trend. If you don't see a spike then it means that the stock isn't trending at the moment. One possible avenue to explore with this indicator is judging the size of the trend spike before you open a position in that direction (or the opposite direction if you are shorting). I added a normalization function using code from a good friend @loxx that I recommend leaving on but feel free to experiment with it. I have color coded the lines to turn light green for a standard buy signal or dark green for a strong buy signal and light red for a standard sell signal, and dark red for a strong sell signal.
This is another indicator in a series that I'm publishing to fulfill a special request from @ashok1961 so let me know if you ever have any special requests for me.
+ Average Candle Bodies RangeACBR, or, Average Candle Bodies Range is a volatility and momentum indicator designed to indicate periods of increasing volatility and/or momentum. The genesis of the idea formed from my pondering what a trend trader is really looking for in terms of a volatility indicator. Most indicators I've come across haven't, in my opinion, done a satisfactory job of highlighting this. I kept thinking about the ATR (I use it for stops and targets) but I realized I didn't care about highs or lows in regards to a candle's volatility or momentum, nor do I care about their relation to a previous close. What really matters to me is candle body expansion. That is all. So, I created this.
ACBR is extremely simple at its heart. I made it more complicated of course, because why would I want anything for myself to be simple? Originally it was envisaged to be a simple volatility indicator highlighting areas of increasing and decreasing volatility. Then I decided some folks might want an indicator that could show this in a directional manner, i.e., an oscillator, so I spent some more hours tackling that
To start, the original version of the indicator simply subtracts opening price from closing price if the candle closes above the open, and subtracts the close from the open if the candle closes below the open. This way we get a positive number that simply measures candle expansion. We then apply a moving average to these values in order to smooth them (if you want). To get an oscillator we always subtract the close from the open, thus when a candle closes below its open we get a negative number.
I've naturally added an optional signal line as a helpful way of gauging volatility because obviously the values themselves may not tell you much. But I've also added something that I call a baseline. You can use this in a few ways, but first let me explain the two options for how the baseline can be calculated. And what do I mean by 'baseline?' I think of it as an area of the indicator where if the ACBR is below you will not want to enter into any trades, and if the ACBR is above then you are free to enter trades based on your system (or you might want to enter in areas of low volatility if your system calls for that). Waddah Attar Explosion is another indicator that implements something similar. The baseline is calculated in two different ways: one of which is making a Donchian Channel of the ACBR, and then using the basis as the baseline, while the other is applying an RMA to the cb_dif, which is the base unit that makes up the ACBR. Now, the basis of a Donchian Channel typically is the average of the highs and the lows. If we did that here we would have a baseline much too high (but maybe not...), however, I've made the divisor user adjustable. In this way you can adjust the height (or I guess you might say 'width' if it's an oscillator) however you like, thus making the indicator more or less sensitive. In the case of using the ACBR as the baseline we apply a multiplier to the values in order to adjust the height. Apologies if I'm being overly verbose. If you want to skip all of this I have tooltips in the settings for all of the inputs that I think need an explanation.
When using the indicator as an oscillator there are baselines above and below the zero line. One funny thing: if using the ACBR as calculation type for the baselines in oscillator mode, the baselines themselves will oscillate around the zero line. There is no way to fix this due to the calculation. That isn't necessarily bad (based on my eyeball test), but I probably wouldn't use it in such a way. But experiment! They could actually be a very fine entry or confirmation indicator. And while I'm on the topic of confirmation indicators, using this indicator as an oscillator naturally makes it a confirmation indicator. It just happens to have a volatility measurement baked into it. It may also be used as an exit and continuation indicator. And speaking of these things, there are optional shapes for indicating when you might want to exit or take a continuation trade. I've added alerts for these things too.
Lastly, oscillator mode is good for identifying divergences.
Above we have the indicator set to directional, or oscillator, mode. Baselines are Donchian Channels. I changed the default EMA length from 4 to 24 in this case, otherwise all the settings are default, as in the main image for the indicator (which is clearly set to non-directional). The indicator is set to requiring an advancing signal line for background and bar colors. Background color is not on by default. Candle colors, as you can see are aqua when above the top baseline (and only when the signal line is advancing, as per the settings), magenta when below the bottom baseline, and grey for anything else. The red and blue X's are exit signals. There are two types: one, when the signal line weakens and, two, when the ACBR crosses above or below the signal line. There are also arrows. These are continuation signals (ACBR crossing signal line).
Same image as above, but the baselines are set to ACBR rather than Donchian Channels.
Again, the same image, but with everything but the ACBR Baseline turned off. You can see how this might make for an excellent confirmation indicator, but for the areas of chap. Maybe run a second instance of the indicator on your chart as a volatility indicator, as you would not be using it in that way in this instance.
Here I have bar coloring turned off except for signal line crosses NOT requiring the signal line to be advancing. Background coloring is also turned on. You can see that these all line up with continuation signals, or exits for purple candles.
Same image as above but requiring the signal line to be advancing. You can see that continuation signals are not contingent upon the signal line to be advancing. I had it setup that way at first, but of course it still gave false signals, so I thought more signals (not that there are many) is better than fewer. To be sure, just because the indicator shows a continuation signal does not mean you should always take it.
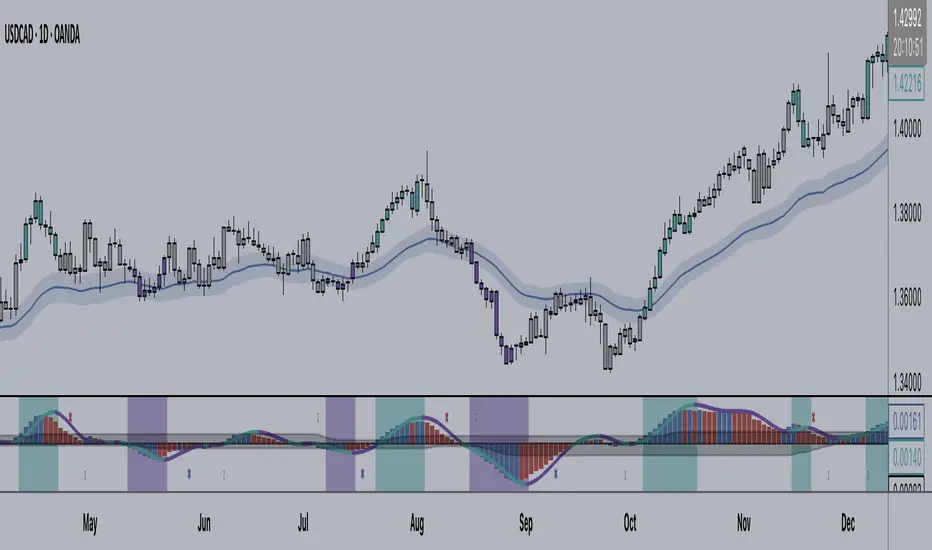
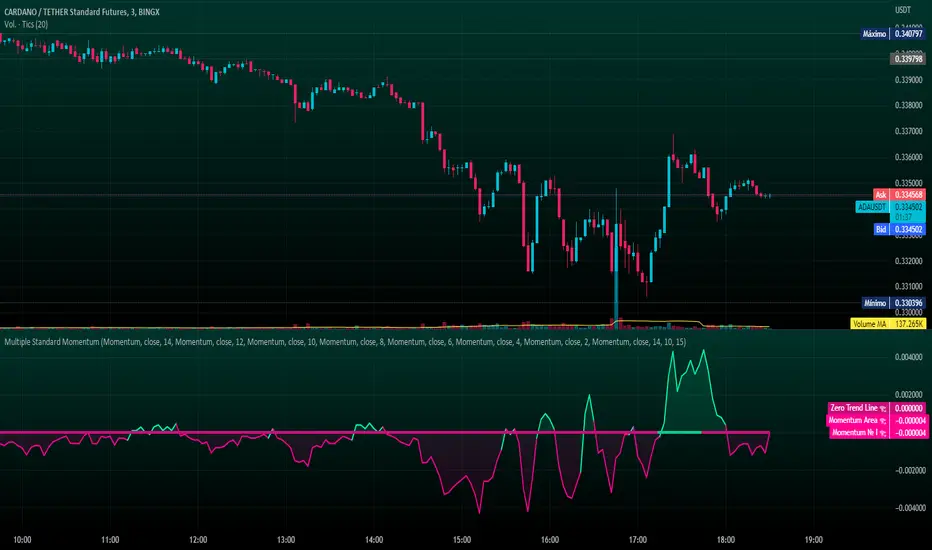
Multiple Standard MomentumMultiple Standard Momentum
The momentum indicator is a technical indicator that measures the speed and strength of the price movement of a financial asset. This indicator is used to identify the underlying strength of a trend and predict potential changes in price direction.
The calculation of the momentum indicator is based on the difference between the current price and the price of a previous period. The result is displayed on a chart, which can be positive or negative, depending on whether the current price is higher or lower than the price of the previous period. The indicator can be used on any time frame, but is generally used on short-term charts.
To use the momentum indicator , you look for two types of signals:
🔹 Crossover Signal – When the indicator crosses the zero line, it can signal a change of direction in the price trend.
🔹 Divergence – When the asset price moves in one direction and the indicator moves in the opposite direction, a divergence can be identified. This divergence may indicate a possible trend reversal.
COMPOSITION AND MODE OF USE OF THE INDICATOR
🔹 This indicator displays multiple Momentum levels on a single chart, allowing you to view multiple Momentum lines. Each level is represented on the chart where it can be hidden or shown as desired for better market analysis.
🔹 In addition, a zero trend line (also known as a horizontal trend line) has been added. The zero trend line is a horizontal line that indicates the point at which the current price equals the opening price, which allows users to draw a custom zero trend line on the chart using different colors and time periods of calculation.
* Highest performing custom setup for the Zero Trend Line. For Operations of:
- One Minute: Trend Line Time Frame = Five Minutes.
- Three Minutes: Trend Line Time Frame = Fifteen Minutes.
- Five Minutes: Trend Line Time Frame = Thirty Minutes.
- Fifteen Minutes: Trend Line Time Frame = Sixty Minutes.
Rules For Trading
🔹 Bullish:
* The Zero Trend Line must be in Green Color.
* When the Momentum Line Crosses the Zero Line from Bottom to Top.
🔹 Bearish:
* The Zero Trend Line must be in Red Color.
* When the Momentum Line Crosses the Zero Line from Top to Bottom.
In addition, parameters were defined to activate or deactivate the graphic signal taking into account the previous requirement (Bullish and Bearish):
🔹 Long or Buy = ▲
🔹 Short or Sell = ▼
This script can be used in different markets such as forex, indices, and cryptocurrencies for analysis and trading. However, it is important to note that no trading strategy is guaranteed to be profitable, and traders should always conduct their own research and risk management.
Super 6x: RSI, MACD, Stoch, Loxxer, CCI, & Velocity [Loxx]Super 6x: RSI , MACD , Stoch , Loxxer, CCI , & Velocity is a combination of 6 indicators into one histogram. This includes the option to allow repainting.
What is MACD?
Moving average convergence divergence ( MACD ) is a trend-following momentum indicator that shows the relationship between two moving averages of a security’s price. The MACD is calculated by subtracting the 26-period exponential moving average ( EMA ) from the 12-period EMA .
What is CCI?
The Commodity Channel Index ( CCI ) measures the current price level relative to an average price level over a given period of time. CCI is relatively high when prices are far above their average. CCI is relatively low when prices are far below their average. Using this method, CCI can be used to identify overbought and oversold levels.
What is RSI?
The relative strength index is a technical indicator used in the analysis of financial markets. It is intended to chart the current and historical strength or weakness of a stock or market based on the closing prices of a recent trading period. The indicator should not be confused with relative strength .
What is Stochastic?
The stochastic oscillator, also known as stochastic indicator, is a popular trading indicator that is useful for predicting trend reversals. It also focuses on price momentum and can be used to identify overbought and oversold levels in shares, indices, currencies and many other investment assets.
What is Loxxer?
The Loxxer indicator is a technical analysis tool that compares the most recent maximum and minimum prices to the previous period's equivalent price to measure the demand of the underlying asset.
What is Velocity?
In simple words, velocity is the speed at which something moves in a particular direction. For example as the speed of a car travelling north on a highway, or the speed a rocket travels after launching.
How to use
Long signal: All 4 indicators turn green
Short signal: All 4 indicators turn red
Included
Bar coloring
Alerts

Return Abnormality Score [SpiritualHealer117]The Return Abnormality Score indicator is designed to help traders identify potential reversals in price by detecting abnormal daily returns beyond a certain significance level. The indicator uses a normal cumulative distribution function to calculate the probability of the daily return and flags it when it exceeds the specified significance level.
Traders can use this indicator by monitoring the abnormality score. If the daily return is negative, the probability is multiplied by a negative number. Therefore, if the abnormality score goes above the positive threshold, it suggests that the price is oversold, while if it goes below the negative threshold, it indicates that the price is overbought. It can also be helpful for spotting bear or bull traps due to their irregular behavior.
Depending on the trader's preference, the indicator can be smoothed or unsmoothed.
This indicator should be paired with other technical analysis tools like SSL Hybrid for trend confirmation, and proper risk management strategies.

Ehlers Detrending Filter [CC]The Detrending Filter was created by John Ehlers and this is a complementary indicator to one of my previous scripts:
This indicator builds upon his previous work by attempting to detrend the underlying source data that is used to calculate the final result. He was able to create a leading indicator by removing the trend data and by using his previous calculations to turn the source data into a leading indicator.
There are two ways to understand this indicator. First if the indicator is below the midline then it is in a mid to longterm downtrend and if it is above the midline then it is in a mid to longterm uptrend. Also this indicator shows great promise in predicting future trends so because of that aspect, it may give some false signals from time to time.
I have color coded everything to account for both strong signals and normal signals. Strong signals are darker in color and normal signals are lighter in color. Buy when the line turns green and sell when it turns red.
Let me know if there are any other scripts you would like to see me publish!

Stochastic MACD - Slow and FastStochastic MACD - Slow and Fast
The "Stochastic MACD - Slow and Fast" indicator combines two popular technical indicators, the Stochastic Oscillator and the Moving Average Convergence Divergence ( MACD ).
The Stochastic Oscillator is a momentum indicator that measures the current closing position of an asset relative to its recent price range. This indicator helps traders identify possible turning points in an asset's trend, it is used to identify if the market is overbought or oversold.
On the other hand, the MACD is an indicator used to identify the trend and strength of the market and shows the difference between two exponential moving averages ( EMA ) of different periods. The MACD is commonly used to determine the direction of an asset's price trend.
The combination of both indicators can help traders identify market entry and exit opportunities. This indicator has two parts: a slow part and a fast part. The slow part uses input values for the lengths of the moving averages and the length of the signal for the MACD indicator. The fast part uses different input values for the lengths of the moving averages. Also, each part has its own set of line colors and histogram colors for easy visualization.
In general, the "Stochastic MACD - Slow and Fast" indicator is used to identify possible turning points in the trend of an asset. Traders can use the indicator to determine when to enter or exit a position based on the signals generated by the indicator. The stochastic MACD is a variation of the regular MACD that incorporates a stochastic oscillator to provide additional signals.
In summary, this indicator can be useful for those looking for a combination of two popular indicators to help identify trading opportunities.
In addition, parameters were defined to activate or deactivate the graphic signal.
When the Stochastic MACD Slow Line Crosses the Stochastic MACD Slow Signal Line:
Long or Buy = ↑ // The Entry is more Effective if it is made when the signal is below the Zero Trend Line .
Short or Sell = ↓ // The Entry is more Effective if it is made when the signal is above the Zero Trend Line .
When the Fast Stochastic MACD Line Crosses the Slow Stochastic MACD Line:
Long or Buy = ▲ // The Entry is more Effective if it is made when the signal is below the Zero Trend Line .
Short or Sell = ▼ // The Entry is more Effective if it is made when the signal is above the Zero Trend Line .
Taking into account the above, alerts were also defined for possible Purchases or Sales or entries in Long or Short.
COPOSITION AND USE OF THE INDICATOR
This script is an implementation of the Stochastic MACD indicator with two variations - Slow and Fast. It uses a combination of the Stochastic Oscillator and the Moving Average Convergence Divergence (MACD) indicator to identify trend reversals and momentum shifts in the price of an asset.
The Slow version of the Stochastic MACD is built using three inputs - fastLength, slowLength, and signalLength. The fastLength and slowLength are used to calculate two exponential moving averages (EMAs), while the signalLength is used to calculate a signal line as an EMA of the difference between the two EMAs. The Stochastic Oscillator is then applied to the difference between the two EMAs, and the resulting values are plotted on the chart.
The Fast version of the Stochastic MACD is built using the same inputs as the Slow version, but with different values. It uses a shorter fastLength value and a longer slowLength value to generate the two EMAs, and the resulting values are plotted on the chart.
The script also includes inputs for choosing the type of moving average to use (SMA, EMA, etc.), the source of price data (open, close, etc.), the lookback period, and the colors for the lines and histogram bars.
This script can be used in different markets such as forex, indices, and cryptocurrencies for analysis and trading. However, it is important to note that no trading strategy is guaranteed to be profitable, and traders should always conduct their own research and risk management.

Faytterro Oscillatorwhat is Faytterro oscillator?
An oscillator that perfectly identifies overbought and oversold zones.
what it does?
this places the price between 0 and 100 perfectly but with a little delay. To eliminate this delay, it predicts the price to come, and the indicator becomes clearer as the probability of its prediction increases.
how it does it?
This indicator is obtained with "faytterro bands", another indicator I designed. For more information about faytterro bands:
A kind of stochastic function is applied to the faytterro bands indicator, and then another transformation formula that I have designed and explained in detail in the link above is applied. These formulas are also applied again to calculate the prediction parts.
how to use it?
Use this indicator to see past overbought and oversold zones and to see future ones.
The input named source is used to change the source of the indicator.
The length serves to change the signal frequency of the indicator.

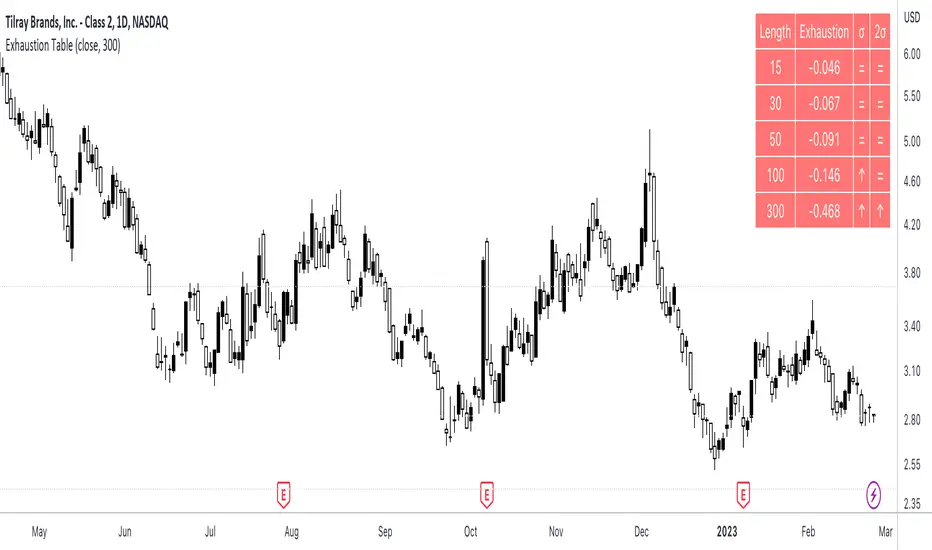
Exhaustion Table [SpiritualHealer117]A simple indicator in a table format, is effective for determining when an individual stock or cryptocurrency is oversold or overbought.
Using the indicator
In the column "2σ" , up arrows indicate that the asset is very overbought , down arrows indicate that an asset is very oversold , and an equals sign indicates that the indicator is neutral.
In the column "σ" , up arrows indicate that the asset is overbought , down arrows indicate that an asset is oversold , and an equals sign indicates that the indicator is neutral.
What indicator is
The indicator shows the exhaustion (percentage gap between the closing price and a moving average) at 5 given lengths, 15, 30, 50, 100, and 300. It compares that to two thresholds for exhaustion: one standard deviation out and one two standard deviations out.
Smart QQE ModSmart QQE - Chart Overlay
Smart QQE shows QQE Trend and RSI plot on chart to determine the trend direction and eliminate false signals.
QQE is obtained from original code by Glaz and rescaled to fit on chart. RSI 50 level acts as Zero which is plotted as a Bollinger on chart.
This is not a Bollinger band . its an RSI channel with levels 0-100 plotted around the mid band. The RSI Mid Band is calculated based on RSI value.
Trend:
Price above RSI Mid band is uptrend
Price below RSI Mid band is Down Trend
The Green line - Discount Zone - 0-RSI level - Oversold Zone
The Red Line - Premium Zone - 100 - RSI level - Overbought Zone
Buy / Sell signals
QQE Buy and Sell signals are plotted based on crossovers of RSI and Fast RSI crossovers.
QQE trend is colored based on the crossover.
Candle color:
candle color determines the Original QQE Trend.
Blue - QQE line above Threshold level in Buy Zone
Pink - QQE line below Threshold level in Sell Zone
Entries are to be made with proper confirmation.
HULL MA is provided as a MA Ribbon for additional confirmation. This MA can be changed to various forms Like EMA , SMA , WMA , HMA , RMA the open and close of the MA are plotted so it determines the exact Trend reversal of the price.
Credits to @Glaz QQE Threshold
