TASC 2023.10 COT Commercials Indicator█ OVERVIEW
This script implements the COT Commercials Indicator introduced by Alfred François Tagher in an article featured in TASC's October 2023 edition of Traders' Tips . The indicator is designed for use in futures markets and represents a fast stochastic (%K) calculated based on the commercial open interest values of an asset derived from the weekly Commitments Of Traders (COT) report .
█ CONCEPTS
The COT report, issued by the Commodity Futures Trading Commission (CFTC) , presents a breakdown of reportable open interest positions held by various trader groups—commercial, noncommercial, and nonreportable (small traders). Open interest reflects the total number of derivative contracts entered by market participants but not yet settled. Consequently, it can serve as a measure of market activity and liquidity.
The indicator showcased here aims to analyze changes in the reported net values of open interest for commercial traders/hedgers (often referred to as 'smart money', as they deal directly in underlying commodities). The net values are positive when the commercial traders have more long positions than short ones and negative when they hold more short positions than long ones. Positive net values indicate that commercial traders hold more long positions than short ones, while negative values indicate the opposite. Thus, overbought and oversold conditions of the COT Commercials Indicator potentially suggest collective bullish and bearish sentiments, respectively.
█ CALCULATIONS
The calculations involve these steps:
1. Net open interest values are extracted from COT data using the LibraryCOT library provided by TradingView.
2. A fast stochastic indicator (%K) is then applied to normalize these net values.
The script also provides an option of calculating and plotting the indicator curve for noncommercial (speculators) open interest.
Osciladores Centrados

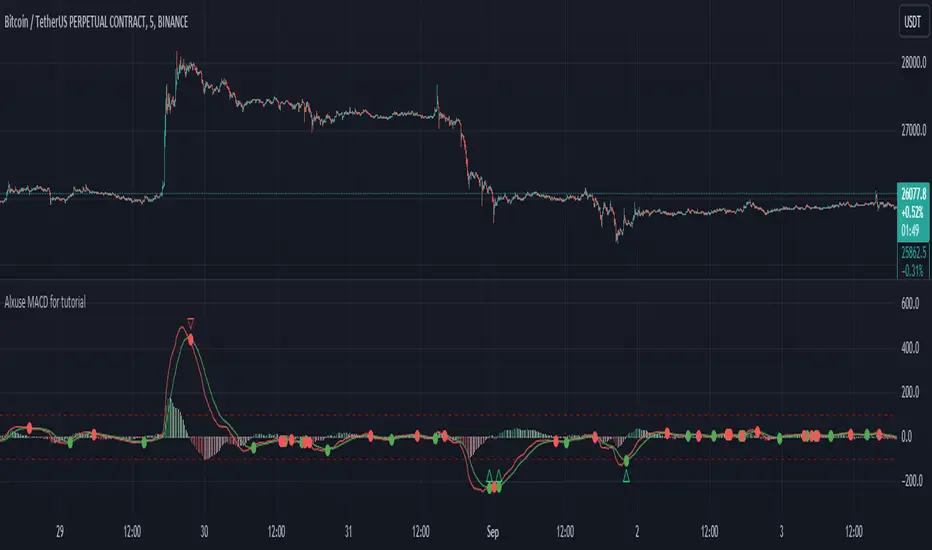
Alxuse MACD for tutorialAll abilities of MACD, moreover :
Drawing upper band and lower band & the ability to change values, change colors, turn on/off show.
Crossing MACD line and SIGNAL line in multi timeframe & there are symbols (Circles) with green color (Buy) and red color (Sell) & the ability to change colors, turn on/off show.
Crossing MACD line and SIGNAL line in multi timeframe according to the values of upper band and lower band & there are symbols (Triangles) with green color (Long) and red color (Short) & the ability to change colors, turn on/off show.
The ability used in the alert section and create customized alerts.
To receive valid alerts the replay section , the timeframe of the chart must be the same as the timeframe of the indicator.
MACD (Moving Average Convergence/Divergence)
Definition
MACD is an extremely popular indicator used in technical analysis. MACD can be used to identify aspects of a security's overall trend. Most notably these aspects are momentum, as well as trend direction and duration. What makes MACD so informative is that it is actually the combination of two different types of indicators. First, MACD employs two Moving Averages of varying lengths (which are lagging indicators) to identify trend direction and duration. Then, MACD takes the difference in values between those two Moving Averages (MACD Line) and an EMA of those Moving Averages (Signal Line) and plots that difference between the two lines as a histogram which oscillates above and below a center Zero Line. The histogram is used as a good indication of a security's momentum.
MACD Line is a result of taking a longer term EMA and subtracting it from a shorter term EMA.The most commonly used values are 26 days for the longer term EMA and 12 days for the shorter term EMA, but it is the trader's choice.
The Signal Line.
The Signal Line is an EMA of the MACD Line described in Component 1. The trader can choose what period length EMA to use for the Signal Line however 9 is the most common.
The MACD Histogram.
As time advances, the difference between the MACD Line and Signal Line will continually differ. The MACD histogram takes that difference and plots it into an easily readable histogram. The difference between the two lines oscillates around a Zero Line.
A general interpretation of MACD is that when MACD is positive and the histogram value is increasing, then upside momentum is increasing. When MACD is negative and the histogram value is decreasing, then downside momentum is increasing.
What to look for
The MACD indicator is typically good for identifying three types of basic signals; Signal Line Crossovers, Zero Line Crossovers, and Divergence.
SIGNAL LINE CROSSOVERS
A Signal Line Crossover is the most common signal produced by the MACD. First one must consider that the Signal Line is essentially an indicator of an indicator. The Signal Line is calculating the Moving Average of the MACD Line. Therefore the Signal Line lags behind the MACD line. That being said, on the occasions where the MACD Line crosses above or below the Signal Line, that can signify a potentially strong move.
The strength of the move is what determines the duration of Signal Line Crossover. Understanding and being able to analyze move strength, as well as being able to recognize false signals, is a skill that comes with experience.
The first type of Signal Line Crossover to examine is the Bullish Signal Line Crossover. Bullish Signal Line Crossovers occur when the MACD Line crosses above the Signal Line.
The second type of Signal Line Crossover to examine is the Bearish Signal Line Crossover. Bearish Signal Line Crossovers occur when the MACD Line crosses below the Signal Line.
Zero line crossovers
Zero Line Crossovers have a very similar premise to Signal Line Crossovers. Instead of crossing the Signal Line, Zero Line Crossovers occur when the MACD Line crossed the Zero Line and either becomes positive (above 0) or negative (below 0).
The first type of Zero Line Crossover to examine is the Bullish Zero Line Crossover. Bullish Zero Line Crossovers occur when the MACD Line crosses above the Zero Line and go from negative to positive.
The second type of Zero Line Crossover to examine is the Bearish Zero Line Crossover. Bearish Zero Line Crossovers occur when the MACD Line crosses below the Zero Line and go from positive to negative.
Divergence
Divergence is another signal created by the MACD. Simply put, divergence is when the MACD and actual price are not in agreement.
For example, Bullish Divergence occurs when price records a lower low, but the MACD records a higher low. The movement of price can provide evidence of the current trend, however changes in momentum as evidenced by the MACD can sometimes precede a significant reversal.
Bearish Divergence is, of course, the opposite. Bearish Divergence occurs when price records a higher high while the MACD records a lower high.
Summary
What makes the MACD such a valuable tool for technical analysis is that it is almost like two indicators in one. It can help to identify not just trends, but it can measure momentum as well. It takes two separate lagging indicators and adds the aspect of momentum which is much more active or predictive That kind of versatility is why it has been and is used by trader's and analysts across the entire spectrum of finance.
Despite MACD's obvious attributes, just like with any indicator, the trader or analyst needs to exercise caution. There are just some things that MACD doesn't do well which may tempt a trader regardless. Most notably, traders may be tempted into using MACD as a way to find overbought or oversold conditions. This is not a good idea. Remember, MACD is not bound to a range, so what is considered to be highly positive or negative for one instrument may not translate well to a different instrument.
With sufficient time and experience, almost anybody who wants to analyze chart data should be able to make good use out of the MACD.
The added features to the indicator are made for training, it is advisable to use it with caution in tradings.
Rolling VWAP OscillatorTL;DR - TradingView's Rolling VWAP as centered oscillator
I really like TradingView's rolling VWAP (Rolling Volume-Weighted Average Price - RVWAP) indicator. But I also like clean charts that's why I'm mainly using indicators which are not displayed on the chart. Instead of simply moving the RVWAP to another pane I turned it into a centered oscillator. This allows me checking the RVWAP while having my chart clean.
You can find the oroginal RVWAP here .
Creds to TradingView for creating this indicator 👍
* I also added a fourth deviation band, gradient colors and the option to switch between candles and lines.

Math NeuronThis open source script uses the mathematical rules of a classic two-input neuron with two weights and one bias(x * w1 + y*w2 + b).
The two inputs are the rsi (length 14) of close and volume, The result that we try to anticipate is the development of a pivot high or a pivot low (high or low candle are the max or min of the previous n° )
The activation function is sigmoid(binary results).

Zaree - Bull & Bear Volume VoidThe "Zaree - Bull & Bear Volume Void" (BBVV) indicator is a versatile tool designed to help traders assess the dynamics of bull and bear power in the market, with a focus on volume-based analysis. This indicator offers a range of features that aid in identifying potential shifts in market sentiment and strength.
Details of the Indicator:
Volume Void Color Settings: This indicator allows you to customize the colors used for different conditions, such as strong bull areas, slowing bull areas, strong bear areas, and slowing bear areas. These colors play a crucial role in visualizing the indicator's output.
Volume Void Settings: The BBVV indicator provides options for selecting specific volume void functions, which include "Relative Volume Comparison," "Percentage of Average Volume," "Fixed Volume Threshold," "Volatility-Adjusted Volume," "Compare to Previous Volume Bars," "Volume Percentile Rank," and "Market Session Comparison." Each function has its own criteria for evaluating volume conditions.
Void Bull Sensitivity and Void Bear Sensitivity: These are key parameters in the settings. The values you choose for void bull sensitivity and void bear sensitivity will significantly impact the background color displayed by the indicator. Properly configuring these values is crucial for the indicator's effectiveness.
Moving Average Settings: You can specify the source and length of moving averages used in the indicator. This helps in smoothing out data and providing a clearer picture of bull and bear power.
Void Color Background Conditions: The indicator dynamically changes the background color of the chart based on the current market conditions. It takes into account bull and bear power, as well as the configured sensitivity levels to determine whether the market is in a strong or slowing bull/bear phase.
MACD and Signal Lines: The indicator also displays MACD and signal lines on the chart, helping traders identify potential bullish and bearish crossovers.
Histogram Bars: Histogram bars are used to represent the strength of bull and bear power. Above-zero bars indicate bullish strength, while below-zero bars indicate bearish strength.
How to Use the Indicator:
Begin by customizing the color settings for different market conditions to your preference.
Select a volume void function that aligns with your trading strategy and objectives.
Configure the void bull sensitivity and void bear sensitivity values carefully. These values should reflect your desired sensitivity to volume conditions.
Choose the source and length of moving averages based on your analysis requirements.
Pay attention to the background color of the chart. It will change dynamically based on the current market conditions, providing insights into the strength of bull and bear power.
Observe the MACD and signal lines for potential bullish or bearish crossovers, which can be used as additional confirmation signals.
Interpret the histogram bars to gauge the strength of bull and bear power.
Example of Usage:
As a swing trader with a focus on volume analysis, you can use the BBVV indicator to enhance your trading decisions. Here's an example of how you might use the indicator:
Select "Relative Volume Comparison" as the volume void function to assess volume relative to a simple moving average.
Configure void bull sensitivity and void bear sensitivity to match your risk tolerance and trading style.
Choose "SMA" as the moving average type with a suitable length.
Pay attention to the background color changes in the chart. Strong bull areas may indicate potential bullish opportunities, while strong bear areas may signal bearish conditions.
Monitor the MACD and signal lines for potential crossovers, aligning them with the background color to validate your trading decisions.
Use the histogram bars to assess the strength of bull and bear power, helping you gauge market sentiment.
Remember that the BBVV indicator is a valuable tool to complement your trading strategy. It provides insights into volume dynamics and market conditions, allowing you to make informed trading choices.
Be sure to adjust the indicator settings according to your trading preferences and always consider the broader market context in your analysis.

Volatility Adjusted MACDMACD, short for moving average convergence/divergence, is a trading indicator used in technical analysis of securities prices, created by Gerald Appel in the late 1970s. It is designed to reveal changes in the strength, direction, momentum, and duration of a trend in a stock's price.
The MACD indicator (or "oscillator") is a collection of three time series calculated from historical price data, most often the closing price. These three series are: the MACD series proper, the "signal" or "average" series, and the "divergence" series which is the difference between the two. The MACD series is the difference between a "fast" (short period) exponential moving average (EMA), and a "slow" (longer period) EMA of the price series. The average series is an EMA of the MACD series itself.
This version of MACD follows the work of Alex Spiroglou, DipTA(ATAA), CFTe in his 2022 paper that was awarded Charles H. Dow Award by CMT Association . The paper is available on papers.ssrn.com or on website.of CMT Association.
Please refer to the paper for details on construction and trading rules . I personally find the volatility adjusted version as described in this paper more responsive in terms of signals and divergences.
Composite Momentum IndicatorComposite Momentum Indicator" combines the signals from several oscillators, including Stochastic, RSI, Ultimate Oscillator, and Commodity Channel Index (CCI) by averaging the standardized values (Z-Scores). Since it is a Z-Score based indicators the values will be typically be bound between +3 and -3 oscillating around 0. Here's a summary of the code:
Input Parameters: Users can customize the look-back period and set threshold values for overbought and oversold conditions. They can also choose which oscillators to include in the composite calculation.
Oscillator Calculations: The code calculates four separate oscillators - Stochastic, RSI, Ultimate Oscillator, and CCI - each measuring different aspects of market momentum.
Z-Scores Calculation: For each oscillator, the code calculates a Z-Score, which normalizes the oscillator's values based on its historical standard deviation and mean. This allows for a consistent comparison of oscillator values across different timeframes.
Composite Z-Score: The code aggregates the Z-Scores from the selected oscillators, taking into account user preferences (whether to include each oscillator). It then calculates an average Z-Score to create the "Composite Momentum Oscillator."
Conditional Color Coding: The composite oscillator is color-coded based on its average Z-Score value. It turns green when it's above the overbought threshold, red when it's below the oversold threshold, and blue when it's within the specified range.
Horizontal Lines: The code plots horizontal lines at key levels, including 0, ±3, ±2, and ±1, to help users identify important momentum levels.
Gradient Fills: It adds gradient fills above the overbought threshold and below the oversold threshold to visually highlight extreme momentum conditions.
Combining the Stochastic, RSI, Ultimate Oscillator, and Commodity Channel Index (CCI) into one composite indicator offers several advantages for traders and technical analysts:
Comprehensive Insight: Each of these oscillators measures different aspects of market momentum and price action. Combining them into one indicator provides a more comprehensive view of the market's behavior, as it takes into account various dimensions of momentum simultaneously.
Reduced Noise: Standalone oscillators can generate conflicting signals and produce noisy readings, especially during choppy market conditions. A composite indicator smoothes out these discrepancies by averaging the signals from multiple indicators, potentially reducing false signals.
Confirmation and Divergence: By combining multiple oscillators, traders can seek confirmation or divergence signals. When multiple oscillators align in the same direction, it can strengthen a trading signal. Conversely, divergence between the oscillators can warn of potential reversals or weakening trends.
Customization: Traders can tailor the composite indicator to their specific trading strategies and preferences. They have the flexibility to include or exclude specific oscillators, adjust look-back periods, and set threshold levels. This adaptability allows for a more personalized approach to technical analysis.
Clarity and Efficiency: Rather than cluttering the chart with multiple individual oscillators, a composite indicator condenses the information into a single plot. This enhances the clarity of the chart and makes it easier for traders to quickly interpret market conditions.
Overbought/Oversold Identification: Combining these oscillators can improve the identification of overbought and oversold conditions. It reduces the likelihood of false signals since multiple indicators must align to trigger these extreme conditions.
Educational Tool: For novice traders and analysts, a composite indicator can serve as an educational tool by demonstrating how different oscillators interact and influence each other's signals. It allows users to learn about multiple technical indicators in one glance.
Efficient Use of Screen Space: A single composite indicator occupies less screen space compared to multiple separate indicators. This is especially beneficial when analyzing multiple markets or timeframes simultaneously.
Holistic Approach: Instead of relying on a single indicator, a composite approach encourages a more holistic assessment of market conditions. Traders can consider a broader range of factors before making trading decisions.
Increased Confidence: A composite indicator can boost traders' confidence in their decisions. When multiple reliable indicators align, it can provide a stronger basis for taking action in the market.
In summary, combining the Stochastic, RSI, Ultimate Oscillator, and CCI into one composite indicator enhances the depth and reliability of technical analysis. It simplifies the decision-making process, reduces noise, and offers a more complete picture of market momentum, ultimately helping traders make more informed and well-rounded trading decisions.
* Feel free to compare against individual oscillatiors*

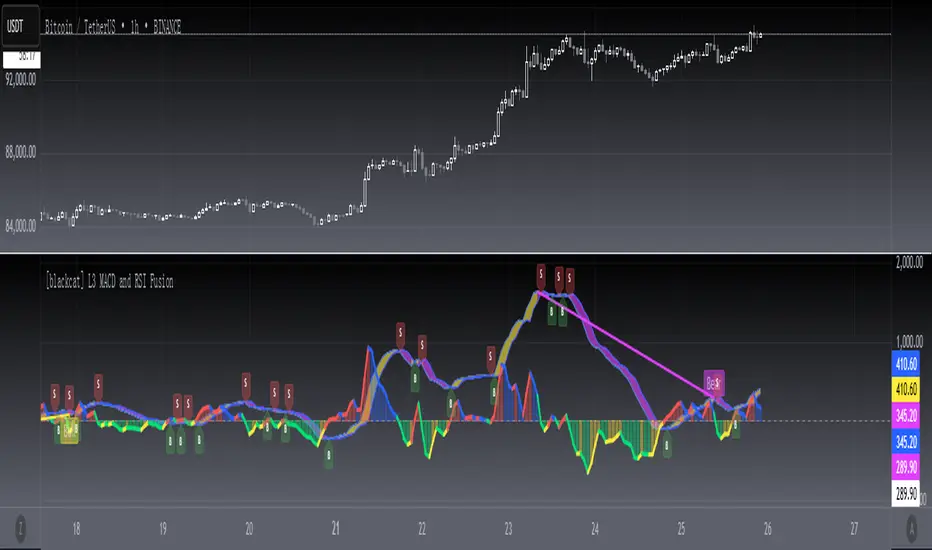
[blackcat] L3 MACD and RSI Fusion The MACD and RSI fusion is a popular technical analysis strategy used by traders to identify buy and sell signals in the market. The strategy makes use of two popular technical indicators, the Moving Average Convergence Divergence (MACD) and the Relative Strength Index (RSI), and combines them to create a powerful trading signal.
The MACD and RSI fusion was originally developed for the Chinese stock market and is commonly used by traders all over the world. The strategy is based on the idea that the MACD and RSI indicators can be used together to provide a more accurate and reliable signal.
To use the MACD and RSI fusion , traders need to follow a few simple steps. The following code is the TradingView Pine script v4 indicator equivalent of the original MACD and RSI fusion code:
```
//@version=4
study(" MACD and RSI fusion ", overlay=false)
// Define the simple fusion indicator
simple_fusion = (ema(close, 12) - ema(close, 26)) * 1.2 + rsi(close, 14) / 50
// Define the simple fusion lag indicator
simple_fusion_lag = nz(simple_fusion )
// Plot the simple fusion and simple fusion lag indicators
plot(simple_fusion, color=color.blue, title="simple fusion")
plot(simple_fusion_lag, color=color.red, title="simple fusion Lag")
```
This code defines the simple fusion and simple fusion Lag indicators and plots them on the chart. The simple fusion indicator is the sum of the 12- and 26-period exponential moving averages of the closing price, multiplied by 1.2, and added to the 14-period relative strength index of the closing price, divided by 50. The simple fusion Lag indicator is the value of the simple fusion indicator from the previous period.
Traders can use the simple fusion and simple fusion Lag indicators to identify buy and sell signals. When the simple fusion indicator crosses above the simple fusion Lag indicator, it is a buy signal, and when the simple fusion indicator crosses below the simple fusion Lag indicator, it is a sell signal.
In conclusion, the MACD and RSI fusion is a simple but powerful technical analysis strategy that combines two popular technical indicators to identify buy and sell signals in the market.
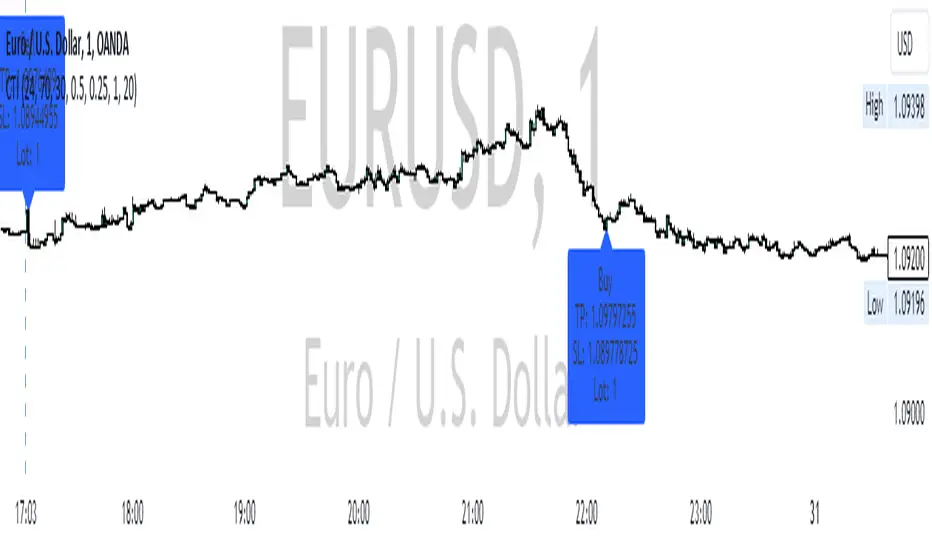
CCI RSI Trading SignalThe "CCI RSI Trading Signal" indicator combines the Commodity Channel Index (CCI) and Relative Strength Index (RSI) to provide buy and sell signals for trading. The CCI identifies potential trend reversals, while the RSI helps confirm overbought and oversold conditions.
How It Works:
The indicator generates a buy signal when the CCI crosses above -100 (indicating a potential bullish reversal) and the RSI is below the specified oversold level. On the other hand, a sell signal is produced when the CCI crosses below 100 (indicating a potential bearish reversal) and the RSI is above the specified overbought level.
Customization:
Traders can adjust the RSI and CCI periods, RSI oversold and overbought levels, as well as take profit, stop loss, and lot size settings to suit their trading preferences.
Usage:
The "CCI RSI Trading Signal" indicator can be used on various timeframes and markets to aid in decision-making, providing potential entry and exit points based on the combined analysis of CCI and RSI.
Linear RegressionThis indicator can be used to determine the direction of the current trend.
The indicator plots two different histograms based on the linear regression formula:
- The colored ones represent the direction of the short-term trend
- The gray one represents the direction of the long-term trend
In the settings, you can change the length of the short-term value, which also influences the long-term as a basis that will be multiplied

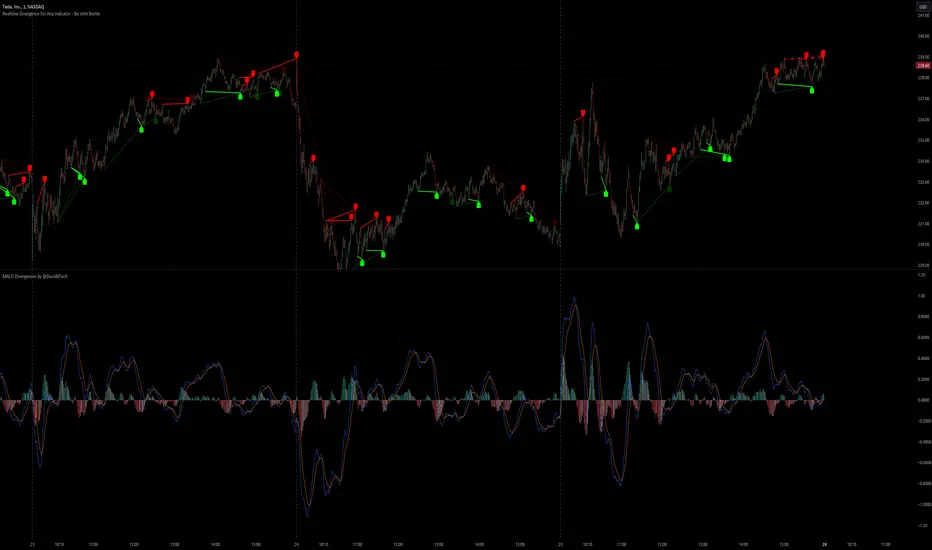
Realtime Divergence for Any Indicator - By John BartleThe main purpose of this script is to show historical and real-time divergences for any oscillating indicator. The secondary purpose is to give the user a lot of precise control over identifying divergences and determining what they are. This is an improved version of my other script which is similarly called "Realtime Divergence for Any Indicator"
There are four types of divergences that are offered:
Bull divergence
Hidden bull divergence
Bear divergence
Hidden Bear divergence
There are three types of potential(real-time) divergences which include:
1) Without right side bars for rightside pivots. Plus without waiting for the rightside pivot bar to complete
2) Without right side bars for rightside pivots. Plus with waiting for the rightside pivot bar to complete
3) With right side bars for rightside pivots. Plus without waiting for the rightside pivot right-most bar to complete
A definite divergence occurs when all specified bars are accounted for and fully formed.
Potential divergences use dashed lines and definite(historical) divergences use solid lines.
In addition to several other categories of settings to filter out unwanted divergences or manipulate the search process, this script also offers Alerts. Remember that alerts must not only be set within this scripts settings but also your "Alerts" panel on your right. It's strange but BOTH must be set for alerts to work...
Other interesting Things To Know:
1)I actually don't trade and so I have no need of a paid account. Unpaid accounts don't have the playback feature so I haven't really tested this script out very well. Sorry. Just let me know if something seems off and IF I have time I'll try to fix it.
2)Keep in mind that Pinescript limits the number of lines that can be shown at one time. This means that if your settings allow for a large number of divergence lines they will be removed from the leftward side of your chart but appear in the rightward side.
3) The time and the values for the price or oscillator are not the same things as each other nor are they physical things with physical space. This means that slopes of lines using the time as X and value as Y can not have definite angles. Consequently, under the setting "DIVERGENCES: SLOPE ANGLE EXCLUSION" YOU have to decide what slope equals what angle by using the setting called "Normalization Factor".
4) Remember that some individual settings apply to both the oscillator and price chart. This means that even if the setting's conditions are fulfilled in one they may not be fulfilled in the other.
5) Under the category "DIVERGENCES: INTERSECTION ALLOWANCE", if you set the "Measurement Type" to Relative Percentage then FYI any single given length will equate to an increasingly smaller percentage the further away from zero it is. Because of this, I think "Reletive Percentage" is probably only useful for price charts or oscillators with big values. Maybe >200 is OK ?
Errors:
1) If you get the error mentioning that the script must complete execution within X amount of time, this is because this is a big script and sometimes takes longer than your service plan's allotted time limit. You can just disable some of the settings to reduce the scripts amount of work and time. The biggest time savers will be to disable some lines and labels
2) If you get an error saying the script accessed a negative index(e.g. ) then try temporarily increasing the "Add More Array Elements" setting to 100-200. Sometimes it fixes the problem.
3) You may sometimes temporarily get an error that reads: "Pine cannot determine the referencing length of a series. Try using max_bars_back in the study or strategy function".
If this happens there are several things that you can do:
3A) Create a copy of my script. Then edit the section of code that looks like this ")//, max_bars_back = INSERT_YOUR_QUANTITY_HERE)" and transform it to look like this new code ", max_bars_back = INSERT_YOUR_QUANTITY_HERE)" then repeatedly try replacing "INSERT_YOUR_QUANTITY_HERE" with an increasingly larger number greater than 244 but less than 5000.
This method will increase your system resources and could cause other problems. Try changing the code back after a few hours and see if all is well again. It is a Pinescript limitation issue and happens when certain functions or variables don't get used at least once within the first 244 bars.
3B) Adjust your settings to hopefully find a divergence within the first 244 bars. If one is found then the problematic variables or functions should get used and the Pinescript 244 bar limitation should be temporarily resolved.
3C) Wait for X number of new bars to occur. If a divergence is eventually found within the first 244 bars that should solve the issue.
Tips:
1) If the amount that a setting changes value is undesirable for each time you click it then you can change that amount in the code. To do that, you'll need your own copy of my script. To make your own copy just click on "create a working copy" in the brown colored strip area above the code. Then within approximately the first 108 lines find the title of the setting you want to change. Then look to it's right to find the parameter called "step =". Change what the step equals to whatever you want. FYI, you can hover your mouse over the blue colored code and a popup will tell you what parameters(i.e. settings) that function(e.g. "input.int()") has available.
Coppock Curve w/ Early Turns [QuantVue]The Coppock Curve is a momentum oscillator developed by Edwin Coppock in 1962. The curve is calculated using a combination of the rate of change (ROC) for two distinct periods, which are then subjected to a weighted moving average (WMA).
History of the Coppock Curve:
The Coppock Curve was originally designed for use on a monthly time frame to identify buying opportunities in stock market indices, primarily after significant declines or bear markets.
Historically, the monthly time frame has been the most popular for the Coppock Curve, especially for long-term trend analysis and spotting the beginnings of potential bull markets after bearish periods.
The signal wasn't initially designed for finding sell signals, however it can be used to look for tops as well.
When the indicator is above zero it indicates a hold. When the indicator drops below zero it indicates a sell, and when the indicator moves above zero it signals a buy.
While this indicator was originally designed to be used on monthly charts of the indices, many traders now use this on individual equities and etfs on all different time frames.
About this Indicator:
The Coppock Curve is plotted with colors changing based on its position relative to the zero line. When above zero, it's green, and when below, it's red. (default settings)
An absolute zero line is also plotted in black to serve as a reference.
In addition to the classic Coppock Curve, this indicator looks to identify "early turns" or potential reversals of the Coppock Curve rather than waiting for the indicator to cross above or below the zero line.
Give this indicator a BOOST and COMMENT your thoughts!
We hope you enjoy.
Cheers!

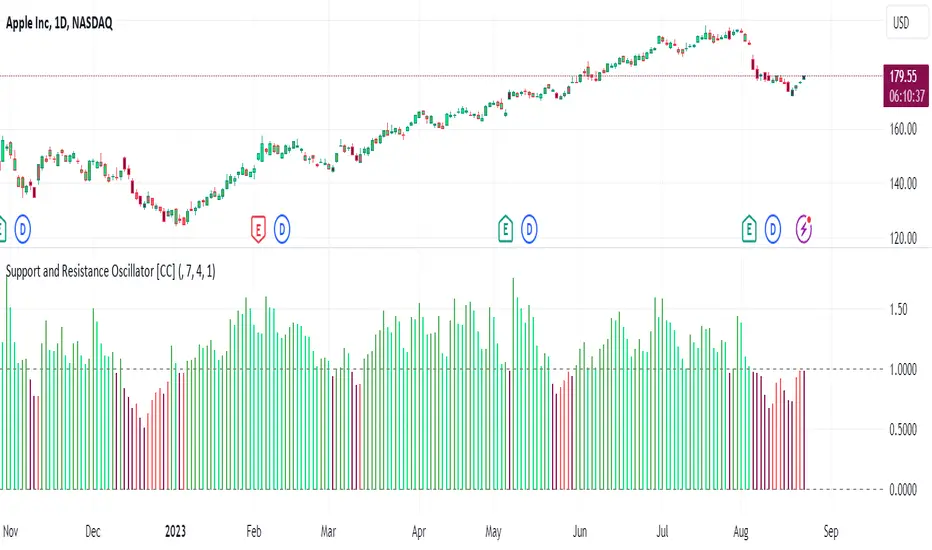
Support and Resistance Oscillator [CC]The Support and Resistance Oscillator is an experimental script I created to identify when the current price breaks a support or resistance line and reflect this value in an oscillator formula. This indicator uses a threshold to decide the dividing line between buying and selling points. Feel free to change the threshold or smoothing settings to see if you find anything better since this is so experimental. I'm double smoothing the difference between the indicator and its signal line to attempt to capture a combo of the price momentum combined with the general support and resistance levels. I have used dark colors for strong signals and lighter colors for normal signals and make sure to buy when the line turns green and sell when it turns red.
Let me know if there are any other scripts or indicators you would like to see me publish!
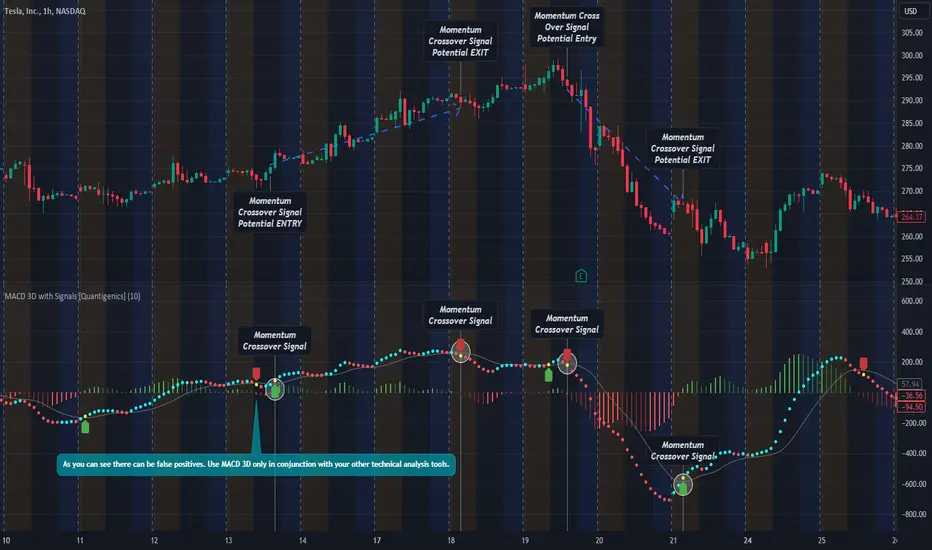
MACD 3D with Signals [Quantigenics]Quantigenics MACD 3D with Buy Sell Signals is a MACD-based trading indicator that aims to identify market trends and potential turning points, for Buy/Sell opportunities, by leveraging price data and volatility.
Unlike the traditional MACD indicator, the average price is calculated from the high, low, and close prices, from which a specialized MACD value is derived. This MACD value, combined with an average and standard deviation, takes into account volatility, and is used to generate an upper and lower boundary.
The indicator color-codes market trends: aqua indicates upward trends (signifying increased buying pressure), red suggests downward trends (increased selling pressure). When the MACD value crosses above the upper boundary or falls below the lower boundary, the color changes to yellow indicating a possible reversal point and "Momentum Crossover Signals" can be plotted at this point. "Standard Signal" arrows can also plotted when the MACD 3D changes from auqa to red and vice-versa.
A trendline is drawn at the median value, providing a baseline for comparison. A differential value, which measures the distance between the MACD value and the median line, provides additional insight into the price's deviation from this baseline (divergences from the underlying price can be spotted using this data as well). The differential is color-coded: green when MACD is above the median, and red when it's below, with darker shades representing a decreasing gap.
Alerts can be set to trigger with the "Standard Signal" arrows appearing after MACD 3D changes from auqa to red and vice-versa and when the "Momentum Crossover Signal" arrows appear when the MACD value crosses above the upper boundary or falls below the lower boundary indicating a potential reversal. Providing immediate notifications which can be especially helpful in larger time frames where it may take time for a trade setup to develop.
CME_MINI:NQ1!
OANDA:XAUUSD
Enjoy the MACD 3D indicator. Happy Trading!
Velocity Acceleration Convergence Divergence Indicator [CC]I created the Velocity Acceleration Convergence Divergence Indicator, and it is quite a mouthful if I do say so. I based this script on my two previous scripts: Velocity Indicator and Velocity Acceleration Indicator . This acts like a typical MACD but is much faster with the responses. This indicator is created by finding the difference between the Velocity Indicator and Velocity Acceleration Indicator to determine the overall trend strength of the underlying stock. Like the other scripts, I coded the general buy and sell signals the same, so you would want to buy when the indicator crosses over above the zero midline and sell when it crosses below the zero midline. I have also used the same colors, so darker colors for strong signals and lighter colors for normal signals.
Please let me know if you would like me to publish another script or if you want something custom done!

Velocity Acceleration Indicator [CC]The Velocity Acceleration Indicator was created by Scott Cong (Stocks and Commodities Sep 2023, pgs 8-15). This is another personal variation of his formula designed to capture the overall velocity acceleration of the underlying stock by applying the velocity formula to the original indicator to find the acceleration of the underlying velocity. I changed a few things around and managed actually to get less lag and quicker signals for this version, so make sure you compare the Velocity Indicator script that I published yesterday. This indicator is also visually similar to a typical stochastic indicator but uses a different underlying calculation. This works well as a momentum indicator, and the values are completely unbounded, so the best ways to determine bullish or bearish trends is either by using a crossover or crossunder between the indicator and the midline or to buy or sell the indicator when it reaches a high or low point and starts to fall or rise respectively. I used the zero line for my default version to help determine the bullish or bearish trends. I have also included multiple colors to differentiate between very strong signals and normal signals, so very strong signals are darker in color, and normal signals use lighter colors. Buy when the line turns green and sell when it turns red.
Let me know if there are any other indicators or scripts you would like to see me publish! I will have some more new scripts in the next week or so.

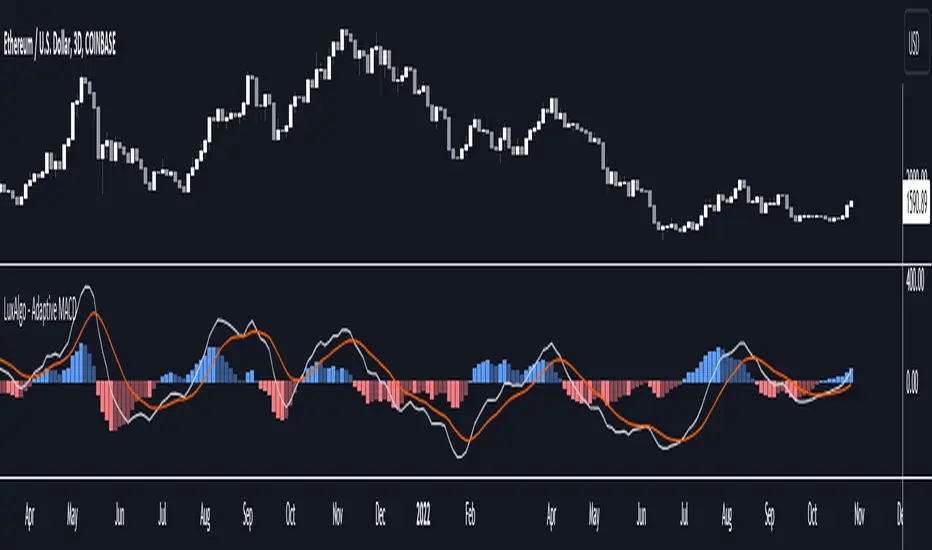
Adaptive MACD [LuxAlgo]The Adaptive MACD indicator is an adaptive version of the popular Moving Average Convergence Divergence (MACD) oscillator, returning longer-term variations during trending markets and cyclic variations during ranging markets while filtering out noisy variations.
🔶 USAGE
The proposed oscillator contains all the elements within a regular MACD, such as a signal line and histogram. A MACD value above 0 would indicate up-trending variations, while a value under 0 would be indicating down-trending variations.
Just like most oscillators, our proposed Adaptive MACD is able to return divergences with the price.
As we can see in the image above ranging markets will make the Adaptive MACD more conservative toward more cyclical conservations, filtering out both noise and longer-term variations. However, when longer-term variations (such as in a trending market) are prominent the oscillator will conserve longer-term variations.
The R2 Period setting determines when trending/ranging markets are detected, with higher values returning indications for longer intervals.
The fast and slow settings will act similarly to the regular MACD, however, closer values will return more cyclical outputs.
The image above compares our proposed MACD (top) with a regular MACD (bottom), both using fast = 19 and slow = 20 .
🔶 DETAILS
It is common to be solely interested in the trend component when the market is trending, however, during a ranging market it is more common to observe a more prominent cyclical/noise component. We want to be able to preserve one of the components at the appropriate market conditions, however, the regular MACD lack the ability to preserve cyclical component with high accuracy.
The MACD is an IIR bandpass filter. In order to obtain a lower passband bandwidth and a more symmetrical magnitude response (which would allow to conserve more precise cyclical variations) we can directly change the system calculation:
y = (price - price ) × g + ((1 - a1) + (1 - a2)) × y - (1 - a1) × (1 - a2) × y
where:
a1 = 2/(fast + 1)
a2 = 2/(slow + 1)
g = a1 - a2
Using division instead of multiplication on the second feedback weight allows further weighting the 2 samples lagged output, returning a more desirable magnitude response with a higher degree of filtering on both ends of the spectrum as shown in the image below:
We are interested in conserving cycles during ranging markets, and longer-term variations during trending markets, we can do this by interpolating between our two filter coefficients:
α × + (1 - α) ×
where 1 > α > 0 . α is measuring if the market is trending or ranging, with values closer to 1 indicating a trending market. We see that for higher values of α the original coefficient of the MACD is used. The image below shows various magnitude responses given multiple values of α :
We use a rolling R-Squared as α , this measurement has the benefit of indicating if the market is trending or ranging, as well as being constrained within range (0, 1), and having a U-shaped distribution.
If you are interested to learn more about the MACD see:
🔶 SETTINGS
R2 Period: Calculation window of the R-Squared.
Fast: Fast period for the calculation of the Adaptive MACD, lower values will return more noisy results.
Slow: Slow period for the calculation of the Adaptive MACD, higher values will return result with longer-term conserved variations.
Signal: Period of the EMA applied to the Adaptive MACD.
Velocity Indicator [CC]The Velocity Indicator was created by Scott Cong (Stocks and Commodities Sep 2023, pgs 8-15). This is my variation of his formula designed to capture the overall velocity of the underlying stock by applying the typical velocity formula. This indicator is visually similar to a typical stochastic indicator but uses a different underlying calculation. This works well as a momentum indicator, and the values are completely unbounded, so the best ways to determine bullish or bearish trends is either by using a crossover or crossunder between the indicator and the midline or to buy or sell the indicator when it reaches a high or low point and starts to fall or rise respectively. For my default version, I used the zero line to help determine the bullish or bearish trends. I have also included multiple colors to differentiate between very strong signals and normal signals, so very strong signals are darker in color, and normal signals use lighter colors. Buy when the line turns green and sell when it turns red.
Let me know if there are any other indicators or scripts you would like to see me publish! I will have some more new scripts in the next week or so.

MACD Bands - Multi Timeframe [TradeMaster Lite]We present a customizable MACD indicator, with the following features:
Multi-timeframe
Deviation bands to spot unusual volatility
9 Moving Average types
Conditional coloring and line crossings
👉 What is MACD?
MACD is a classic, trend-following indicator that uses moving averages to identify changes in momentum. It can be used to identify trend changes, overbought and oversold conditions, and potential reversals.
👉 Multi-timeframe:
This feature allows to analyze the same market data on multiple time frames, which can be in help to identify trends and patterns that would not be visible on a single time frame. When using the multi-timeframe feature, it is important to start with the higher time frame and then look for confirmation on the lower time frames. This will help you to avoid false signals. Please note that only timeframes higher than the chart timeframe is supported currently with this feature enabled. Might get updated in the future.
👉 Deviation bands to spot unusual volatility:
Deviation bands are plotted around the Signal line that can be in help to identify periods of unusual volatility. When the MACD line crosses outside of the deviation bands, it suggests that the market is becoming more volatile and a strong trend may form in that direction.
👉 9 Moving Average types can be used in the script. Each type of moving average offers a unique perspective and can be used in different scenarios to identify market trends.
SMA (Simple Moving Average): This calculates the average of a selected range of values, by the number of periods in that range.
SMMA (Smoothed Moving Average): This takes into account all data available and assigns equal weighting to the values.
EMA (Exponential Moving Average): This places a greater weight and significance on the most recent data points.
DEMA (Double Exponential Moving Average): This is a faster-moving average that uses a proprietary calculation to reduce the lag in data points.
TEMA (Triple Exponential Moving Average): This is even quicker than the DEMA, helping traders respond more quickly to changes in trend.
LSMA (Least Squares Moving Average): This moving average applies least squares regression method to determine the future direction of the trend.
HMA (Hull Moving Average): This moving average is designed to reduce lag and improve smoothness, providing quicker signals for short-term market movements.
VWMA (Volume Weighted Moving Average): This assigns more weight to candles with a high volume, reflecting the true average values more accurately in high volume periods.
WMA (Weighted Moving Average): This assigns more weight to the latest data, but not as much as the EMA.
👉 Conditional coloring :
This feature colors the MACD line line based on it's direction and fills the area between the MACD line and Deviation band edges to highlight the potential volatility and the strength of the momentum. This can be useful to identify when the market is trending strongly and when it is in a more neutral or choppy state.
👉 MACD Line - Signal Line crossings:
This is a classic MACD trading signal that occurs when the MACD line crosses above or below the signal line. Crossovers can be used to identify potential trend reversals. This can be a bullish or bearish signal, depending on the direction of the crossover.
👉 General advice
Confirming Signals with other indicators:
As with all technical indicators, it is important to confirm potential signals with other analytical tools, such as support and resistance levels, as well as indicators like RSI, MACD, and volume. This helps increase the probability of a successful trade.
Use proper risk management:
When using this or any other indicator, it is crucial to have proper risk management in place. Consider implementing stop-loss levels and thoughtful position sizing.
Combining with other technical indicators:
The indicator can be effectively used alongside other technical indicators to create a comprehensive trading strategy and provide additional confirmation.
Keep in Mind:
Thorough research and backtesting are essential before making any trading decisions. Furthermore, it's crucial to have a solid understanding of the indicator and its behavior. Additionally, incorporating fundamental analysis and considering market sentiment can be vital factors to take into account in your trading approach.
Limitations:
This is a lagging indicator. Please note that the indicator is using moving averages, which are lagging indicators.
The indicators within the TradeMaster Lite package aim for simplicity and efficiency, while retaining their original purpose and value. Some settings, functions or visuals may be simpler than expected.
⭐ Conclusion
We hold the view that the true path to success is the synergy between the trader and the tool, contrary to the common belief that the tool itself is the sole determinant of profitability. The actual scenario is more nuanced than such an oversimplification. Our aim is to offer useful features that meet the needs of the 21st century and that we actually use.
🛑 Risk Notice:
Everything provided by trademasterindicator – from scripts, tools, and articles to educational materials – is intended solely for educational and informational purposes. Past performance does not assure future returns.

MarketSmith Daily Market IndicatorsMarketSmith Daily Market Indicators is designed to mimic the Daily Market Indicators tab found in MarketSmith. This tab contains 4 different secondary indicators to help gauge the health of the overall market.
This indicator allows you to choose which of the 4 indicators to show, as well as which index to pull data from, Nasdaq or NYSE. There is also a snapshot table showing the following:
# of stock advancing and up volume
# of stocks declining and down volume
# of stock unchanged and unchanged volume
# of stocks making new highs and new lows
Now let's look at the 4 indicators and how they work.
Advance/Decline Line
Plots the number of advancing shares vs the number of declining shares. Heavily weighted index stocks can skew price action, this line helps reveal that and whether most stocks are aligned with the trend.
Short Term Overbought/Oversold Oscillator
A 10-day moving average of the number of stocks moving up in price less the number of stocks moving down in price.
10 Day Moving Average of Up & Down Volume
Two 10 day moving averages to represent the volume of all stocks. Blue line: total volume of all stocks moving up in price. Red line: the total volume of all stocks moving down in price.
10 Day Moving Average of New Highs & New Lows
Two 10-day moving average to represent stocks making new highs and new lows. Blue line: The number of stocks making new price highs. Red line: The number of stocks reaching new lows.
Note this indicator is designed to work on a daily time frame chart. Data typically updates 90 minutes after the close. Data may differ from Marketsmith due to different providers, however the general trends are the same.

Trig-Log Scaled Momentum OscillatorTaylor Series Approximations for Trigonometry:
1. The indicator starts by calculating sine and cosine values of the close price using Taylor Series approximations. These approximations use polynomial terms to estimate the values of these trigonometric functions.
Mathematical Component Formation:
2. The calculated sine and cosine values are then multiplied together. This gives us the primary mathematical component, termed as the 'trigComponent'.
Smoothing Process:
3. To ensure that our indicator is less susceptible to market noise and more reactive to genuine price movements, this 'trigComponent' undergoes a smoothing process using a simple moving average (SMA). The length of this SMA is defined by the user.
Logarithmic Transformation:
4. With our smoothed value, we apply a natural logarithm approximation. Again, this approximation is based on the Taylor expansion. This step ensures that all resultant values are positive and offers a different scale to interpret the smoothed component.
Dynamic Scaling:
5. To make our indicator more readable and comparable over different periods, the logarithmically transformed values are scaled between a range. This range is determined by the highest and lowest values of the transformed component over the user-defined 'lookback' period.
ROC (Rate of Change) Direction:
6. The direction of change in our scaled value is determined. This offers a quick insight into whether our mathematical component is increasing or decreasing compared to the previous value.
Visualization:
7. Finally, the indicator plots the dynamically scaled and smoothed mathematical component on the chart. The color of the plotted line depends on its direction (increasing or decreasing) and its boundary values.

TaLib RSI (ta-lib uses SMA)If you've ever been confused because Ta-Lib RSI differs from TradingView's RSI...
Look no further than here which instead of using the Rolling Moving Average, will instead use the Simple Moving Average

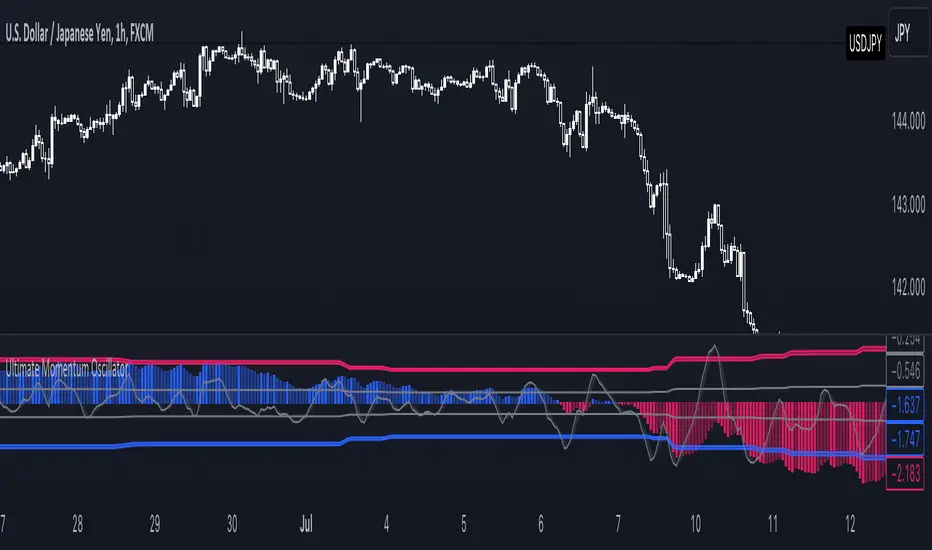
Ultimate Momentum OscillatorThe Ultimate Momentum Oscillator is a tool designed to help traders identify the current trend direction and the momentum of the prices.
This oscillator is composed of one histogram and one line, paired with the two overbought and the two oversold levels.
The histogram is a trend-based algorithm that allows the user to read the market bias with multiple trend lengths combined.
The line is a momentum-based formula that allows traders to identify potential reversal and the speed of the price.
This tool can be used to:
- Identify the current trend direction
- Identify the momentum of the price
- Identify oversold and overbought levels