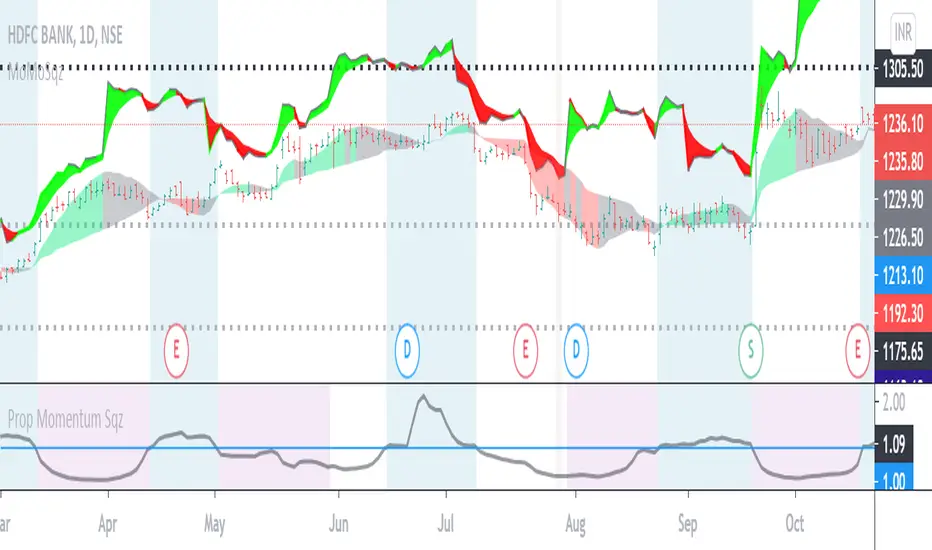
Horcrux OscilatorDoes your oscilator give exit signal on time? Mine does. However worst the idea is, I had to come up with a horcrux plan :P
Concept is as below:
I use 7 standard deviation Bollinger bands to identify which level current price is in. Standard deviations used are from 0.5 (lowest level) to 3.5(highest level) with 0.5 step . This creates overall 16 levels ranging from 0 to 15 with 0 being the highest level and 15 being the lowest.
LookbackPeriod is used to calculate max and min values of these threshold over certain bars. Average of max and min constitutes threshold.
Horcrux value is difference between max state and current state in LookbackPeriod.
Lower the horcrux much closer the current state to the highest state. Hence, horcrux higher than threshold is considered as green region where prices are moving up. Decrease in number of horcruxes means price state moving closer to highest state (which is the lower level). Hence, indicates reduced momentum or reversal.
Use higher LookbackPeriod for increased accuracy. Increase BBLength for long term trades. Adjustment is used to adjust threshold line by up to + or - 20%
Bandas de Bollinger (BB)

Bollinger Bands Width with Squeeze AlertThis is the standard Bollinger Bands Width (BBW) indicator with the added capability of detecting the "Bollinger Bands Squeeze" as defined by John Bollinger:
The BBW squeeze happens when BBW < all BBWs of the past 125 intervals.
Whenever a BBW squeeze occurs, this means there is low volatility.
A low volatility period is almost always followed by high volatility: a large breakout (with price performing ample movement and exiting the BBW bands) may suddenly occur.
The breakout may be preceded by a fakeout, during which price moves in the opposite direction.
Bollinger %B Candles StrategyStrategy built based on earlier published indicator:
Looks to be doing good for short term swing trades. But, I am not sure if there is repainting. I tried to avoid buy/sell trades on same day - but wasn't successful.
So far back-tested on following:
COINBASE:BTCUSD - works on both long and short
CURRENCYCOM:GOLD and equities - long only.
Some of the failures: ASX:WPL , ASX:WHC , ASX:NHC
As usual for back-testing - using 1000 as initial capital with 100% invested on each trade and no compounding so that it will be easy to compare with buy and hold. Trade with caution :)

Bollinger %B CandlesCandlesticks made from Bollinger %B of high, low, open and close.
Input parameters are explained below:
BBLength : Bollinger band periods. Standard deviation is hardcoded as percent B scale does not change with standard deviation.
UseMovingAverage : Candles are formed on moving average of Bollinger Percent B instead of absolute values.
Moving Average Type : Type of moving average to apply on Bollinger %B values
Lookback Period : Moving Average periods.
ColorByPreviousClose : Color candles based on previous close.
Bollinger Bands Width %bAs the bottom reading of BBW changes dynamically with bull market progression, a relative bottom is preferred than absolute, hence normalization of BB Width via bollinger bands and %b, i.e. distance of datapoints from stdev band.

Multi Time Frame Bollinger Bands(Daily/4H/1H)/MTFボリンジャーバンドJapanese below. / 日本語説明は下記
-----Republishing after issues resolved.---------
Summary
This indicator shows 3 multi time frame Bollinger bands (MTF BB) from different time frames which is daily, 4 hour and 1 hour to lower time frames with 3 bands(+-1-3ς).
Example: If you set daily BB, it will be shown on daily, 4hour, 1hour, 30M, 15M, 5M and 1M charts. It will not appear on weekly and monthly charts as it is not necessary to see it on higher time frames.
Purpose
This indicator has been developed to show higher timeframe’s BB as they are expected to work as support and resistance .
How is it different from other BB indicators?
Problems with other conventional BB indicators are;
-If you set higher timeframe BB(MTF BB), it will also be shown on further higher time frames.
i.e. If you set 4hour chart BB on 1 hour or lower time frame charts, it will also appear on daily and weekly chart, which is not necessary.
-One indicator displays one BB only which impacts the number of indicators that you can set(depending on your account plan)
-One indicator displays one band only. If you need 1-3ς, you need to add the same BB indicator.
To tackle these problems, this indicator has incorporated functions below.
-Control timeframes where BB is displayed to eliminate unnecessary information on higher time frames.
-One indicator contains 3 BB with 3 bands(minus 1-3ς & plus 1-3ς) which contributes to save the number of indicators that you can set.
These are the value added on this indicator.
Spec
-This indicator shows daily BB, 4 hour BB and 1 hour BB.
To be clear, daily BB means that BB created based on daily chart , which can be shown on lower timeframes.
-Each BB displays 3 bands(minus 1-3ς & plus 1-3ς) and middle line
-Display of each band can be parameterized to show and not to show
e.g. Showing only plus/minus 2 and 3ς etc.
-The middle line adopts SMA ( simple moving average ) only and you can set period of SMA .
-Each BB will be shown as follows based on timeframes that you select.
Daily BB: Shown on daily, 4hour, 1 hour, 30M, 15M, 5M and 1M chart
(Weekly and Monthly chart does not show BB)
4hour BB: Shown on 4hour, 1 hour, 30M, 15M, 5M and 1M chart
(Daily, Weekly and Monthly chart does not show BB)
1hour BB: Shown on 1 hour, 30M, 15M, 5M and 1M chart
(4hour, Daily, Weekly and Monthly chart does not show BB)
-Each BB can be enabled and disabled by ticking checkbox.
e.g. On 1 hour chart, you can disable 4 hour BB and show daily BB only etc.
Please see the sample chart below.
Sample chart with the indicator
Daily chart
4hour chart showing daily BB and 4H BB
1hour chart showing daily BB, 4H BB and 1H BB
5Mchart showing daily BB, 4H BB and 1H BB
Journey to use indicator
This indicator is paid indicator and invited-only indicator.
Please contact me via private chat or follow links in my signature so that we can initiate the process to access the indicator
--------------------------------------------------------------------------------------------------
日足、4時間足、1時間足の3つのボリンジャーバンド(プラスマイナス1-3シグマのバンド)を下位足含めて表示するマルチタイムフレームボリンジャーバンドのインジケーターです。
インジケーターの目的
上位足のボリンジャーバンドを下位足に表示することで、レジサポの判断に使うことを想定しています。
他のボリンジャーバンドインジケーターとの違い
他のボリンジャーバンドインジケーターでは、よく以下の問題に直面します。
・上位足のボリンジャーバンドを表示しようとすると、さらに上位足でもそのバンドが表示されチャートがみにくくなる。
例: 4時間足のボリンジャーバンドを下位足で表示可能な様に設定すると、日足や週足でも表示され、チャートがノイズだらけに・・・
・一つのインジケーターでは一つのボリンジャーバンドのみ表示。異なる時間軸のボリンジャーバンドを表示しようとするとその数だけインジケーターを追加する必要あり。
・バンドが一つしか設定できず、1-3シグマまで表示しようとするとインジケーターを追加する必要がある。
これらの問題に対して、このインジケーターでは、
・ボリンジャーバンドを表示する時間軸を制御することで上位足側で不必要な情報を表示させない。これによりチャートをスッキリ見やすくすることができる。
・一つのインジケーターで3つの異なる時間軸のボリンジャーバンドを表示し、かつそれぞれでプラスマイナス1-3のバンドを表示することでインジケーター数を節約。
という機能を加えることでこれらの問題を解決しています。
これがこのインジケーターが提供する付加価値だと考えています。
仕様
機能概要
・このインジケーターでは日足、4時間足、1時間足の3つの時間軸のボリンジャーバンドを表示します。
・それぞれのボリンジャーバンドはプラスマイナス1-3シグマまでのバンドと基準線を表示します。
・各バンドは表示・非表示の切り替えが可能です。(例: プラスマイナス2、3シグマのみ表示など)
・各ボリンジャーバンドの基準線(ミドルライン)はSMA(単純移動平均線)です。移動平均線の期間は自由に設定できます。
・各ボリンジャーバンドは表示しているチャートの時間軸に応じて以下の様に表示されます。
日足のボリンジャーバンド : 日足, 4時間足、1時間足、30分足、15分足、5分足、1分足チャートにのみ表示(週足以上では非表示の仕様です。)
4時間足のボリンジャーバンド : 4時間足、1時間足、30分足、15分足、5分足、1分足チャートにのみ表示(日足以上では非表示の仕様です。)
1時間足のボリンジャーバンド : 1時間足、30分足、15分足、5分足、1分足チャートにのみ表示(4時間足以上では非表示の仕様です。)
・各ボリンジャーバンドは表示・非表示のフラグをON/OFFにすることで表示を制御することができます。
例えば1時間足のチャートでは日足のボリンジャーバンドのみを表示し、4時間足のボリンジャーバンドを表示させない、など。
サンプルチャート
日足
日足では日足ボリンジャーバンドしか表示されない設定ですので、4時間足や1時間足の設定が邪魔になりません。
ここが他のボリンジャーバンドインジケーターと違う点です。
4時間足
4時間足に日足と4時間足のボリンジャーバンドを表示した状態です。不要な場面では両方もしくはいずれか一方を非表示にすることができます。
1時間足
1時間足に日足と4時間足と1時間足のボリンジャーバンドを表示した状態です。
5分足
5分足に全てのボリンジャーバンドを表示したチャートです。
短期トレードで上位足ボリンジャーバンドによる反発を狙う時などに活用できるのではないでしょうか。
インジケーターの使用について
当インジケーターは招待制インジケーター(有料)となっています。
使用を希望される方はプライベートチャットや下記リンクのDMでご連絡ください。
このページのコメント欄はインジケーターそのものに対するコメントやアップデートの記載のためのものとなっております。Tradingviewのハウスルールを守るためにもコメント欄からの連絡はご遠慮ください。
TradeChartist Risk Meter™𝗧𝗿𝗮𝗱𝗲𝗖𝗵𝗮𝗿𝘁𝗶𝘀𝘁 𝗥𝗶𝘀𝗸 𝗠𝗲𝘁𝗲𝗿 is a very useful and a well designed indicator, that packs a range of Risk utility tools including Trend Based Stochastic Oscillator, Bollinger Bands %B , Volatility Risk Oscillator, RSI Oscillator and RSI Risk Oscillator, along with further visual risk assessment tools like Divergence Spotter, Trend based Strength detector among other useful extras.
===================================================================================================================
™𝗧𝗿𝗮𝗱𝗲𝗖𝗵𝗮𝗿𝘁𝗶𝘀𝘁 𝗥𝗶𝘀𝗸 𝗠𝗲𝘁𝗲𝗿 𝗨𝘀𝗲𝗿 𝗠𝗮𝗻𝘂𝗮𝗹
The user can choose from one of the following four option from the 𝗥𝗶𝘀𝗸 𝗠𝗲𝘁𝗲𝗿 𝗧𝘆𝗽𝗲 dropdown from the settings.
1. Trend Based Stochastic
2. Bollinger Bands %B
3. Volatility Risk Oscillator
4. RSI + RSI Risk Oscillator
The source price for the Risk Meter can be chosen from Sᴏᴜʀᴄᴇ dropdown. Both Trend Based Stochastic and Volatility Risk Oscillator use High/Low prices as default. Enable Usᴇ Sᴏᴜʀᴄᴇ Pʀɪᴄᴇ under respective section to use a different source price.
Users can choose to plot Risk Meter background fill by enabling or disabling Rɪsᴋ Mᴇᴛᴇʀ Bᴀᴄᴋɢʀᴏᴜɴᴅ . The background fill is based on the trend intensity and uses 2 different colour schemes based on user preference. When the Dᴇᴄɪᴅᴇʀ Tʜʀᴇsʜᴏʟᴅ is used, it uses the background fill to mask the zone. If background fill is disabled, orange colour is used to mask the zone.
All of the Risk Meter plots can be plotted as Line , Histogram or Area plots and each of the sections include the Pʟᴏᴛ Sᴛʏʟᴇ option, so the user can choose a specific type of plot style for each of the Risk Meter Oscillators, based on user preference.
===================================================================================================================
═══ 𝟭. 𝗧𝗿𝗲𝗻𝗱 𝗕𝗮𝘀𝗲𝗱 𝗦𝘁𝗼𝗰𝗵𝗮𝘀𝘁𝗶𝗰 ═══
Trend Based Stochastic Oscillator is a modified version of the classic Stochastic Oscillator with the difference being the limits and also the plot itself to an extent.
--> Trend based Stochastic is a single plot oscillates between -100 to +100 and occasionally breaches these limits and can signal extremely overbought or oversold conditions unlike classic Stochastic indicator, which has two plots and strictly oscillates between 0-100.
--> Trend based Stochastic is extremely sensitive to price action, making it possible to detect every single divergence, both regular and hidden, even with the default smoothing factor of 5
--> Risk Meter employs Dᴇᴄɪᴅᴇʀ Tʜʀᴇsʜᴏʟᴅ to let user choose the threshold limit and only from this point onwards, Risk Meter detects the divergences. This helps filter a lot of noise in addition to Price and Oscillator Pivot detection under 𝗗𝗶𝘃𝗲𝗿𝗴𝗲𝗻𝗰𝗲𝘀 section.
The user has to choose the length for the Trend based Stochastic plot by entering number of bars in Lᴏᴏᴋʙᴀᴄᴋ Lᴇɴɢᴛʜ input box (Default value is 55). The user can also change the smoothing factor from default value of 5 by entering the value in Sᴍᴏᴏᴛʜɪɴɢ input box. Smoothing is particularly useful to detect the strength, based on the trend if 𝐂𝐨𝐥𝐨𝐫 𝐙𝐨𝐧𝐞𝐬 𝐛𝐚𝐬𝐞𝐝 𝐨𝐧 𝐒𝐭𝐫𝐞𝐧𝐠𝐭𝐡 is enabled and the required trend length is entered in Tʀᴇɴᴅ Sᴛʀᴇɴɢᴛʜ Dᴇᴛᴇᴄᴛɪᴏɴ Lᴇɴɢᴛʜ . This feature splits the Risk Meter Plot into Bull and Bear zones based on the trend strength. HIgher Smoothing with default trend strength detection of 5 (upto 10) works well for sensitive price hugging scalps/swings. For longer trends, higher detection lengths can be used.
===================================================================================================================
════ 𝟮. 𝗕𝗼𝗹𝗹𝗶𝗻𝗴𝗲𝗿 𝗕𝗮𝗻𝗱𝘀 %𝗕 ═════
Bollinger Bands %B in Risk Meter oscillates between -100 to +100 rather than 0 - 1 in the classic version, with oversold/overbought levels breaching the limits and the plot is exactly the same otherwise.
Risk Meter employs Dᴇᴄɪᴅᴇʀ Tʜʀᴇsʜᴏʟᴅ for Bollinger Bands %B to let the user choose the threshold limit and only from this point onwards, Risk Meter detects the divergences. This helps filter a lot of noise in addition to Price and Oscillator Pivot detection under 𝗗𝗶𝘃𝗲𝗿𝗴𝗲𝗻𝗰𝗲𝘀 section.
The user has to choose the Simple Moving Average (SMA) length for the plot by entering number of bars in BB SMA Lᴇɴɢᴛʜ input box (Default value is 20). There is no need for Standard Deviation as the fundamental plot is exactly the same, given that the plot oscillates between -100 to +100. The user can also change the smoothing factor from default value of 5 by entering the value in Sᴍᴏᴏᴛʜɪɴɢ input box. Smoothing is particularly useful to detect the strength, based on the trend if 𝐂𝐨𝐥𝐨𝐫 𝐙𝐨𝐧𝐞𝐬 𝐛𝐚𝐬𝐞𝐝 𝐨𝐧 𝐒𝐭𝐫𝐞𝐧𝐠𝐭𝐡 is enabled and the required trend length is entered in Tʀᴇɴᴅ Sᴛʀᴇɴɢᴛʜ Dᴇᴛᴇᴄᴛɪᴏɴ Lᴇɴɢᴛʜ . This feature splits the Risk Meter Plot into Bull and Bear zones based on the trend strength. HIgher Smoothing with default trend strength detection of 5 (upto 10) works well for sensitive price hugging scalps/swings. For longer trends, higher detection lengths can be used.
===================================================================================================================
══════ 𝟯. 𝗩𝗼𝗹𝗮𝘁𝗶𝗹𝗶𝘁𝘆 𝗥𝗶𝘀𝗸 ═══════
Volatility Risk Oscillator is an original ™TradeChartist model designed to visually see the Volatility risk for the security on any time frame.
To plot Volatility Risk for the security, the user has to enter the number of bars to detect volatility risk in Lᴏᴏᴋʙᴀᴄᴋ Lᴇɴɢᴛʜ input box (Default Value is 55). The user can also change the smoothing factor from default value of 5 by entering the value in Sᴍᴏᴏᴛʜɪɴɢ input box. Smoothing is particularly useful to detect the strength based on trend if 𝐂𝐨𝐥𝐨𝐫 𝐙𝐨𝐧𝐞𝐬 𝐛𝐚𝐬𝐞𝐝 𝐨𝐧 𝐒𝐭𝐫𝐞𝐧𝐠𝐭𝐡 is enabled and required trend length is entered in Tʀᴇɴᴅ Sᴛʀᴇɴɢᴛʜ Dᴇᴛᴇᴄᴛɪᴏɴ Lᴇɴɢᴛʜ . This feature splits the Risk Meter Plot into Bull and Bear zones based on the trend strength. HIgher Smoothing with default trend strength detection of 5 (upto 10) works well for sensitive price hugging scalps/swings. For longer trends, higher detection lengths can be used.
Even though Divergences work on Volatility Risk Oscillator, it is not employed as it produces far too many and there is no set Threshold limit that can be set to filter the divergences.
===================================================================================================================
══════ 𝟰. 𝗥𝗦𝗜 𝗢𝘀𝗰𝗶𝗹𝗹𝗮𝘁𝗼𝗿 ═══════
There are two different types of RSI Oscillators in this section that can be plotted.
RSI Oscillator - Classic RSI modified to fit -100 to +100 scale rather than 0 - 100 scale. Risk Meter employs Dᴇᴄɪᴅᴇʀ Tʜʀᴇsʜᴏʟᴅ for RSI Oscillator also, to let the user choose the threshold limit and only from this point onwards, Risk Meter detects the divergences. This helps filter a lot of noise in addition to Price and Oscillator Pivot detection under 𝗗𝗶𝘃𝗲𝗿𝗴𝗲𝗻𝗰𝗲𝘀 section.
RSI Risk Oscillator - This oscillator plots the potential RSI risk based on RSI length (which can be changed in RSI Lᴇɴɢᴛʜ input box and main source price ( Sᴏᴜʀᴄᴇ ). The user can also change the smoothing factor from default value of 5 by entering the value in Sᴍᴏᴏᴛʜɪɴɢ input box. Smoothing is particularly useful to detect the strength, based on the trend if 𝐂𝐨𝐥𝐨𝐫 𝐙𝐨𝐧𝐞𝐬 𝐛𝐚𝐬𝐞𝐝 𝐨𝐧 𝐒𝐭𝐫𝐞𝐧𝐠𝐭𝐡 is enabled and the required trend length is entered in Tʀᴇɴᴅ Sᴛʀᴇɴɢᴛʜ Dᴇᴛᴇᴄᴛɪᴏɴ Lᴇɴɢᴛʜ . This feature splits the Risk Meter Plot into Bull and Bear zones based on the trend strength. Higher Smoothing with default trend strength detection of 5 (upto 10) works well for sensitive price hugging scalps/swings. For longer trends, higher detection lengths can be used.
To plot RSI Risk Oscillator, 𝐒𝐡𝐨𝐰 𝐑𝐒𝐈 𝐑𝐢𝐬𝐤 𝐎𝐬𝐜𝐢𝐥𝐥𝐚𝐭𝐨𝐫 must be enabled. Disabling this option plots normal RSI Oscillator.
The 4hr chart of BTC-USDT below shows use of RSI Risk Oscillator (Top) with RSI Oscillator (bottom).
===================================================================================================================
╔═══════ 𝗗𝗶𝘃𝗲𝗿𝗴𝗲𝗻𝗰𝗲𝘀 ═══════╗
Risk Meter detects both Regular and Hidden Bullish and Bearish Divergences at every occurence. This can be filtered by the use of Dᴇᴄɪᴅᴇʀ Tʜʀᴇsʜᴏʟᴅ in above sections. To plot divergences, enable
𝗗𝗶𝘃𝗲𝗿𝗴𝗲𝗻𝗰𝗲𝘀, Sʜᴏᴡ Rᴇɢᴜʟᴀʀ Dɪᴠᴇʀɢᴇɴᴄᴇs and Sʜᴏᴡ Hɪᴅᴅᴇɴ Dɪᴠᴇʀɢᴇɴᴄᴇs . All divergences are enabled as default.
Users can further filter Divergences by entering the number of bars to the right in Rɪɢʜᴛ ʙᴀʀs ғᴏʀ Pɪᴠᴏᴛ Cᴏɴғɪʀᴍᴀᴛɪᴏɴ input box to confirm the Price Pivot (for Regular divergences) and Oscillator Pivot (for Hidden Divergences).
The example chart of 4hr BTC-USDT chart shows the Divergences filtered by use of RSI Threshold. It is important to note that the trend intensity colour on the plot and bars (if bar colour option is enabled) will help detect if the Divergence would hold.
===================================================================================================================
╔═══════ 𝗨𝘀𝗲𝗳𝘂𝗹 𝗘𝘅𝘁𝗿𝗮𝘀 ═══════╗
Risk Meter offer two vibrant Colour Themes, namely Chilli and Flame , which can be opted from Rɪsᴋ Mᴇᴛᴇʀ Tʜᴇᴍᴇ dropdown. These themes also offer the option to plot the trend intensity on the price bars as bar colours by enabling Rɪsᴋ Mᴇᴛᴇʀ Cᴏʟᴏᴜʀ Bᴀʀs . Bar colors can also be inverted using Iɴᴠᴇʀᴛ Bᴀʀ Cᴏʟᴏᴜʀ option.
Users can also choose to use the Simple theme and choose preferred colours from Sɪᴍᴘʟᴇ Tʜᴇᴍᴇ ʙᴜʟʟ Cᴏʟᴏᴜʀ and Sɪᴍᴘʟᴇ Tʜᴇᴍᴇ ʙᴇᴀʀ Cᴏʟᴏᴜʀ colour input.
Note: The indicator does not repaint and can be confidently used for alerts and trade entries without worrying about plots disappearing after bar close.
===================================================================================================================
Example Charts
1. 89 period Trend Based Stochastic Oscillator as Histogram plot on LINK-USDT 1hr chart with Chilli Theme.
2. 89 period Volatility Risk Oscillator as Histogram plot on SPX 1hr chart with Chilli Theme.
3. 14 period RSI Risk Oscillator as Area plot on AAPL Daily Chart with Flame Theme.
4. 100 period Volatility Risk Oscillator using Trend Strength plotted as Zones on 1hr EUR-USD chart with Chilli Theme.
===================================================================================================================
Best Practice: Test with different settings first using Paper Trades before trading with real money
===================================================================================================================
This is not a free to use indicator. Get in touch with me (PM me directly if you would like trial access to test the indicator)
Premium Scripts - Trial access and Information
Trial access offered on all Premium scripts.
PM me directly to request trial access to the scripts or for more information.
===================================================================================================================

Stock Market Strategy : VWAP, MACD, EMA, Breakout, BBHello there,
Today I bring you a stock market strategy, specialized in NASDAQ stocks.
Its a daytrading strategy, that can only do a max of 1 trade per day. In this case it only trades the first 2 opening hours of the market.
The rules are simple :
We follow the trend based on a big EMA, in this case 200, after that, we check for VWAP direction , then, we check histogram from MACD. This is the simple logic of the strategy.
Inside there is another strategy, that not just do the above, but also uses Bollinger bands, and checks for breakout of bottom or top line. Also it uses Average directional Index, for even a bigger criteria .
So for example a long condition it would be : candle is above the ema, and candle is above vwap, and histogram is positive, and candle break the top bb level and ADI < 40 -> long signal . The opposite works for short(ADI > 20).
In this case all this criterias are between the first 2 hours of market. So we enter between the first hour, and exit in the next hour. For this we need to use very short time frames.
Hope you enjoy it.
Let me know if you have any questions

Volatility Squeeze Region IndicatorVolatility Squeeze Indicator conditions based on lowest ATR ,proportion of Bollinger and keltner channel upper and lower bands. Usage to identify and highlight Squeeze region when if indicator value <1 means Squeeze On and >1 means Squeeze off .
Additionally Background Highlights for Daily(Blue), Weekly(Brown) and Monthly(purple) Squeeze regimes for confluence check. For Breakouts and trades use appropriate Price Action and in conjunction other indicators.
Bollinger Bands and RSI mix with DCAThis strategy uses a mix of Bollinger Bands and RSI to enter long positions. It impliments DCA.

Moving Average, T3 and Bollinger StrategyThis strategy uses a SMA much like an the faster EMA in many oscillators and the T3 average of the same period as the intermediate trend. Exits are defined by encounters with the Bollinger Band. The long term trend is defined by T3 moving averages of an even longer period.

HuD IntradayConsist of :
- standard Bollinger Band (BB) - MA20 and 2 dev
- EMA ( default 9,20,50 and 200)
- WMA ( 5 and 10 )
- Donchian Channel
Suitable for intraday trading - 15min, 30 min or 1 hour timeframe
Trading Strategy :
1. Enter trade only when
- band is Green
- line EMA20 above EMA50 and line EMA50 above EMA200 ( black > purple > red )
- RSI (default setting 14) is above level 50 and trend is positive (RSI line moving upward)
2. Possible Entry point ( 3 options )
i Breakout candle and candle still below lower BB
ii Retracement/Pullback - after Breakout and candle still inside green band. RSI still above 50
iii. Buy on Weakness (BOW) - Blue diamond icon
3. Stop Loss :
- Select "Show Stop Loss" - to display stop loss line
- Based on ATR
- adjustable depend on trader risk
Other option for stop loss :
- WMA Area ( Dark green ) - candle cross under WMA, can consider to exit trade
- EMA20 - candle cross under EMA20, can consider to exit trade.
4. Alert
Therea are 3 alerts availabe
i. Breakout signal
ii. Sell signal - candle break trailing Stop
iii. BOW - Buy on weakness signal
Note :
- This indicator only suitable for Bursa Malaysia
- Do PM me if you interested

BBliciousStandard Bollinger Band with :
- BB with 1 Standard Dev
- BB with 1.5 Standard Dev
- BB with 2..5 Standard Dev
Top and Bottom Ribbon Color Area
- Fill Area between Standard Dev 1 and 1.5 ( Top & Bottom )

[blackcat] L2 Center Band BollingerLevel: 2
Background
Bollinger bands are a type of price envelope developed by John Bollinger , where price envelopes define upper and lower price ranges. Bollinger Bands are envelopes that are represented with a standard deviation above and below a simple moving average of price. Because the spacing of the bands is based on the standard deviation, they adjust for fluctuations in the volatility of the underlying price.
Function
L2 Center Band Bollinger takes advantage of Bollinger band to detect sideways and trends. At the same time, I made an improvement and the center Bollinger line as a fast-slow-line color band. The algorithm of the color center band is composed of price and volume information, which produces gold cross and dead cross for short term long and short entries.
Key Signal
aa10 --> bollinger middle fast line
aa12 --> bollinger middle slow line
up --> upper envelope
dn --> lower envelope
Pros and Cons
Pros:
1. it can easy see the sections of trends or sideways by width of Bollinger band
2. long and short entries are disclosed
Cons:
1. Some noise is still incorporated in trends
2. due to this is un-optimized version, time frame and trading pairs need to be selected
3. Bollinger re-entry signal is not disclosed yet
Remarks
The long and short signal is compatible to @nilux strategy backtest framework for sandardized backtest scheme: Backtest
Readme
In real life, I am a prolific inventor. I have successfully applied for more than 60 international and regional patents in the past 12 years. But in the past two years or so, I have tried to transfer my creativity to the development of trading strategies. Tradingview is the ideal platform for me. I am selecting and contributing some of the hundreds of scripts to publish in Tradingview community. Welcome everyone to interact with me to discuss these interesting pine scripts.
The scripts posted are categorized into 5 levels according to my efforts or manhours put into these works.
Level 1 : interesting script snippets or distinctive improvement from classic indicators or strategy. Level 1 scripts can usually appear in more complex indicators as a function module or element.
Level 2 : composite indicator/strategy. By selecting or combining several independent or dependent functions or sub indicators in proper way, the composite script exhibits a resonance phenomenon which can filter out noise or fake trading signal to enhance trading confidence level.
Level 3 : comprehensive indicator/strategy. They are simple trading systems based on my strategies. They are commonly containing several or all of entry signal, close signal, stop loss, take profit, re-entry, risk management, and position sizing techniques. Even some interesting fundamental and mass psychological aspects are incorporated.
Level 4 : script snippets or functions that do not disclose source code. Interesting element that can reveal market laws and work as raw material for indicators and strategies. If you find Level 1~2 scripts are helpful, Level 4 is a private version that took me far more efforts to develop.
Level 5 : indicator/strategy that do not disclose source code. private version of Level 3 script with my accumulated script processing skills or a large number of custom functions. I had a private function library built in past two years. Level 5 scripts use many of them to achieve private trading strategy.

BB Keltner Squeeze Signal 1.0Made this to signal when the criteria is met for a "Bollinger Band + Keltner Channel Squeeze" signal. This is when one or both of the Bollinger Bands come inside the Keltner Channel. When this happens the bars are highlighted. The idea of this script is to clean up charts as much as possible.
Bollinger Bands are measures of standard deviation from a simple moving average. This is the distance that price travels as a whole over time. Keltner Channels are a measure of ATR from an exponential moving average. This is the average range of individual bars.
Both indicators measure volatility and when they contract indicate that price is consolidation. A very tight consolidation can often be a prelude to an expansion of volatility and price movement. It can be a signal for a potential breakout or confirmation one will be successful.
The actual Bollinger Bands and Keltner Channels are turned off by default but can be turned on in the script settings. I also use 26 as the default length but it can be changed.
Improved On balance volume with BB channel and double MAThis is an improved version of the on balance volume indicator.
I made it inside a bollinger band channel, so we can define better the zones. At the same time I applied 2 moving averages on OBV, to get a better idea of the trend and at same time that change direction of the trend.
Green - > uptrend - > we look for buy positions
Red - > downtrend -> we look for sell positions.
At the same time we have to be aware of crosses on bollinger bands, which can indicate a change in the trend .

Ultimate VWAP Bands- Ultimate VWAP Bands is a script that helps to decide and further clarify areas of oversold and overbought conditions.
- For example, when the price is in the lowest band it is extremely oversold relative to the VWAP . Hence it should be considered a good place to buy with a high risk to reward payoff.
- Each band is set at a fixed offset away from the VWAP . The "VWAP Band Multiplier" adjusts this and is a key part of the script. This allows the indicator to be adjusted based on the assets volatility . For example, with Crypto. A multiplier of 1 would be strongly advised. Whilst a multiplier of 0.1-0.25 would be useful for currency pairs.
- This indicator can be used for all manners of trading. However, it is most effective when used for scalping and swing trading.

Volume Weighted Bollinger Bands 出来高加重ボリンジャーバンドIt is a volume-weighted index of Bollinger Bands.
The central line is vwma so it's quite responsive
The standard deviation is also volume weighted
Charts without volume are not weighted with volume as 1.
It seems that the usage in trading is the same as the Bollinger band
ボリンジャーバンドを出来高加重した指標です
中央線はvwma出来高加重移動平均なのでかなり反応が良いです
標準偏差も出来高加重してしています
出来高の無いチャートは出来高を1として加重しないようにしています
トレードでの使い方はボリンジャーバンドと同じで良いと思われます

Blast Off With BBBased on Larry Williams "Blast Off" indicator. An excellent article describing calculations and usage is here . The indicator uses the same calculations.
It must be noted that "Blast Off" by itself is not a sufficient system for a trade set up.
This indicator adds traditional Bollinger Bands as a support structure for blast off. Generally, a volatility compression followed by a cluster of blast off indicates an aggressive "launch" on the upside or downside.
Explanation
Blast off is indicated below the candle bar with an up arrow
Blast off candles can be marked (coloured) if preferred
Bollinger bands can be enabled for prediction of the direction of the blast ("up" or "down")
The Blast Smooth Length applies a smoothing to the ranges (Open - Close) and (High - Low) over the specified length.
Threshold is the "trigger" that indicates a blast off candidate. It is defined in % terms.

Stochastics and RSI HybridThis is an interesting study. We know bollinger bands can be a useful tool for price action, but what if we applied them to other indicators?
The top chart is the Stochastics and bottom chart represents RSI. We can see a relationship between the two indicators, where the signal line bounces of the bollinger bands.
The strategy is simple, when the signal lines bounce of their bollinger bands together, review price action and then take the trade. If you see one indicator going in the opposite direction to the other, or opposite to price action, then you may be observing divergence in which case a big move is about to happen.
If you wish to have this indicator further customised, please do not hesitate to contact me.

Radar Screen v3This is a combination of various indicators that very rarely conflict, thus giving us a good understanding:
- "Price Rally" detecting whether price is rallying, giving us confidence it will continue.
- Volume - knowing volume is going with the trend is a good confidence check.
- Trend Angle - This will go red or green depending on whether the price angle is going up or down, taken over three bars.
- VWAP for all of these stock traders.
- EMA8 is a very sensitive moving average, good for short term trades.
- CCI SMA is a strategy I commonly use, please check out my other indicators for a functional description.
- Stochastics is used throughout many systems.
- RSI BB shows where price is rebounding of the bollinger band and then moving up or down.
As per all of my indicators, the system is simple - The more green lines you see, the stronger the buy signal. The more red lines you see, the stronger the sell. If its a 50/50 mix of red and green, then don't trade.
I can customise this further or add other strategies, please message me.
Bollinger bands on 1M/5M/15M chart onlyJapanese below. 日本語の説明は下記
This is Bollinger bands that is shown only on 1M, 5M and 15M charts only.
I Sometimes refer to Bollinger bands when I try to identify specific entry point on lower timeframe especially on 5M, whereas I do not want Bollinger bands to be shown up on other timeframes as they become noise...
This is why I removed Bollinger bands from 1 hour and upper timeframes.
——————————————————————————————
1分足、5分足、15分足のみに表示されるボリンジャーバンドのインジケーターです。
1分足や5分足でエントリーのタイミングを計るときにはボリンジャーバンドを使うことがあるのですが、1時間足以上では特に参照しないため、チャートに表示しないよう制御を加えました。
±1〜3シグマのバンド及びミドルラインとしてSMAを設定可能です。
short term reversal, MTF support & resistanceIt is an indicator that assists short-term reversal trading utilizing support and resistance.
It is recommended to build a position after the buy / sell marker appears while checking the support and resistance.
When building a position, it is important to have a short-term perspective without holding it for a long time.
(Recommended period is 3 to 5 candlesticks)
If the price moves in the opposite direction to the marker, hold it until the marker comes out again,
or if it is out of support and resistance, cut the loss once and the marker again You can also wait for it to come out.
Support and Resistance mainly uses Bollinger Bands and can use multi-timeframes.
By default, the higher the support and resistance of the time axis, the thicker the line.
Please send me a PM to access this indicator.