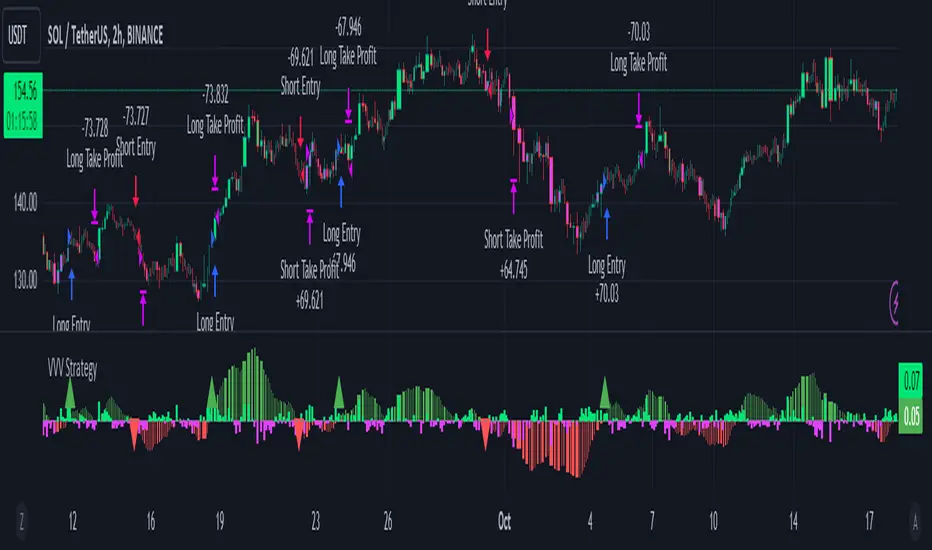
Velocity/Volatility/Volume StrategyThe "Vel/Vty/Vol Strategy" is a momentum-based trading approach designed to take advantage of strong price movements that are confirmed by both volatility and volume (if enabled). It provides a high level of customization, allowing traders to adjust various settings based on market conditions and individual preferences. By combining three critical indicators—velocity, volatility (measured through Bollinger Band Width), and an optional volume filter—the strategy generates trade signals for both long and short positions. Here’s a comprehensive explanation of how the strategy works, how the parameters can be customized, and how those adjustments benefit users.
At its core, the strategy focuses on velocity, which measures the speed at which price is changing over time. This is a key indicator of momentum, with a "StrongUp" signal indicating bullish momentum and a "StrongDown" signal suggesting bearish momentum. In addition to velocity, the strategy factors in acceleration, which helps gauge whether momentum is building or weakening. The second essential component is Bollinger Band Width (BBW), which measures volatility in the market. When the BBW expands, it signals increasing volatility, a condition that must be met in combination with a velocity signal to generate a trade. Lastly, the strategy includes an optional Volume Oscillator to filter trades. When this volume filter is enabled, trades will only be executed if there’s an increase in volume, further validating market activity.
The strategy generates long and short trade signals based on specific conditions. A long trade is triggered when there is a strong upward velocity, accompanied by an increase in Bollinger Band Width, indicating both momentum and heightened volatility. If the volume filter is toggled on, a rise in volume must also confirm the signal. Similarly, a short trade is initiated when a strong downward velocity is detected, again paired with an increase in volatility and, optionally, a volume rise. This ensures that trades occur during periods of heightened market activity, reducing the likelihood of false signals.
To help manage risk, the strategy includes several customizable tools. Users can set take profit levels to automatically close positions and lock in gains once a predefined profit percentage is reached. For example, if a 2% take profit is set, a long position will be closed once the price has risen by 2%. Additionally, a trailing take profit option can be enabled, allowing the strategy to dynamically adjust the take-profit target as the market moves in the user’s favor. This ensures that profits are locked in as long as the market continues to trend positively, while providing protection in case of a reversal. The strategy also includes a trailing stop-loss feature, which adjusts the stop price as the market moves in favor of the trade, helping to minimize losses and protect gains.
The strategy offers a variety of parameters that can be customized to suit different trading styles and market conditions. The velocity lookback period controls how far back the strategy looks to calculate velocity. A shorter lookback makes the strategy more sensitive to recent price changes, generating more signals, which can benefit day traders or those seeking to capture short-term price swings. Conversely, a longer lookback smooths out the velocity calculation, reducing false signals and making the strategy more suitable for traders seeking to capture larger trends. Similarly, the Bollinger Band Width (BBW) length can be adjusted to control how far back the strategy looks to calculate volatility. A shorter BBW length makes the strategy more sensitive to volatility spikes, useful in rapidly changing markets. In contrast, a longer BBW length filters out short-term noise and focuses on more sustainable volatility shifts, better suited for slower, more stable markets.
The volume filter is another powerful feature that can be toggled on or off. When turned on, the strategy will only execute trades if there is an increase in volume alongside velocity and volatility signals. This helps filter out false signals in low-volume markets, ensuring that price movements are supported by actual market activity. If the volume filter is turned off, the strategy focuses purely on price and volatility changes, which can be useful in markets where volume data is unreliable or less relevant.
The take profit percentage can be adjusted to define how aggressively or conservatively profits are locked in. A lower take profit percentage allows traders to capture smaller, quicker profits, which can be advantageous in volatile markets. A higher take profit percentage suits traders who prefer to capture larger moves, allowing them to stay in trades longer to benefit from extended trends. Similarly, the trailing take profit percentage determines how tightly the strategy follows market prices as they move in favor of the trade. A tighter trailing percentage ensures that profits are locked in quickly, while a wider trailing percentage gives trades more room to run, ideal for capturing large trends.
The stop loss percentage is another key setting that controls how much risk a trader is willing to take before the position is closed. A tighter stop loss minimizes losses but may result in more frequent stop-outs, particularly in volatile markets. A wider stop loss provides more room for trades to develop, which is useful for traders aiming to capture longer trends despite short-term fluctuations. Additionally, the velocity thresholds can be adjusted to set how sensitive the strategy is to price movements. Lower thresholds increase sensitivity, generating more signals in fast-moving markets, while higher thresholds filter out weaker signals, focusing on larger momentum shifts.
The strategy also allows users to define a time range during which it is active, offering flexibility in backtesting and optimizing for specific market conditions. By limiting the strategy to certain periods, users can tailor it to seasonal trends or historical data that matches their current trading environment.
The flexibility of this strategy makes it suitable for a wide range of traders. Day traders can benefit from adjusting the velocity and BBW lookback periods, tightening take profit and stop loss settings to capture short, fast price movements in highly volatile markets. Trend traders can lengthen the lookback periods and widen the velocity thresholds to capture larger, sustained moves while riding out short-term volatility. Traders with a lower risk tolerance can enable the volume filter and tighten stop losses to reduce false signals and minimize losses. On the other hand, aggressive traders can widen the take profit and trailing stop percentages to allow trades to develop fully, maximizing potential gains in trending markets.
Bandas de Bollinger (BB)
VIDYA ProTrend Multi-Tier ProfitHello! This time is about a trend-following system.
VIDYA is quite an interesting indicator that adjusts dynamically to market volatility, making it more responsive to price changes compared to traditional moving averages. Balancing adaptability and precision, especially with the more aggressive short trade settings, challenged me to fine-tune the strategy for a variety of market conditions.
█ Introduction and How it is Different
The "VIDYA ProTrend Multi-Tier Profit" strategy is a trend-following system that combines the VIDYA (Variable Index Dynamic Average) indicator with Bollinger Bands and a multi-step take-profit mechanism.
Unlike traditional trend strategies, this system allows for more adaptive profit-taking, adjusting for long and short positions through distinct ATR-based and percentage-based targets. The innovation lies in its dynamic multi-tier approach to profit-taking, especially for short trades, where more aggressive percentages are applied using a multiplier. This flexibility helps adapt to various market conditions by optimizing trade management and profit allocation based on market volatility and trend strength.
BTCUSD 6hr performance
█ Strategy, How it Works: Detailed Explanation
The core of the "VIDYA ProTrend Multi-Tier Profit" strategy lies in the dual VIDYA indicators (fast and slow) that analyze price trends while accounting for market volatility. These indicators work alongside Bollinger Bands to filter trade entries and exits.
🔶 VIDYA Calculation
The VIDYA indicator is calculated using the following formula:
Smoothing factor (𝛼):
alpha = 2 / (Length + 1)
VIDYA formula:
VIDYA(t) = alpha * k * Price(t) + (1 - alpha * k) * VIDYA(t-1)
Where:
k = |Chande Momentum Oscillator (MO)| / 100
🔶 Bollinger Bands as a Volatility Filter
Bollinger Bands are calculated using a rolling mean and standard deviation of price over a specified period:
Upper Band:
BB_upper = MA + (K * stddev)
Lower Band:
BB_lower = MA - (K * stddev)
Where:
MA is the moving average,
K is the multiplier (typically 2), and
stddev is the standard deviation of price over the Bollinger Bands length.
These bands serve as volatility filters to identify potential overbought or oversold conditions, aiding in the entry and exit logic.
🔶 Slope Calculation for VIDYA
The slopes of both fast and slow VIDYAs are computed to assess the momentum and direction of the trend. The slope for a given VIDYA over its length is:
Slope = (VIDYA(t) - VIDYA(t-n)) / n
Where:
n is the length of the lookback period. Positive slope indicates bullish momentum, while negative slope signals bearish momentum.
LOCAL picture
🔶 Entry and Exit Conditions
- Long Entry: Occurs when the price moves above the slow VIDYA and the fast VIDYA is trending upward. Bollinger Bands confirm the signal when the price crosses the upper band, indicating bullish strength.
- Short Entry: Happens when the price drops below the slow VIDYA and the fast VIDYA trends downward. The signal is confirmed when the price crosses the lower Bollinger Band, showing bearish momentum.
- Exit: Based on VIDYA slopes flattening or reversing, or when the price hits specific ATR or percentage-based profit targets.
🔶 Multi-Step Take Profit Mechanism
The strategy incorporates three levels of take profit for both long and short trades:
- ATR-based Take Profit: Each step applies a multiple of the ATR (Average True Range) to the entry price to define the exit point.
The first level of take profit (long):
TP_ATR1_long = Entry Price + (2.618 * ATR)
etc.
█ Trade Direction
The strategy offers flexibility in defining the trading direction:
- Long: Only long trades are considered based on the criteria for upward trends.
- Short: Only short trades are initiated in bearish trends.
- Both: The strategy can take both long and short trades depending on the market conditions.
█ Usage
To use the strategy effectively:
- Adjust the VIDYA lengths (fast and slow) based on your preference for trend sensitivity.
- Use Bollinger Bands as a filter for identifying potential breakout or reversal scenarios.
- Enable the multi-step take profit feature to manage positions dynamically, allowing for partial exits as the price reaches specified ATR or percentage levels.
- Leverage the short trade multiplier for more aggressive take profit levels in bearish markets.
This strategy can be applied to different asset classes, including equities, forex, and cryptocurrencies. Adjust the input parameters to suit the volatility and characteristics of the asset being traded.
█ Default Settings
The default settings for this strategy have been designed for moderate to trending markets:
- Fast VIDYA Length (10): A shorter length for quick responsiveness to price changes. Increasing this length will reduce noise but may delay signals.
- Slow VIDYA Length (30): The slow VIDYA is set longer to capture broader market trends. Shortening this value will make the system more reactive to smaller price swings.
- Minimum Slope Threshold (0.05): This threshold helps filter out weak trends. Lowering the threshold will result in more trades, while raising it will restrict trades to stronger trends.
Multi-Step Take Profit Settings
- ATR Multipliers (2.618, 5.0, 10.0): These values define how far the price should move before taking profit. Larger multipliers widen the profit-taking levels, aiming for larger trend moves. In higher volatility markets, these values might be adjusted downwards.
- Percentage Levels (3%, 8%, 17%): These percentage levels define how much the price must move before taking profit. Increasing the percentages will capture larger moves, while smaller percentages offer quicker exits.
- Short TP Multiplier (1.5): This multiplier applies more aggressive take profit levels for short trades. Adjust this value based on the aggressiveness of your short trade management.
Each of these settings directly impacts the performance and risk profile of the strategy. Shorter VIDYA lengths and lower slope thresholds will generate more trades but may result in more whipsaws. Higher ATR multipliers or percentage levels can delay profit-taking, aiming for larger trends but risking partial gains if the trend reverses too early.

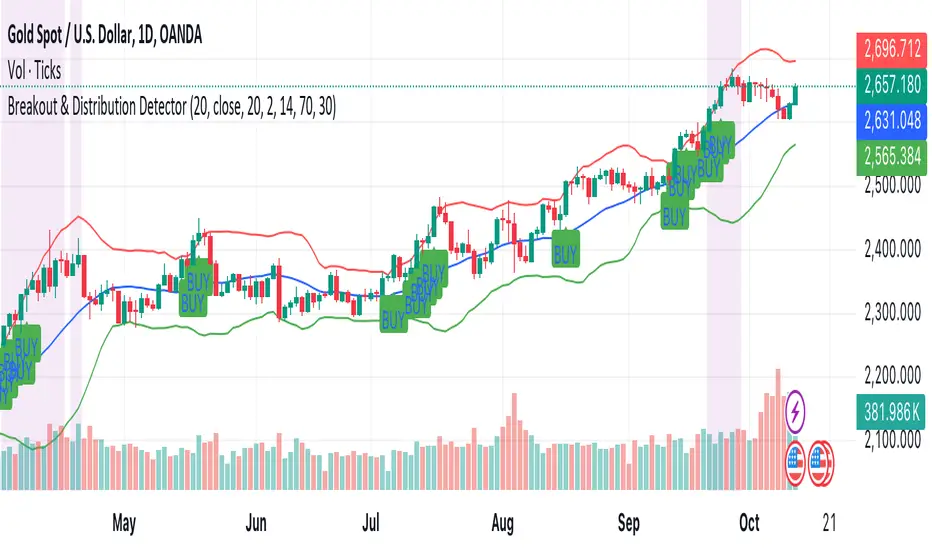
Breakout & Distribution DetectorHow the Script Works:
1. Bollinger Bands:
• The upper and lower Bollinger Bands are used to detect volatility and potential breakouts. When the price closes above the upper band, it’s considered a bullish breakout. When the price closes below the lower band, it’s a bearish breakout.
2. RSI (Relative Strength Index):
• The RSI is used for momentum confirmation. A bullish breakout is confirmed if the RSI is above 50, and a bearish breakout is confirmed if the RSI is below 50.
• If the RSI enters overbought (above 70) or oversold (below 30) levels, it signals a distribution phase, indicating the market may be ready to reverse or consolidate.
3. Moving Average:
• A simple moving average (SMA) of 20 periods is used to ensure we’re trading in the direction of the trend. Breakouts above the upper Bollinger Band are valid if the price is above the SMA, while breakouts below the lower Bollinger Band are valid if the price is below the SMA.
4. Signals and Alerts:
• BUY Signal: A green “BUY” label appears below the candle if a bullish breakout is detected.
• SELL Signal: A red “SELL” label appears above the candle if a bearish breakout is detected.
• Distribution Phase: The background turns purple if the market enters a distribution phase (RSI in overbought or oversold territory).
• Alerts: You can set alerts based on these conditions to get notifications for breakouts or when the market enters a distribution phase.
The Bar Counter Trend Reversal Strategy [TradeDots]Overview
The Bar Counter Trend Reversal Strategy is designed to identify potential counter-trend reversal points in the market after a series of consecutive rising or falling bars.
By analyzing price movements in conjunction with optional volume confirmation and channel bands (Bollinger Bands or Keltner Channels), this strategy aims to detect overbought or oversold conditions where a trend reversal may occur.
🔹How it Works
Consecutive Price Movements
Rising Bars: The strategy detects when there are a specified number of consecutive rising bars (No. of Rises).
Falling Bars: Similarly, it identifies a specified number of consecutive falling bars (No. of Falls).
Volume Confirmation (Optional)
When enabled, the strategy checks for increasing volume during the consecutive price movements, adding an extra layer of confirmation to the potential reversal signal.
Channel Confirmation (Optional)
Channel Type: Choose between Bollinger Bands ("BB") or Keltner Channels ("KC").
Channel Interaction: The strategy checks if the price interacts with the upper or lower channel lines: For short signals, it looks for price moving above the upper channel line. For long signals, it looks for price moving below the lower channel line.
Customization:
No. of Rises/Falls: Set the number of consecutive bars required to trigger a signal.
Volume Confirmation: Enable or disable volume as a confirmation factor.
Channel Confirmation: Enable or disable channel bands as a confirmation factor.
Channel Settings: Adjust the length and multiplier for the Bollinger Bands or Keltner Channels.
Visual Indicators:
Entry Signals: Triangles plotted on the chart indicate potential entry points:
Green upward triangle for long entries.
Red downward triangle for short entries.
Channel Bands: The upper and lower bands are plotted for visual reference.
Strategy Parameters:
Initial Capital: $10,000.
Position Sizing: 80% of equity per trade.
Commission: 0.01% per trade to simulate realistic trading costs.
🔹Usage
Set up the number of Rises/Falls and choose whether if you want to use channel indicators and volume as the confirmation.
Monitor the chart for triangles indicating potential entry points.
Consider the context of the overall market trend and other technical factors.
Backtesting and Optimization:
Use TradingView's Strategy Tester to evaluate performance.
Adjust parameters to optimize results for different market conditions.
🔹 Considerations and Recommendations
Risk Management:
The strategy does not include built-in stop-loss or take-profit levels. It's recommended to implement your own risk management techniques.
Market Conditions:
Performance may vary in different market environments. Testing and adjustments are advised when applying the strategy to new instruments or timeframes.
No Guarantee of Future Results:
Past performance is not indicative of future results. Always perform due diligence and consider the risks involved in trading.

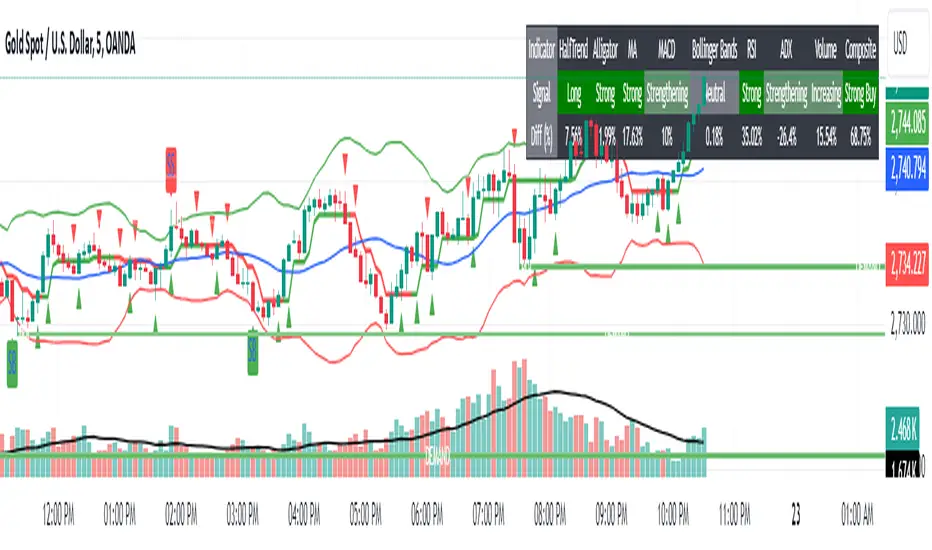
Trend, Momentum and Price value analysis Extended [deepakks444]Trend, Momentum, and Price Value Analysis Extended
This Pine Script™ indicator is designed to offer traders a comprehensive overview of price trends, momentum, and market strength through the use of several widely-recognized technical analysis tools. The indicator integrates multiple signals and plots directly on the chart, as well as a customizable table to help visually organize and interpret the data. Here’s an overview of the key features included:
Key Features:
VWAP (Volume-Weighted Average Price): Calculates the average price weighted by volume to give insight into whether the price is above or below the market's fair value.
Alligator Indicator: Uses a combination of three moving averages (jaw, teeth, and lips) to help identify trending conditions.
Supertrend: A trend-following indicator that signals potential buy or sell opportunities based on price movements relative to a dynamically calculated support/resistance line.
20-period Moving Average (MA): A basic moving average to smooth out price data and highlight the underlying trend.
MACD (Moving Average Convergence Divergence): Helps identify changes in the strength, direction, and momentum of a trend.
Volume with Moving Average: Compares current volume against its moving average to identify potential volume spikes.
RSI (Relative Strength Index): Measures the speed and change of price movements, signaling overbought or oversold conditions.
ADX (Average Directional Index): An indicator used to quantify trend strength, helping traders determine whether the market is trending or in a range.
Pivot Points: Calculates daily pivot points and identifies support and resistance levels based on price movements.
Bollinger Bands: A volatility indicator that uses standard deviation to highlight potential overbought or oversold conditions.
Customization Options:
Modify the length of the price and volume moving averages.
Adjust RSI thresholds for buy and sell signals.
Set the thresholds for ADX to differentiate between weak, average, and strong trends.
Toggle the visibility of the 20-period MA and Supertrend on the chart.
Choose to display the percentage difference between the current price and indicator values in the table.
Table Display:
The indicator includes a table that summarizes the status of all signals, showing:
Signal (Buy/Sell/Neutral): Based on each indicator's interpretation of price action.
Percentage Difference: Optional display of how far the price is from the reference level (e.g., the difference between the price and VWAP, Supertrend line, or Moving Average).
The table allows traders to quickly assess the current market conditions across several indicators in one place, making it easier to gauge overall market sentiment.
Signal Logic:
This indicator uses a scoring system to calculate the percentage of indicators signaling a buy or sell. If the buy or sell score reaches 70% or higher, the indicator will plot buy or sell signals on the chart. The combined signal logic is displayed in the table as "Buy," "Sell," or "No Signal," based on the majority of the contributing indicators.
Intended Use:
This tool is designed to assist traders in their technical analysis by consolidating multiple popular indicators into one script. It provides a clear visual representation of various market signals, helping traders to make informed decisions about potential trade entries and exits. However, this indicator is for educational purposes and should not be used as financial advice. Traders should always use proper risk management and conduct their own research before making any trading decisions.
Disclaimer: This script is for educational purposes only and does not constitute financial advice. Trading involves risk, and past performance of an indicator does not guarantee future results. Please use it alongside proper risk management practices.
BBPCT For Loop | viResearchBBPCT For Loop | viResearch
Conceptual Foundation and Innovation
The "BBPCT For Loop" script is designed to combine Bollinger Bands with a percentage calculation to identify market trends and mean reversion opportunities. Bollinger Bands Percentage (BBPCT) evaluates where the current price stands between the upper and lower bands of Bollinger Bands, providing a more dynamic view of price extremes. This script incorporates a loop-based scoring mechanism that further refines the analysis, giving traders a clearer indication of potential trend shifts or reversion zones.
By incorporating both the BBPCT and a for-loop system, this indicator enhances the ability to spot overbought or oversold conditions, helping traders make more informed decisions based on market momentum.
Technical Composition and Calculation
The "BBPCT For Loop" script uses Bollinger Bands to establish dynamic upper and lower boundaries around price, calculated using standard deviation. Here’s how the core components are structured:
Bollinger Bands Percentage (BBPCT): BBPCT calculates the position of the price relative to the upper and lower Bollinger Bands. This creates a percentage range from 0% to 100%, with values near 0% indicating proximity to the lower band (potentially oversold) and values near 100% signaling closeness to the upper band (potentially overbought).
For-Loop Scoring System: The script employs a loop that iterates over a range of values. For each value, it evaluates whether the BBPCT is above or below a threshold, adjusting the score accordingly. This scoring mechanism helps detect when price action is shifting toward a bullish or bearish trend.
Mean Reversion Zones: The script defines specific "green" and "red" zones based on the BBPCT value. These zones visually highlight potential mean reversion areas where price may reverse direction.
Features and User Inputs
This script offers a variety of customizable inputs that allow traders to fine-tune it for different market conditions:
BBPCT Length: Controls the lookback period for calculating the Bollinger Bands. Adjusting this period affects how reactive the indicator is to price changes.
Standard Deviation Multiplier: This input adjusts the width of the Bollinger Bands, influencing the sensitivity of the BBPCT calculation.
Thresholds: The script includes user-defined thresholds for detecting uptrends and downtrends based on the BBPCT score. Traders can adjust these thresholds to make the indicator more or less sensitive to market shifts.
Bar Coloring: The script optionally colors bars based on detected trends, providing a visual cue for potential bullish or bearish conditions.
Alerts: Alerts are triggered when the BBPCT crosses above or below the user-defined thresholds, notifying traders of potential long or short opportunities.
Practical Applications
The "BBPCT For Loop" script is ideal for traders who employ mean reversion or trend-following strategies. Its application can be particularly effective in:
Spotting Overbought and Oversold Conditions: The BBPCT provides a dynamic measure of where the price is within the Bollinger Bands, helping to detect when the market is approaching an extreme, signaling potential reversion opportunities.
Confirming Trend Shifts: The for-loop scoring mechanism offers a more detailed analysis of whether the market is entering an uptrend or downtrend, helping traders to time their entries or exits more effectively.
Mean Reversion Trading: The inclusion of green and red zones helps highlight areas where the price may be more likely to revert to the mean, providing valuable insight for mean reversion traders.
Advantages and Strategic Value
This script enhances the traditional Bollinger Bands indicator by introducing a loop-based scoring system and mean reversion zones. These additions make the indicator more versatile and adaptable to various trading styles. By dynamically adjusting to market conditions, the BBPCT For Loop helps reduce the risk of false signals and improves the accuracy of identifying overbought or oversold conditions.
Summary and Usage Tips
The "BBPCT For Loop" script is a powerful tool that combines the flexibility of Bollinger Bands with a robust scoring system. Traders can use it to identify overbought or oversold conditions, confirm trend shifts, and improve the timing of trades. Adjust the Bollinger Bands length and standard deviation multiplier based on the asset you're trading to get the best results.
Remember to test the script across different market conditions and timeframes to understand how it performs. Backtests are essential for gauging its effectiveness, but keep in mind that past performance does not guarantee future results.

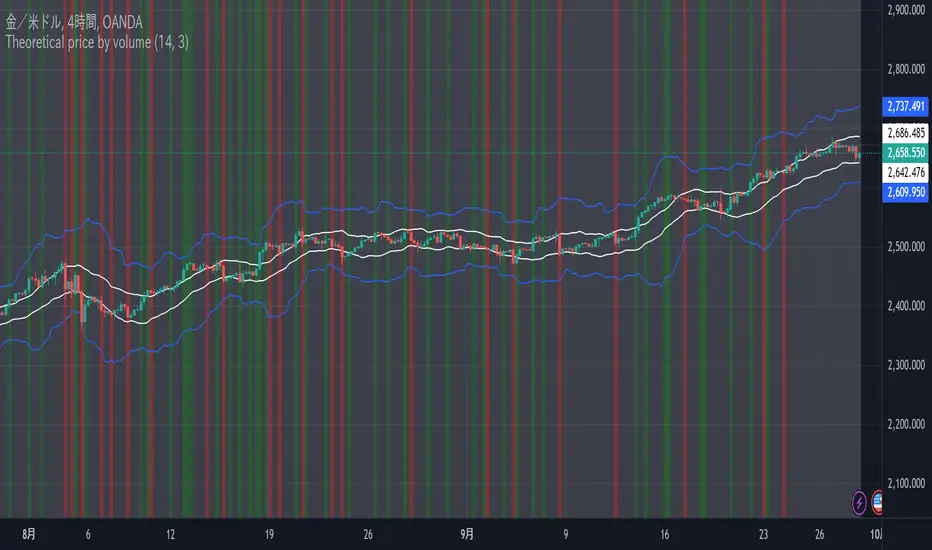
Theoretical price by volumeThis code is used to calculate a theoretical price range based on volume and price change and display it on the chart. Specifically, it calculates the “theoretical price volatility” based on price changes and volume, from which the upper and lower price limits are derived.
The price volatility is calculated by dividing the price change by the volume as the change unit volume.
Based on this volatility, we calculate the theoretical variation relative to the current price (“Theoretical Variance Difference”).
Based on the results, **Theoretical High Price (p_price) and Theoretical Low Price (m_price)** are calculated.
The chart displays the upper and lower bounds of these theoretical prices in color, and also calculates their mean and standard deviation (in the form of a Bollinger band) and plots them.
The background color on the chart indicates whether the price is within the theoretical price range, and at the same time, the mean and standard deviation of the theoretical prices are used to visualize price movements in more detail.
This indicator helps traders understand the impact of volume on price movements and helps them determine if prices are staying within the theoretical range or if there are unusual movements.
Bitcoin CME-Spot Z-Spread - Strategy [presentTrading]This time is a swing trading strategy! It measures the sentiment of the Bitcoin market through the spread of CME Bitcoin Futures and Bitfinex BTCUSD Spot prices. By applying Bollinger Bands to the spread, the strategy seeks to capture mean-reversion opportunities when prices deviate significantly from their historical norms
█ Introduction and How it is Different
The Bitcoin CME-Spot Bollinger Bands Strategy is designed to capture mean-reversion opportunities by exploiting the spread between CME Bitcoin Futures and Bitfinex BTCUSD Spot prices. The strategy uses Bollinger Bands to detect when the spread between these two correlated assets has deviated significantly from its historical norm, signaling potential overbought or oversold conditions.
What sets this strategy apart is its focus on spread trading between futures and spot markets rather than price-based indicators. By applying Bollinger Bands to the spread rather than individual prices, the strategy identifies price inefficiencies across markets, allowing traders to take advantage of the natural reversion to the mean that often occurs in these correlated assets.
BTCUSD 8hr Performance
█ Strategy, How It Works: Detailed Explanation
The strategy relies on Bollinger Bands to assess the volatility and relative deviation of the spread between CME Bitcoin Futures and Bitfinex BTCUSD Spot prices. Bollinger Bands consist of a moving average and two standard deviation bands, which help measure how much the spread deviates from its historical mean.
🔶 Spread Calculation:
The spread is calculated by subtracting the Bitfinex spot price from the CME Bitcoin futures price:
Spread = CME Price - Bitfinex Price
This spread represents the difference between the futures and spot markets, which may widen or narrow based on supply and demand dynamics in each market. By analyzing the spread, the strategy can detect when prices are too far apart (potentially overbought or oversold), indicating a trading opportunity.
🔶 Bollinger Bands Calculation:
The Bollinger Bands for the spread are calculated using a simple moving average (SMA) and the standard deviation of the spread over a defined period.
1. Moving Average (SMA):
The simple moving average of the spread (mu_S) over a specified period P is calculated as:
mu_S = (1/P) * sum(S_i from i=1 to P)
Where S_i represents the spread at time i, and P is the lookback period (default is 200 bars). The moving average provides a baseline for the normal spread behavior.
2. Standard Deviation:
The standard deviation (sigma_S) of the spread is calculated to measure the volatility of the spread:
sigma_S = sqrt((1/P) * sum((S_i - mu_S)^2 from i=1 to P))
3. Upper and Lower Bollinger Bands:
The upper and lower Bollinger Bands are derived by adding and subtracting a multiple of the standard deviation from the moving average. The number of standard deviations is determined by a user-defined parameter k (default is 2.618).
- Upper Band:
Upper Band = mu_S + (k * sigma_S)
- Lower Band:
Lower Band = mu_S - (k * sigma_S)
These bands provide a dynamic range within which the spread typically fluctuates. When the spread moves outside of these bands, it is considered overbought or oversold, potentially offering trading opportunities.
Local view
🔶 Entry Conditions:
- Long Entry: A long position is triggered when the spread crosses below the lower Bollinger Band, indicating that the spread has become oversold and is likely to revert upward.
Spread < Lower Band
- Short Entry: A short position is triggered when the spread crosses above the upper Bollinger Band, indicating that the spread has become overbought and is likely to revert downward.
Spread > Upper Band
🔶 Risk Management and Profit-Taking:
The strategy incorporates multi-step take profits to lock in gains as the trade moves in favor. The position is gradually reduced at predefined profit levels, reducing risk while allowing part of the trade to continue running if the price keeps moving favorably.
Additionally, the strategy uses a hold period exit mechanism. If the trade does not hit any of the take-profit levels within a certain number of bars, the position is closed automatically to avoid excessive exposure to market risks.
█ Trade Direction
The trade direction is based on deviations of the spread from its historical norm:
- Long Trade: The strategy enters a long position when the spread crosses below the lower Bollinger Band, signaling an oversold condition where the spread is expected to narrow.
- Short Trade: The strategy enters a short position when the spread crosses above the upper Bollinger Band, signaling an overbought condition where the spread is expected to widen.
These entries rely on the assumption of mean reversion, where extreme deviations from the average spread are likely to revert over time.
█ Usage
The Bitcoin CME-Spot Bollinger Bands Strategy is ideal for traders looking to capitalize on price inefficiencies between Bitcoin futures and spot markets. It’s especially useful in volatile markets where large deviations between futures and spot prices occur.
- Market Conditions: This strategy is most effective in correlated markets, like CME futures and spot Bitcoin. Traders can adjust the Bollinger Bands period and standard deviation multiplier to suit different volatility regimes.
- Backtesting: Before deployment, backtesting the strategy across different market conditions and timeframes is recommended to ensure robustness. Adjust the take-profit steps and hold periods to reflect the trader’s risk tolerance and market behavior.
█ Default Settings
The default settings provide a balanced approach to spread trading using Bollinger Bands but can be adjusted depending on market conditions or personal trading preferences.
🔶 Bollinger Bands Period (200 bars):
This defines the number of bars used to calculate the moving average and standard deviation for the Bollinger Bands. A longer period smooths out short-term fluctuations and focuses on larger, more significant trends. Adjusting the period affects the responsiveness of the strategy:
- Shorter periods (e.g., 100 bars): Makes the strategy more reactive to short-term market fluctuations, potentially generating more signals but increasing the risk of false positives.
- Longer periods (e.g., 300 bars): Focuses on longer-term trends, reducing the frequency of trades and focusing only on significant deviations.
🔶 Standard Deviation Multiplier (2.618):
The multiplier controls how wide the Bollinger Bands are around the moving average. By default, the bands are set at 2.618 standard deviations away from the average, ensuring that only significant deviations trigger trades.
- Higher multipliers (e.g., 3.0): Require a more extreme deviation to trigger trades, reducing trade frequency but potentially increasing the accuracy of signals.
- Lower multipliers (e.g., 2.0): Make the bands narrower, increasing the number of trade signals but potentially decreasing their reliability.
🔶 Take-Profit Levels:
The strategy has four take-profit levels to gradually lock in profits:
- Level 1 (3%): 25% of the position is closed at a 3% profit.
- Level 2 (8%): 20% of the position is closed at an 8% profit.
- Level 3 (14%): 15% of the position is closed at a 14% profit.
- Level 4 (21%): 10% of the position is closed at a 21% profit.
Adjusting these take-profit levels affects how quickly profits are realized:
- Lower take-profit levels: Capture gains more quickly, reducing risk but potentially cutting off larger profits.
- Higher take-profit levels: Let trades run longer, aiming for bigger gains but increasing the risk of price reversals before profits are locked in.
🔶 Hold Days (20 bars):
The strategy automatically closes the position after 20 bars if none of the take-profit levels are hit. This feature prevents trades from being held indefinitely, especially if market conditions are stagnant. Adjusting this:
- Shorter hold periods: Reduce the duration of exposure, minimizing risks from market changes but potentially closing trades too early.
- Longer hold periods: Allow trades to stay open longer, increasing the chance for mean reversion but also increasing exposure to unfavorable market conditions.
By understanding how these default settings affect the strategy’s performance, traders can optimize the Bitcoin CME-Spot Bollinger Bands Strategy to their preferences, adapting it to different market environments and risk tolerances.

ACCScanner[MaximizedTrading]- ACCScanner -
ACCScanner is a highly advanced and versatile TradingView indicator, specifically designed to enhance and simplify your trading experience. Whether you are a beginner or an experienced trader, ACCScanner provides all the tools you need to make informed and timely trading decisions. With a user-friendly settings menu, cutting-edge signal filtering technology, and a comprehensive alert system, ACCScanner ensures that you stay ahead of the market and never miss a key trading opportunity.
This indicator is built to adapt to your unique trading strategy, allowing for full customization and optimization. ACCScanner offers a seamless trading experience by eliminating unnecessary noise, providing only the most relevant signals, and helping you execute trades with confidence.
__________________________________________________________________
🔑 Key Features:
Comprehensive Alert System: Stay ahead of the market with dynamic alerts. A "Signal incoming!" alert is triggered when trade conditions align, followed by a clear "Buy/Sell Signal" when conditions are met. Visual indicators (red for sell, green for buy) appear on the chart.
Clear and Customizable Settings: Easily customize ACCScanner for your trading strategy with a user-friendly settings menu. Switch between Desktop and Mobile modes for optimal performance.
Trading Session Time: Optimize your trading with improved session time settings for maximum efficiency.
Bollinger Bands: These bands measure market volatility, helping you identify strong signals and potential trend reversals.
RSI Bands: The RSI Bands are designed to provide an additional layer of confirmation by showing the strength of a signal. This helps you assess whether a trade setup is reliable or if caution is warranted.
EMA 200: The EMA 200 serves as a trend indicator, helping you identify the overall market direction. You can also choose to take less strong signals, as long as they align with the prevailing trend, ensuring you stay on the right side of the market.
Advanced Signal Filtering: Eliminate unnecessary signals with additional oscillator bands when signal filtering is enabled. The oscillator’s position shows signal strength—more transparent icons indicate weaker signals, focusing only on high-probability trades.
Integrated Stop Loss and Take Profit Options: Protect your trades with a range of stop loss settings, including Wick Multiplier, Fixed Stoploss, or Average Candle Size. Additionally, you can set a custom Risk Ratio for Take Profit levels, ensuring your risk management is aligned with your strategy.
Position Size Calculation: Once your settings are properly configured, ACCScanner can calculate the ideal position size, helping you manage risk and optimize trades effectively.
__________________________________________________________________
🎯 Why Choose ACCScanner?
ACCScanner stands out with its powerful alert system, allowing you to stay ahead of the market without constantly monitoring your charts. After setting up the alerts, you’ll receive a "Signal incoming" notification when a potential trade is forming. Once the conditions are fully met, a clear "Buy/Sell Signal" alert will notify you, enabling swift action—even if you're away from the screen.
The ACCScanner oscillator helps you quickly assess signal strength. The light blue line (RSI) moving outside the dark blue line (Bands) indicates stronger setups, and with the Signal Strength filter, you can further refine signals. Transparent icons represent weaker signals, ensuring you focus only on high-probability trades.
ACCScanner also offers precise Stoploss, Price, and Position Size calculations, built directly into the indicator. This feature helps you manage risk efficiently. With integrated Average Candle Size calculations and customizable stop loss options, ACCScanner ensures you are trading with optimized risk management. Once all settings are correctly configured under 'Account Info', you can use the table values to execute trades with confidence.
What makes ACCScanner worth paying for is its ability to save time and enhance trading efficiency. By providing early alerts, you have time to prepare for key trading opportunities before they fully develop. This proactive approach allows you to focus on making confident decisions at the right moment, without being overwhelmed by excessive information. Additionally, the well-organized table simplifies trading by displaying all the necessary values, so you can focus on executing your strategy seamlessly.
__________________________________________________________________
How to Use the ACCScanner?
⚙️ Setup Alerts
To use the ACCScanner effectively, it's crucial to set up the indicator correctly beforehand. Make sure to configure all the settings under the 'Account Info' section at the bottom of the settings menu. Proper setup is necessary to function correctly!
To set up alerts, first ensure all settings are correctly configured. Then, hover over the indicator with your mouse and click on the three dots that appear. Select 'Add Alert on ACCS ' and configure the alert settings.
🏹 3 Steps to Place a Trade with ACCScanner
Step 1: Wait for the "Signal Incoming" Alert
Once you've set up your alerts, ACCScanner will notify you when a potential trade is forming with the "Signal Incoming" alert. This is your early signal to prepare for a possible trade. At this point, begin observing the market and focus on the key indicators, such as the RSI Bands and Bollinger Bands. Check if the price or RSI is touching or approaching the outer bands, which could indicate a strong setup.
Step 2: Analyze the Situation
While waiting for the final signal, confirm whether the market conditions align with the trade strategy. If the RSI or Bollinger Bands are interacting with their respective boundaries, this strengthens the potential trade signal. Stay ready and keep a close watch on the chart for the final signal.
Step 3: React Quickly to the "Buy/Sell Signal" Alert
When you receive the "Buy/Sell Signal" alert, it means the conditions for the trade are fully met. Act quickly and use the data provided in the ACCScanner table—including Stoploss distance, Stoploss price, and Position size—to place your trade. Ensure all the settings have been configured properly under 'Account Info' beforehand so you can execute the trade smoothly and confidently.
__________________________________________________________________
📌 CONCLUSION
We believe that true success comes from the synergy between the trader and the indicator, rather than relying solely on the tool itself for profitability. While many traders expect an indicator to generate profits on its own, the reality is much more nuanced.
Our goal with ACCScanner is to offer a comprehensive, customizable, and easy-to-use tool that helps traders develop a deeper understanding of market dynamics. By using ACCScanner as a support tool for informed decision-making, any trader can enhance their trading strategy and gain the confidence to act effectively.
__________________________________________________________________
⚠️ Disclaimer
Past performance does not guarantee future results. All content, tools, scripts, articles, & education provided by MaximizedTrading are purely for informational & educational purposes only. Past performance is no guarantee of future results.

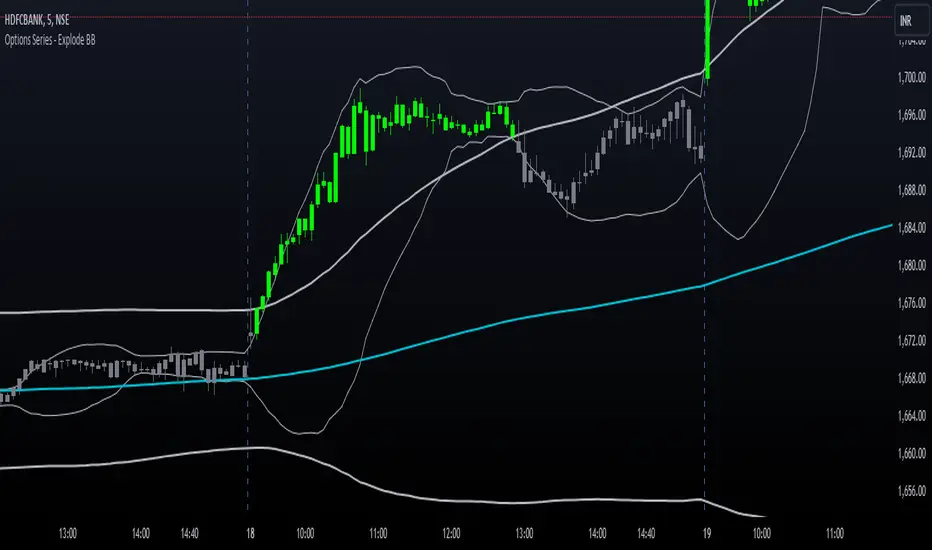
Options Series - Explode BB⭐ Bullish Zone:
⭐ Bearish Zone:
⭐ Neutral Zone:
The provided script integrates Bollinger Bands with different lengths (20 and 200 periods) and applies customized candle coloring based on certain conditions. Here's a breakdown of its importance and insights:
⭐ 1. Dual Bollinger Bands (BBs):
Bollinger Bands (BB) with 20-period length:
This is the standard setting for Bollinger Bands, with a 20-period simple moving average (SMA) as the central line and upper/lower bands derived from the standard deviation.
These bands are used to identify volatility. Wider bands indicate higher volatility, while narrower bands indicate low volatility.
200-period BB:
This is a longer-term indicator providing insight into the overall trend and long-term volatility.
The 200-period bands filter out noise and offer a "macro" view of price movements compared to the 20-period bands, which focus on short-term price actions.
⭐ 2. Overlay of Bollinger Bands and SMA:
The script plots the Bollinger Bands along with the SMA (Simple Moving Average) of the 200-period BB. This gives traders both a short-term (20-period) and long-term (200-period) perspective, which is valuable for detecting major trend shifts or key support and resistance zones.
Using multiple time frames (20-period for short-term and 200-period for long-term) can help traders spot both immediate opportunities and overarching trends.
⭐ 3. Candle Coloring Based on Key Conditions:
Bullish Signal (GreenFluroscent): When the price closes above the upper 200-period Bollinger Band, the candle turns green, indicating a potential bullish breakout.
Bearish Signal (RedFluroscent): If the price closes below the lower 200-period Bollinger Band, the candle turns red, suggesting a bearish breakout.
Neutral or Uncertain Market: Candles are gray when the price remains between the upper and lower bands, indicating a lack of a strong directional bias.
This color-coded visualization allows traders to quickly assess market sentiment based on the Bollinger Bands' extremes.
⭐ 4. Strategic Importance of the Setup:
Multi-timeframe Analysis: Combining short-term (20-period) and long-term (200-period) Bollinger Bands enables traders to assess the market's overall volatility and trend strength. The longer-term bands act as a reference for broader trend direction, while the shorter-term bands can signal shorter-term pullbacks or entry/exit points.
Breakout Identification: By color-coding the candles when prices cross either the upper or lower 200-period bands, the script makes it easier to spot potential breakouts. This can be particularly helpful in trading strategies that rely on volatility expansions or trend-following tactics.
⭐ 5. Customization and Flexibility:
Custom Colors: The script uses distinct fluorescent green and red colors to highlight key bullish and bearish conditions, providing clear visual cues.
Simplicity with Flexibility: Despite its simplicity, the script leaves room for customization, allowing traders to adjust the Bollinger Band multipliers or apply different conditions to candle coloring for more nuanced setups.
This script enhances standard Bollinger Band usage by introducing multi-timeframe analysis, breakout signals, and visual cues for trend strength, making it a powerful tool for both trend-following and mean-reversion strategies.
🚀 Conclusion:
This script effectively simplifies volatility analysis by visually marking bullish, bearish, and neutral zones, making it a robust tool for identifying trade opportunities across multiple timeframes. Its dual-band approach ensures both trend-following and mean-reversion strategies are supported.
Bollinger Bands ForLoopBollinger Bands ForLoop
OVERVIEW
BB ForLoop is an improved version of Bollinger Bands it is designed to calculate an array of values 1 or -1 depending if soruce for calculations is above or below basis.
It takes avereage of values over a range of lengths, providing trend signals smothed based on various moving averages in order to get rid of noise.
It offers flexibility with different signal modes and visual customizations.
TYPE OF SIGNALS
-FAST (MA > MA or MA > 0.99)
-SLOW (MA > 0)
-THRESHOLD CROSSING (when cross above/below treshold set independently for both directions)
-FAST THRESHOLD (when there's change in signal by set margin e.g (0.4 -> 0.2) means bearsih when FT is set to 0.1, when MA is > 0.99 it will signal bullish, when MA < -0.99 it will signal bearish)
Generaly Lime color of line indicates Bullish, Fuchsia indicates Bearish.
This colors are not set in stone so you can change them in settings.
-Bullish Trend, line color is lime
-Bearish Trend, line color is fuchsia
Credit
Idea for this script was from one of indicators created by www.tradingview.com
Warning
Be careful when using this indicator especialy combining DEMA with FT (Fast Treshold).
This indicator can be really noisy depending on the settings, signal mode so it should be used preferably as a part of an strategy not as a stand alone indicator
Remember the lower the timeframe you use the more noise there is.
No single indicator should be used alone when making investment decisions.

Bollinger Bands Enhanced StrategyOverview
The common practice of using Bollinger bands is to use it for building mean reversion or squeeze momentum strategies. In the current script Bollinger Bands Enhanced Strategy we are trying to combine the strengths of both strategies types. It utilizes Bollinger Bands indicator to buy the local dip and activates trailing profit system after reaching the user given number of Average True Ranges (ATR). Also it uses 200 period EMA to filter trades only in the direction of a trend. Strategy can execute only long trades.
Unique Features
Trailing Profit System: Strategy uses user given number of ATR to activate trailing take profit. If price has already reached the trailing profit activation level, scrip will close long trade if price closes below Bollinger Bands middle line.
Configurable Trading Periods: Users can tailor the strategy to specific market windows, adapting to different market conditions.
Major Trend Filter: Strategy utilizes 100 period EMA to take trades only in the direction of a trend.
Flexible Risk Management: Users can choose number of ATR as a stop loss (by default = 1.75) for trades. This is flexible approach because ATR is recalculated on every candle, therefore stop-loss readjusted to the current volatility.
Methodology
First of all, script checks if currently price is above the 200-period exponential moving average EMA. EMA is used to establish the current trend. Script will take long trades on if this filtering system showing us the uptrend. Then the strategy executes the long trade if candle’s low below the lower Bollinger band. To calculate the middle Bollinger line, we use the standard 20-period simple moving average (SMA), lower band is calculated by the substruction from middle line the standard deviation multiplied by user given value (by default = 2).
When long trade executed, script places stop-loss at the price level below the entry price by user defined number of ATR (by default = 1.75). This stop-loss level recalculates at every candle while trade is open according to the current candle ATR value. Also strategy set the trailing profit activation level at the price above the position average price by user given number of ATR (by default = 2.25). It is also recalculated every candle according to ATR value. When price hit this level script plotted the triangle with the label “Strong Uptrend” and start trail the price at the middle Bollinger line. It also started to be plotted as a green line.
When price close below this trailing level script closes the long trade and search for the next trade opportunity.
Risk Management
The strategy employs a combined and flexible approach to risk management:
It allows positions to ride the trend as long as the price continues to move favorably, aiming to capture significant price movements. It features a user-defined ATR stop loss parameter to mitigate risks based on individual risk tolerance. By default, this stop-loss is set to a 1.75*ATR drop from the entry point, but it can be adjusted according to the trader's preferences.
There is no fixed take profit, but strategy allows user to define user the ATR trailing profit activation parameter. By default, this stop-loss is set to a 2.25*ATR growth from the entry point, but it can be adjusted according to the trader's preferences.
Justification of Methodology
This strategy leverages Bollinger bangs indicator to open long trades in the local dips. If price reached the lower band there is a high probability of bounce. Here is an issue: during the strong downtrend price can constantly goes down without any significant correction. That’s why we decided to use 200-period EMA as a trend filter to increase the probability of opening long trades during major uptrend only.
Usually, Bollinger Bands indicator is using for mean reversion or breakout strategies. Both of them have the disadvantages. The mean reversion buys the dip, but closes on the return to some mean value. Therefore, it usually misses the major trend moves. The breakout strategies usually have the issue with too high buy price because to have the breakout confirmation price shall break some price level. Therefore, in such strategies traders need to set the large stop-loss, which decreases potential reward to risk ratio.
In this strategy we are trying to combine the best features of both types of strategies. Script utilizes ate ATR to setup the stop-loss and trailing profit activation levels. ATR takes into account the current volatility. Therefore, when we setup stop-loss with the user-given number of ATR we increase the probability to decrease the number of false stop outs. The trailing profit concept is trying to add the beat feature from breakout strategies and increase probability to stay in trade while uptrend is developing. When price hit the trailing profit activation level, script started to trail the price with middle line if Bollinger bands indicator. Only when candle closes below the middle line script closes the long trade.
Backtest Results
Operating window: Date range of backtests is 2020.10.01 - 2024.07.01. It is chosen to let the strategy to close all opened positions.
Commission and Slippage: Includes a standard Binance commission of 0.1% and accounts for possible slippage over 5 ticks.
Initial capital: 10000 USDT
Percent of capital used in every trade: 30%
Maximum Single Position Loss: -9.78%
Maximum Single Profit: +25.62%
Net Profit: +6778.11 USDT (+67.78%)
Total Trades: 111 (48.65% win rate)
Profit Factor: 2.065
Maximum Accumulated Loss: 853.56 USDT (-6.60%)
Average Profit per Trade: 61.06 USDT (+1.62%)
Average Trade Duration: 76 hours
These results are obtained with realistic parameters representing trading conditions observed at major exchanges such as Binance and with realistic trading portfolio usage parameters.
How to Use
Add the script to favorites for easy access.
Apply to the desired timeframe and chart (optimal performance observed on 4h BTC/USDT).
Configure settings using the dropdown choice list in the built-in menu.
Set up alerts to automate strategy positions through web hook with the text: {{strategy.order.alert_message}}
Disclaimer:
Educational and informational tool reflecting Skyrex commitment to informed trading. Past performance does not guarantee future results. Test strategies in a simulated environment before live implementation

Chieu - Bollinger Bands SMA 50 StrategyOverview
The Custom Bollinger Bands Indicator is a versatile tool designed to help traders identify potential market reversals and optimize their trading strategies. This indicator combines Bollinger Bands with an ATR-based stop-loss mechanism, configurable take-profit levels, and dynamic position sizing to manage risk effectively. By highlighting key market conditions and providing clear visual cues, it enables traders to make informed decisions and execute trades with precision.
Key Features
Bollinger Bands Calculation:
The indicator calculates Bollinger Bands based on a configurable Simple Moving Average (SMA) length.
Standard deviation multiplier is adjustable, allowing traders to fine-tune the width of the bands.
Candlestick Highlighting:
Candles that touch the upper or lower Bollinger Bands are highlighted, indicating potential overbought or oversold conditions.
Reversal candles are identified and highlighted based on specific criteria:
The candle must touch the Bollinger Bands for two consecutive periods.
The reversal candle must have a body at least twice the size of the previous candle's body.
The reversal candle must close in the opposite direction to the previous candle (e.g., a bullish candle following a bearish one).
Stop-Loss and Take-Profit Levels:
Stop-loss levels are calculated using the ATR (Average True Range) indicator, ensuring they are dynamically adjusted based on market volatility.
Two configurable take-profit levels (1R and 2R) are plotted based on the initial risk (distance between entry and stop-loss).
Take-profit and stop-loss lines are visually represented on the chart for easy reference.
Position Sizing and Risk Management:
The indicator includes configurable inputs for account balance, leverage, and risk percentage.
It calculates the nominal value (position size without leverage) and cost value (position size with leverage) based on the specified risk parameters.
Combined labels display SL, TP, nominal value, and cost value, replacing the default "Reversal" text for clear, concise information.
Customization Options:
Users can configure the length of the take-profit lines.
The option to toggle the highlighting of candles touching the Bollinger Bands on or off, while always highlighting the identified reversal candles.
How to Use
Configuration:
Set the desired SMA length and Bollinger Bands multiplier in the input settings.
Configure the ATR length for accurate stop-loss calculations.
Adjust the risk-reward ratio and take-profit line length according to your trading strategy.
Specify your account balance, leverage, and risk percentage for precise position sizing.
Chart Analysis:
Monitor the chart for candles touching the upper or lower Bollinger Bands. These highlights indicate potential overbought or oversold conditions.
Look for highlighted reversal candles, which meet the specified criteria and suggest a potential market reversal.
Use the plotted stop-loss and take-profit lines to manage your trades effectively. The combined labels provide all necessary information (SL, TP, nominal value, and cost value) for quick decision-making.
Execution and Risk Management:
Enter trades based on the reversal candle signals.
Set your stop-loss at the indicated level using the ATR calculation.
Take partial profits at the first take-profit level (1R) and adjust your stop-loss to the entry point to secure the remaining position.
Exit the trade entirely at the second take-profit level (2R) or if the price returns to the adjusted stop-loss level.
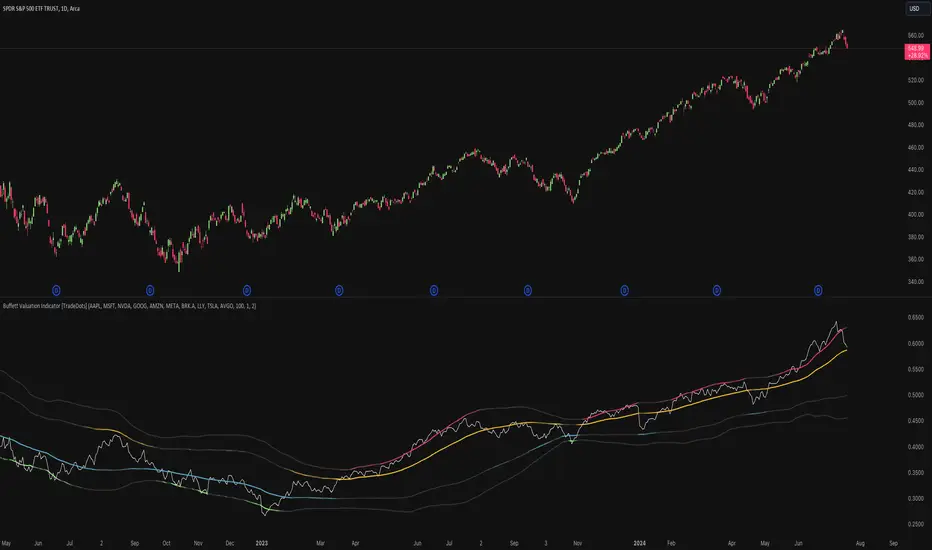
Buffett Valuation Indicator [TradeDots]The Buffett Valuation Indicator (also known as the Buffett Index or Buffett Ratio) measures the ratio of the total United States stock market to GDP.
This indicator helps determine whether the valuation changes in US stocks are justified by the GDP level.
For example, the ratio is calculated based on the standard deviations from the historical trend line. If the value exceeds +2 standard deviations, it suggests that the stock market is overvalued relative to GDP, and vice versa.
This "Buffett Valuation Indicator" is an enhanced version of the original indicator. It applies a Bollinger Band over the Valuation/GDP ratio to identify overvaluation and undervaluation across different timeframes, making it efficient for use in smaller timeframes, e.g. daily or even hourly intervals.
HOW DOES IT WORK
The Buffett Valuation Indicator measures the ratio between US stock valuation and US GDP, evaluating whether stock valuations are overvalued or undervalued in GDP terms.
In this version, the total valuation of the US stock market is represented by considering the top 10 market capitalization stocks.
Users can customize this list to include other stocks for a more balanced valuation ratio. Alternatively, users may use S&P 500 ETFs, such as SPY or VOO, as inputs.
The ratio is plotted as a line chart in a separate panel below the main chart. A Bollinger Band with a default 100-period and multiples of 1 and 2 is used to identify overvaluation and undervaluation.
For instance, if the ratio line moves above the +2 standard deviation line, it indicates that stocks are overvalued, signaling a potential selling opportunity.
APPLICATION
When the indicator is applied to a chart, we observe the ratio line's movements relative to the standard deviation lines. The further the line deviates from the standard deviation lines, the more extreme the overvaluation or undervaluation.
We look for buying opportunities when the Buffett Index moves below the first and second standard deviation lines and sell opportunities when it moves above these lines. This indicator is used as a microeconomic confirmation tool, in combination with other indicators, to achieve higher win-rate setups.
RISK DISCLAIMER
Trading entails substantial risk, and most day traders incur losses. All content, tools, scripts, articles, and education provided by TradeDots serve purely informational and educational purposes. Past performances are not definitive predictors of future results.
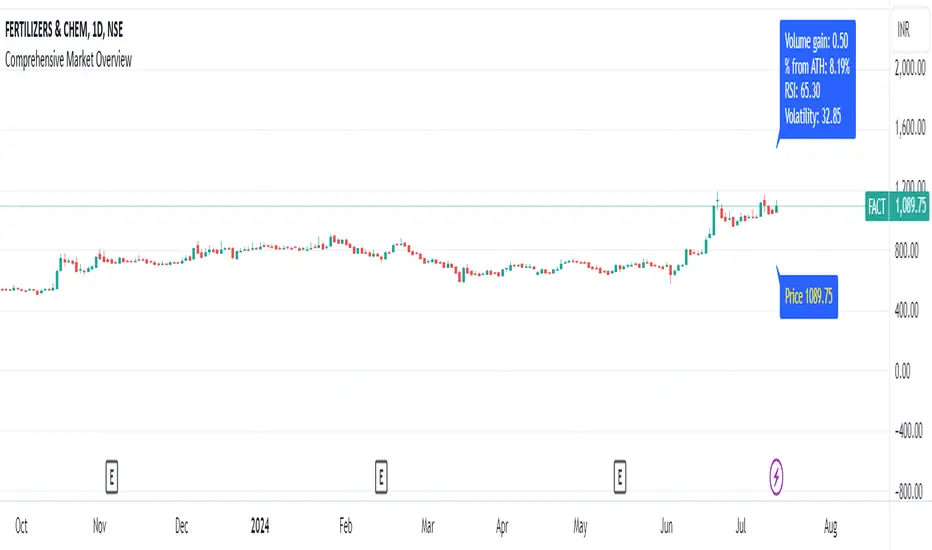
Comprehensive Market Overview1. What is this indicator about?
The "Comprehensive Market Overview" indicator provides a holistic view of the market by incorporating several key metrics:
Close Price: Displays the current close price below each candle.
Percent from All-Time High: Calculates how far the current close price is from the highest high observed over a specified period.
RSI (Relative Strength Index): Measures the momentum of price movements to assess whether a stock is overbought or oversold.
Volume Gain: Computes the current volume relative to its 20-period simple moving average (SMA), indicating volume strength or weakness.
Volatility: Quantifies market volatility by calculating the ratio of the Bollinger Bands' width (difference between upper and lower bands) to the SMA.
2. How it works?
Close Price Label: This label is displayed below each bar, showing the current close price.
Percent from All-Time High: Calculates the percentage difference between the highest high observed (all-time high) and the current close price.
RSI Calculation: Computes the RSI using a 14-period setting, providing insight into whether a stock is potentially overbought or oversold.
Volume Strength: Computes the current volume divided by its 20-period SMA, indicating whether volume is above or below average.
Volatility Calculation: Calculates the width of the Bollinger Bands (based on a 20-period SMA and 2 standard deviations) and expresses it as a percentage of the SMA, providing a measure of market volatility
3.Correct Trend Identification with Indicators
All-Time High (ATH) Levels:
Low Value (Near ATH): When the percent from ATH is low (close to 0%), it indicates that the current price is near the all-time high zone. This suggests strong bullish momentum and potential resistance levels.
High Value (Below ATH): A high percentage from ATH indicates how much the current price is below the all-time high. This could signal potential support levels or opportunities for price recovery towards previous highs.
RSI (Relative Strength Index):
Overbought (High RSI): RSI values above 70 typically indicate that the asset is overbought, suggesting a potential reversal or correction in price.
Oversold (Low RSI): RSI values below 30 indicate oversold conditions, suggesting a potential rebound or price increase.
Swing Trading Strategies
Confirmation with Visual Analysis: Visualizing the chart to confirm ATH levels and RSI readings can provide strong indications of market sentiment and potential trading opportunities:
Bullish Signals: Look for prices near ATH with RSI confirming strength (not yet overbought), indicating potential continuation or breakout.
Bearish Signals: Prices significantly below ATH with RSI showing weakness (not yet oversold), indicating potential for a bounce or reversal.
Volume Confirmation: Comparing current volume to its SMA helps confirm the strength of price movements. Higher current volume relative to the SMA suggests strong price action.
Volatility Assessment: Monitoring volatility through the Bollinger Bands' width ratio helps assess potential price swings. Narrow bands suggest low volatility, while wide bands indicate higher volatility and potential trading opportunities.
4.Entry and Exit Points:
Entry: Consider entering long positions near support levels when prices are below ATH and RSI is oversold. Conversely, enter short positions near resistance levels when prices are near ATH and RSI is overbought.
Exit: Exit long positions near resistance or ATH levels when prices show signs of resistance or RSI becomes overbought. Exit short positions near support levels or when prices rebound from oversold conditions.
Risk Management: Always incorporate risk management techniques such as setting stop-loss orders based on support and resistance levels identified through ATH and RSI analysis.
Implementation Example
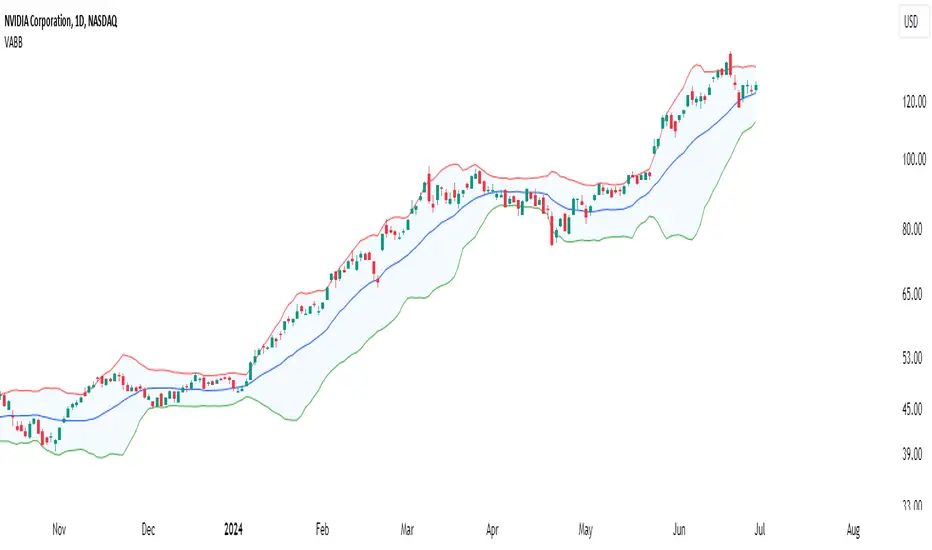
Volume-Adjusted Bollinger BandsThe Volume-Adjusted Bollinger Bands (VABB) indicator is an advanced technical analysis tool that enhances the traditional Bollinger Bands by incorporating volume data. This integration allows the bands to dynamically adjust based on market volume, providing a more nuanced view of price movements and volatility. The key qualities of the VABB indicator include:
1. Dynamic Adjustment with Volume: Traditional Bollinger Bands are based solely on price data and standard deviations. The VABB indicator adjusts the width of the bands based on the volume ratio, making them more responsive to changes in market activity. This means that during periods of high volume, the bands will expand, and during periods of low volume, they will contract. This adjustment helps to reinforce the significance of price movements relative to the central line (VWMA).
2. Volume-Weighted Moving Average (VWMA): Instead of using a simple moving average (SMA) as the central line, the VABB uses the VWMA, which weights prices by volume. This provides a more accurate representation of the average price level, considering the trading volume.
3. Enhanced Signal Reliability: By incorporating volume, the VABB can filter out false signals that might occur in low-volume conditions. This makes the indicator particularly useful for identifying significant price movements that are supported by strong trading activity.
How to Use and Interpret the VABB Indicator
To use the VABB indicator, you need to set it up on your trading platform with the following parameters:
1. BB Length: The number of periods for calculating the Bollinger Bands (default is 20).
2. BB Multiplier: The multiplier for the standard deviation to set the width of the Bollinger Bands (default is 2.0).
3. Volume MA Length: The number of periods for calculating the moving average of the volume (default is 14).
Volume Ratio Smoothing Length: The number of periods for smoothing the volume ratio (default is 5).
Interpretation
1.Trend Identification: The VWMA serves as the central line. When the price is above the VWMA, it indicates an uptrend, and when it is below, it indicates a downtrend. The direction of the VWMA itself can also signal the trend's strength.
2. Volatility and Volume Analysis: The width of the VABB bands reflects both volatility and volume. Wider bands indicate high volatility and/or high volume, suggesting significant price movements. Narrower bands indicate low volatility and/or low volume, suggesting consolidation.
3. Trading Signals:
Breakouts: A price move outside the adjusted upper or lower bands can signal a potential breakout. High volume during such moves reinforces the breakout's validity.
Reversals: When the price touches or crosses the adjusted upper band, it may indicate overbought conditions, while touching or crossing the adjusted lower band may indicate oversold conditions. These conditions can signal potential reversals, especially if confirmed by other indicators or volume patterns.
Volume Confirmation: The volume ratio component helps confirm the strength of price movements. For instance, a breakout accompanied by a high volume ratio is more likely to be sustained than one with a low volume ratio.
Practical Example
Bullish Scenario: If the price crosses above the adjusted upper band with a high volume ratio, it suggests a strong bullish breakout. Traders might consider entering a long position, setting a stop-loss just below the VWMA or the lower band.
Bearish Scenario: Conversely, if the price crosses below the adjusted lower band with a high volume ratio, it suggests a strong bearish breakout. Traders might consider entering a short position, setting a stop-loss just above the VWMA or the upper band.
Conclusion
The Volume-Adjusted Bollinger Bands (VABB) indicator is a powerful tool that enhances traditional Bollinger Bands by incorporating volume data. This dynamic adjustment helps traders better understand market conditions and make more informed trading decisions. By using the VABB indicator, traders can identify significant price movements supported by volume, improving the reliability of their trading signals.
The Volume-Adjusted Bollinger Bands (VABB) indicator is provided for educational and informational purposes only. It is not financial advice and should not be construed as a recommendation to buy, sell, or hold any financial instrument. Trading involves significant risk of loss and is not suitable for all investors. Past performance is not indicative of future results.
MA MACD BB BackTesterOverview:
This Pine Script™ code provides a comprehensive backtesting tool that combines Moving Average (MA), Moving Average Convergence Divergence (MACD), and Bollinger Bands (BB). It is designed to help traders analyze market trends and make informed trading decisions by testing various strategies over historical data.
Key Features:
1. Customizable Indicators:
Moving Average (MA): Smooths out price data for clearer trend direction.
MACD: Measures trend momentum through MACD Line, Signal Line, and Histogram.
Bollinger Bands (BB): Identifies overbought or oversold conditions with upper and lower bands.
2. Flexible Trading Direction: Choose between long or short positions to adapt to different market conditions.
3. Risk Management: Efficiently allocate your capital with customizable position sizes.
4. Signal Generation:
Buy Signals: Triggered by crossovers for MACD, MA, and BB.
Sell Signals: Triggered by crossunders for MACD, MA, and BB.
5. Automated Trading: Automatically enter and exit trades based on signal conditions and strategy parameters.
How It Works:
1. Indicator Selection: Select your preferred indicator (MA, MACD, BB) and trading direction (Long/Short).
2. Risk Management Configuration: Set the percentage of capital to allocate per position to manage risk effectively.
3.Signal Detection: The algorithm identifies and plots buy/sell signals directly on the chart based on the chosen indicator.
4. Trade Execution: The strategy automatically enters and exits trades based on signal conditions and configured strategy parameters.
Use Cases:
- Backtesting: Evaluate the effectiveness of trading strategies using historical data to understand potential performance.
- Strategy Development: Customize and expand the strategy to incorporate additional indicators or conditions to fit specific trading styles.
ADDONS That Affect Strategy:
1. Indicator Parameters:
Adjustments to the settings of MACD (e.g., fast length, slow length), MA (e.g., length), and BB (e.g., length, multiplier) will directly impact the detection of signals and the strategy's performance.
2. Trading Direction:
Changing the trading direction (Long/Short) will alter the entry and exit conditions based on the detected signals.
3. Risk Management Settings:
Modifying the position size percentage affects capital allocation and overall risk exposure per trade.
ADDONS That Do Not Affect Strategy:
1. Visual Customizations:
Changes to the color, shape, and style of the plotted lines and signals do not impact the core functionality of the strategy but enhance visual clarity.
2. Text and Labels:
Modifying text labels for the signals (such as renaming "Buy MACD" to "MACD Buy Signal") is purely cosmetic and does not influence the strategy’s logic or outcomes.
Notes:
- Customization: The indicator is highly customizable to fit various trading styles and market conditions.
- Risk Management: Adjust position sizes and risk parameters according to your risk tolerance and account size.
- Optimization: Regularly backtest and optimize parameters to adapt to changing market dynamics for better performance.
Getting Started:
-Add the script to your chart.
-Adjust the input parameters to suit your analysis preferences.
-Observe the marked buy and sell signals on your chart to make informed trading decisions.

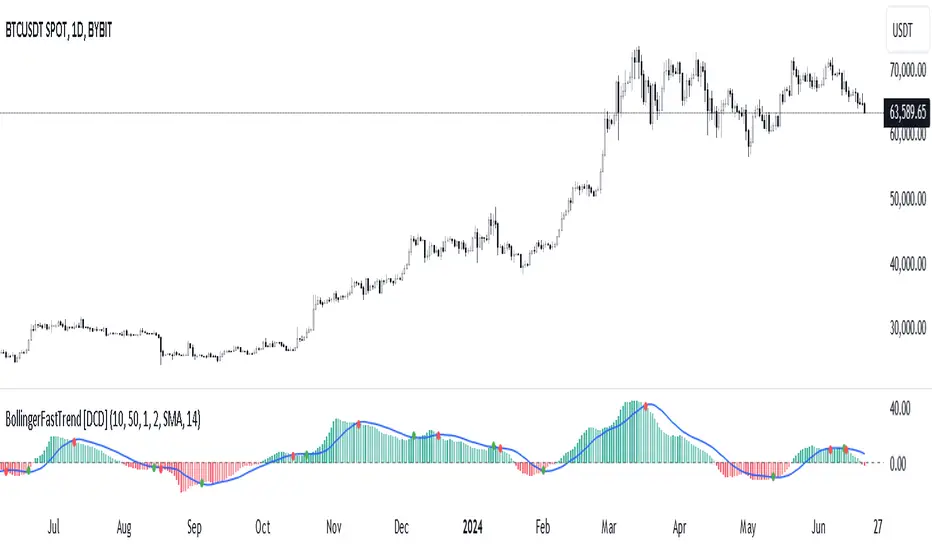
Bollinger Bands Fast Trend Indicator [DCD]Description:
The Bollinger Bands Fast Trend Detector indicator is an advanced tool designed to provide traders with more precise trend detection and clearer entry and exit signals. This script builds upon the traditional Bollinger Bands indicator by adding customizable standard deviations and incorporating multiple moving averages to enhance the accuracy of the signals.
Main Features:
1. **Customizable Bollinger Bands**:
- Each Bollinger Band has its own standard deviation setting, allowing for more granular control and better trend detection.
- The short Bollinger Band is set to a 10-period SMA for faster trend recognition.
2. **Multiple Moving Averages**:
- The indicator includes several types of moving averages (SMA, EMA, LSMA, HMA, WMA) applied to the Bollinger Trend value, giving traders flexibility to choose the best fit for their strategy.
3. **Crossover and Crossdown Detection**:
- The script identifies crossover and crossdown points between the Bollinger Trend value and the selected moving average, marking potential buy and sell signals with green and red circles, respectively.
4. **Color-Coded Histogram**:
- The histogram bars are color-coded to indicate the strength and direction of the trend, making it easy to visualize market conditions at a glance.
Instructions:
1. **Adding the Script to Your Chart**:
- Open your TradingView chart and add the Bollinger Bands Fast Trend Detector indicator.
2. **Adjusting Parameters**:
- Customize the Bollinger Bands and moving average settings according to your trading preferences:
- `Short BB Length` (default: 10): Adjusts the length of the short Bollinger Band.
- `Long BB Length` (default: 50): Adjusts the length of the long Bollinger Band.
- `StdDev` (for both bands): Sets the standard deviation multiplier.
- `Moving Average Type`: Choose between SMA, EMA, LSMA, HMA, and WMA.
- `Moving Average Length` (default: 14): Sets the length of the moving average.
3. **Interpreting the Output**:
- Observe the BBTrend and moving average plots on your chart.
- Look for green circles indicating crossover points (potential buy signals) and red circles indicating crossdown points (potential sell signals).
- Use the color-coded histogram bars to assess the strength and direction of the trend.
Configurable Parameters:
- `shortLengthInput` (default: 10): Length of the short Bollinger Band.
- `longLengthInput` (default: 50): Length of the long Bollinger Band.
- `shortDevMultInput` (default: 1.0): Standard deviation multiplier for the short Bollinger Band.
- `longDevMultInput` (default: 2.0): Standard deviation multiplier for the long Bollinger Band.
- `maTypeInput` (default: SMA): Type of moving average (options: SMA, EMA, LSMA, HMA, WMA).
- `maLengthInput` (default: 14): Length of the moving average.
Code Explanation:
The script calculates two sets of Bollinger Bands with distinct lengths and standard deviations. The difference between the lower bands and upper bands is normalized by the short middle band to compute the BBTrend value. A selected moving average is then applied to this BBTrend value. The script plots the BBTrend, the moving average, and uses color-coded histogram bars to represent trend strength and direction. It also identifies and marks crossover and crossdown points to provide potential trading signals.
Disclaimer:
This script is for educational purposes only and should not be considered financial advice. Always perform your own analysis before making any trading decisions.
Dynamic Bollinger Bands with Momentum and Volume (DBBMV)Overview
The Dynamic Bollinger Bands with Momentum and Volume (DBBMV) indicator enhances the traditional Bollinger Bands by dynamically adjusting their width and position based on momentum and volume. This provides a more responsive and context-aware indication of price volatility and potential reversals.
Key Features
Momentum Adjusted Bands: Adjusts the bands' width based on the momentum indicator, reflecting the rate of change in price.
Volume Weighted Bands: Further adjusts the bands based on trading volume to reflect market activity and price volatility.
Signal Alerts: Provides buy and sell signals based on price action relative to the dynamic bands, helping traders identify entry and exit points.
Customizable Parameters: Allows users to adjust the lookback period, momentum sensitivity, and volume weighting for personalized analysis.
How It Works
The DBBMV indicator starts with the traditional Bollinger Bands, which are calculated using a moving average and standard deviation of the selected price source. The width of these bands is then adjusted based on the momentum of the price, making them more sensitive to price changes. Further adjustments are made based on trading volume, which ensures that the bands accurately reflect current market conditions. This results in a set of dynamic Bollinger Bands that provide more nuanced insights into price volatility and potential reversals.
Usage Instructions
Identify Volatile Periods: Use the dynamically adjusted bands to identify periods of high and low volatility in the market.
Spot Reversals: Look for buy signals when the price crosses above the lower band and sell signals when the price crosses below the upper band.
Adjust Sensitivity: Customize the lookback period, momentum sensitivity, and volume weighting to fine-tune the indicator to your specific trading strategy and market conditions.
Enhance Analysis: Combine the DBBMV indicator with other technical analysis tools for a more comprehensive market analysis.
Volume Confirmation: Use the volume-weighted adjustments to confirm the strength of price movements and potential breakouts.
The Dynamic Bollinger Bands with Momentum and Volume (DBBMV) indicator provides traders with a powerful tool to understand market dynamics better and make informed trading decisions based on adjusted volatility and market activity.

MACD BB v2.00 Indicator CryptoPotato748The MACD BB v2.00 CryptoPotato748 is a custom technical analysis indicator for TradingView that combines the Moving Average Convergence Divergence (MACD) with Bollinger Bands to provide a powerful tool for identifying trend strength and potential trading signals. This indicator is designed to automatically adapt its parameters based on the selected time frame, making it versatile and suitable for various trading strategies and time horizons.
Features
MACD Calculation:
The MACD line is calculated using the difference between the 12-period and 26-period Exponential Moving Averages (EMAs).
The Signal line is the 9-period EMA of the MACD line.
These parameters automatically adjust based on the selected time frame to optimize performance.
Bollinger Bands:
Bollinger Bands are calculated based on the MACD line to identify overbought and oversold conditions.
The bands consist of a 20-period Simple Moving Average (SMA) of the MACD line, with upper and lower bands set 2 standard deviations away.
These parameters also adjust based on the selected time frame for better alignment with market conditions.
Adaptive Time Frames:
The indicator automatically adjusts its MACD and Bollinger Bands parameters based on the selected chart time frame, including 1 minute, 3 minutes, 5 minutes, 15 minutes, 30 minutes, 1 hour, 2 hours, 4 hours, 12 hours, 1 day, 3 days, 1 week, and 1 month.
This ensures the indicator remains effective across various time frames without manual reconfiguration.
Visual Elements:
The upper and lower Bollinger Bands are plotted in gray, with a blue fill between them for easy visualization.
The MACD line is plotted with circle markers, colored lime when above the upper band and red when below the lower band.
A zero line is plotted in orange for reference.
Bar colors change to yellow when the MACD line is above the upper band (indicating a potential buy signal) and aqua when below the lower band (indicating a potential sell signal).
How to Use
Adding to Chart:
Copy and paste the script into the Pine Editor on TradingView.
Click "Add to Chart" to see the indicator in action.
Interpreting Signals:
MACD Above Upper Band (Lime): Indicates strong bullish momentum, potential buy signal.
MACD Below Lower Band (Red): Indicates strong bearish momentum, potential sell signal.
Yellow Bars: Suggest a potential buy condition.
Aqua Bars: Suggest a potential sell condition.
Adaptive Parameters:
The indicator automatically adjusts its parameters based on the selected time frame, ensuring optimal performance across different trading environments.
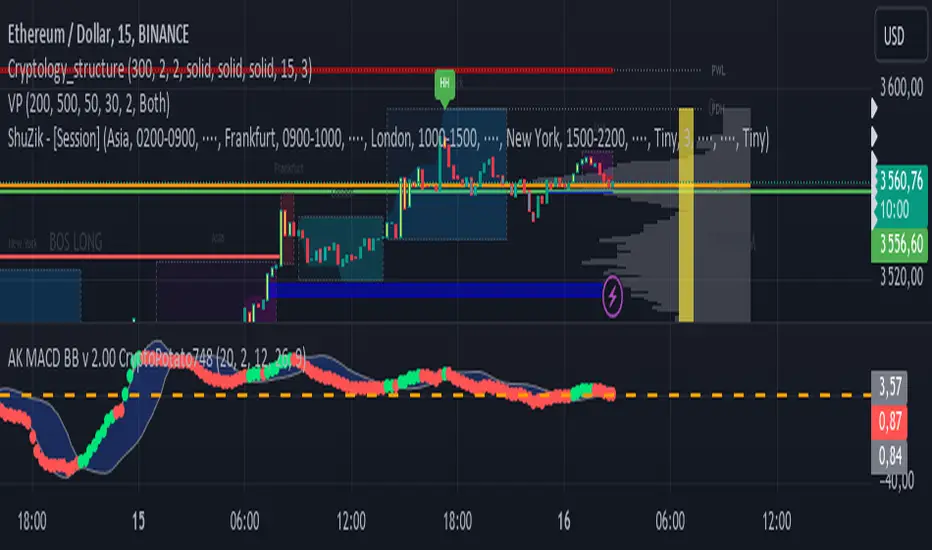
Supertrend + BB + Consecutive Candles + QQE + EMA [Pineify]Overview
This indicator, developed by Pineify, is a comprehensive tool designed to assist traders in making informed decisions by combining multiple technical analysis methods. It integrates Supertrend, Bollinger Bands (BB), Consecutive Candles, Quantitative Qualitative Estimation (QQE), and Exponential Moving Averages (EMA) into a single, cohesive script. This multi-faceted approach allows traders to analyze market trends, volatility, and potential buy/sell signals with greater accuracy.
Key Features
1. Supertrend: Utilizes the Supertrend indicator to identify the prevailing market trend. It provides clear buy and sell signals based on the direction of the trend.
2. Bollinger Bands (BB): Measures market volatility and identifies overbought or oversold conditions. The script calculates the middle, upper, and lower bands, along with the Bollinger Band Width (BBW) and Bollinger Band %B (BBR).
3. Consecutive Candles: Detects sequences of consecutive bullish or bearish candles, providing signals when a specified number of consecutive candles are detected.
4. Quantitative Qualitative Estimation (QQE): Combines the Relative Strength Index (RSI) with a smoothing factor to generate buy and sell signals based on the QQE methodology.
5. Exponential Moving Averages (EMA): Includes both fast and slow EMAs to identify potential crossovers, which are used as buy and sell signals.
How It Works
- Supertrend: The Supertrend indicator is calculated using a factor and ATR length. It plots the trend direction and generates buy/sell signals when the trend changes.
- Bollinger Bands: The BB indicator calculates the middle band as a Simple Moving Average (SMA) of the closing prices. The upper and lower bands are derived by adding and subtracting a multiple of the standard deviation from the middle band.
- Consecutive Candles: This feature counts the number of consecutive candles that close higher or lower than the previous candle. When the count reaches a specified threshold, it generates a buy or sell signal.
- QQE: The QQE indicator smooths the RSI values and calculates the QQE Fast and QQE Slow lines. Buy and sell signals are generated based on the crossover of these lines.
- EMA: The script calculates fast and slow EMAs and generates buy/sell signals based on their crossovers.
How to Use
1. Inputs: Customize the indicator settings through the input parameters:
- Supertrend Factor and ATR Length
- BB Length
- Consecutive Candles Counting
- QQE RSI Length
- Fast and Slow EMA Lengths
- Enable/Disable Alerts for various signals
2. Alerts: Set up alerts for Supertrend, Consecutive Candles, and EMA crossovers. Alerts can be enabled or disabled based on user preference.
3. Visualization: The indicator plots the Supertrend, Bollinger Bands, and EMA lines on the chart. It also marks buy and sell signals with arrows and labels for easy identification.
Concepts Underlying Calculations
- Supertrend: Based on the Average True Range (ATR) to determine the trend direction and potential reversal points.
- Bollinger Bands: Utilizes standard deviation to measure market volatility and identify overbought/oversold conditions.
- Consecutive Candles: A method to detect momentum by counting consecutive bullish or bearish candles.
- QQE: Enhances the traditional RSI by smoothing it and using a dynamic threshold to generate signals.
- EMA: A widely used moving average that gives more weight to recent prices, making it responsive to market changes.
This indicator is a powerful tool for traders looking to combine multiple technical analysis methods into a single, easy-to-use script. By integrating these diverse techniques, it provides a comprehensive view of market conditions and potential trading opportunities.

BBTrend w SuperTrend decision - Strategy [presentTrading]This strategy aims to improve upon the performance of Traidngview's newly published "BB Trend" indicator by incorporating the SuperTrend for better trade execution and risk management. Enjoy :)
█Introduction and How it is Different
The "BBTrend w SuperTrend decision - Strategy " is a trading strategy designed to identify market trends using Bollinger Bands and SuperTrend indicators. What sets this strategy apart is its use of two Bollinger Bands with different lengths to capture both short-term and long-term market trends, providing a more comprehensive view of market dynamics. Additionally, the strategy includes customizable take profit (TP) and stop loss (SL) settings, allowing traders to tailor their risk management according to their preferences.
BTCUSD 4h Long Performance
█ Strategy, How It Works: Detailed Explanation
The BBTrend strategy employs two key indicators: Bollinger Bands and SuperTrend.
🔶 Bollinger Bands Calculation:
- Short Bollinger Bands**: Calculated using a shorter period (default 20).
- Long Bollinger Bands**: Calculated using a longer period (default 50).
- Bollinger Bands use the standard deviation of price data to create upper and lower bands around a moving average.
Upper Band = Middle Band + (k * Standard Deviation)
Lower Band = Middle Band - (k * Standard Deviation)
🔶 BBTrend Indicator:
- The BBTrend indicator is derived from the absolute differences between the short and long Bollinger Bands' lower and upper values.
BBTrend = (|Short Lower - Long Lower| - |Short Upper - Long Upper|) / Short Middle * 100
🔶 SuperTrend Indicator:
- The SuperTrend indicator is calculated using the average true range (ATR) and a multiplier. It helps identify the market trend direction by plotting levels above and below the price, which act as dynamic support and resistance levels. * @EliCobra makes the SuperTrend Toolkit. He is GOAT.
SuperTrend Upper = HL2 + (Factor * ATR)
SuperTrend Lower = HL2 - (Factor * ATR)
The strategy determines market trends by checking if the close price is above or below the SuperTrend values:
- Uptrend: Close price is above the SuperTrend lower band.
- Downtrend: Close price is below the SuperTrend upper band.
Short: 10 Long: 20 std 2
Short: 20 Long: 40 std 2
Short: 20 Long: 40 std 4
█ Trade Direction
The strategy allows traders to choose their trading direction:
- Long: Enter long positions only.
- Short: Enter short positions only.
- Both: Enter both long and short positions based on market conditions.
█ Usage
To use the "BBTrend - Strategy " effectively:
1. Configure Inputs: Adjust the Bollinger Bands lengths, standard deviation multiplier, and SuperTrend settings.
2. Set TPSL Conditions: Choose the take profit and stop loss percentages to manage risk.
3. Choose Trade Direction: Decide whether to trade long, short, or both directions.
4. Apply Strategy: Apply the strategy to your chart and monitor the signals for potential trades.
█ Default Settings
The default settings are designed to provide a balance between sensitivity and stability:
- Short BB Length (20): Captures short-term market trends.
- Long BB Length (50): Captures long-term market trends.
- StdDev (2.0): Determines the width of the Bollinger Bands.
- SuperTrend Length (10): Period for calculating the ATR.
- SuperTrend Factor (12): Multiplier for the ATR to adjust the SuperTrend sensitivity.
- Take Profit (30%): Sets the level at which profits are taken.
- Stop Loss (20%): Sets the level at which losses are cut to manage risk.
Effect on Performance
- Short BB Length: A shorter length makes the strategy more responsive to recent price changes but can generate more false signals.
- Long BB Length: A longer length provides smoother trend signals but may be slower to react to price changes.
- StdDev: Higher values create wider bands, reducing the frequency of signals but increasing their reliability.
- SuperTrend Length and Factor: Shorter lengths and higher factors make the SuperTrend more sensitive, providing quicker signals but potentially more noise.
- Take Profit and Stop Loss: Adjusting these levels affects the risk-reward ratio. Higher take profit percentages can increase gains but may result in fewer closed trades, while higher stop loss percentages can decrease the likelihood of being stopped out but increase potential losses.

Enhanced Reversal DetectionScript Description:
The "Enhanced Reversal Detection" indicator is a powerful tool designed to identify potential market reversals across various financial instruments. It incorporates a sophisticated algorithm that analyzes price action along with key technical indicators such as the Relative Strength Index (RSI), Bollinger Bands, and Moving Average (MA).
How to Use:
Adjustable Parameters: The indicator offers a range of adjustable parameters to cater to different trading preferences and market conditions.
RSI Length: Adjusts the length of the RSI calculation to fine-tune sensitivity.
Overbought Level: Sets the threshold for identifying overbought conditions on the RSI scale.
Oversold Level: Sets the threshold for identifying oversold conditions on the RSI scale.
Bollinger Bands Length: Determines the length of the Bollinger Bands calculation.
Bollinger Bands Multiplier: Adjusts the standard deviation multiplier for the Bollinger Bands, influencing band width.
Moving Average Length: Defines the length of the Moving Average calculation to capture trend direction.
Min Bars Between Signals: Sets the minimum number of bars required between consecutive reversal signals.
ADX Length: Adjusts the length of the Average Directional Index (ADX) calculation.
ADX Threshold: Defines the threshold value for ADX, serving as a filter for reversal signals.
Signal Generation: The indicator generates signals for both bullish and bearish reversals based on predefined criteria. A bullish reversal signal is triggered when the closing price exceeds the lower Bollinger Band and RSI falls below the oversold threshold. Conversely, a bearish reversal signal occurs when the closing price falls below the upper Bollinger Band and RSI surpasses the overbought threshold.
Alerts: Traders can opt to receive alerts for bullish and bearish reversal signals, enabling them to stay informed of potential trading opportunities even when away from the platform.
Publication Readiness:
To ensure readiness for publication in the TradingView public library, the script has been meticulously crafted and documented:
The code is extensively commented to provide clear explanations of parameters, calculations, and signal generation logic.
Best coding practices have been followed to enhance readability and maintainability.
Rigorous testing has been conducted to validate the accuracy and reliability of signal generation across various market conditions.
The script adheres to TradingView's guidelines and policies for script publication, ensuring compliance with platform standards and user expectations.
With its comprehensive features and user-friendly design, the "Enhanced Reversal Detection" indicator is poised to become a valuable asset for traders seeking to identify high-probability reversal opportunities in the financial markets.
