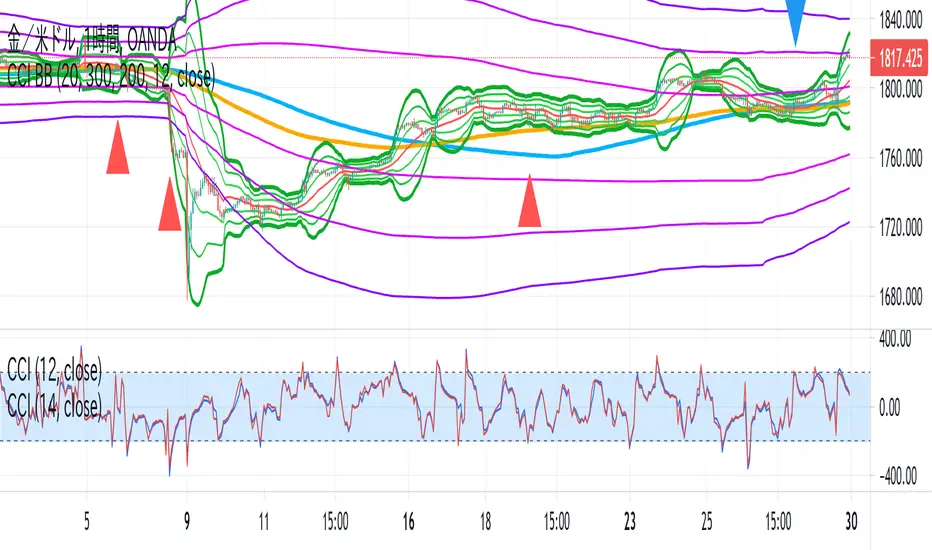
CCI BBThis indicator is the idea of giorno_4_16 .
It shows some indicator lines in your main chart as following:
SMA300, EMA200
BB 20 1,2,3sigma and middle
BB 300 1,2,3sigma and middle
You should put CCI (12, 14) into your separated chart to use the idea.
It shows arrows for registance trading when:
CCI(12) crossovers -200 or corssunders 200 in recent 6bars,
and the price crosses indicator line of SMA200, EMA200 and BB300 1,2,3sigma.
When CCI crossovers -200, you can condisider buying.
When CCI crossunders 200, you can condisider selling.
You should use this indicator in 1H or 4H.
When an arrow appears in 1H, change timeframe to 4H and check the slope of BB20.
If the slope is gentle, take-profit target is MA20 of 1H.
If the slope is steep(ex. CCI crossovers -200 and 4H BB20 go up steeply), take-profit target is BB20 2sigma of 1H.
Bandas de Bollinger (BB)
2 Length Bollinger BandsThis indicator is a two length Bollinger Band implementation. It uses the Simple Moving Average, and adjusts to the period you are looking at: e.g. if you are looking at the day chart, periods are in days. If you are looking at the 5 minute chart, periods are within 5 minute increments.
The foregrounded set of bands is based on the 20 length SMA. So, in the case of the day chart, the successive bands from the middle are 1, 2, 2.5, and 3 standard deviations from the midline (which is a dotted orange line). The upper 2.5 and 3 stddev band is orange and red respectively. When the price gets up into these regions it could indicate a potential sell or short opportunity. The lower 2.5 and 3 stddev bands are colored with lime and green,when the price goes into these regions it indicates a potential buy opportunity.
The backgrounded set of bands is based on the 50 length SMA. So, in the case of the day chart, the successive bands from the middle are 1, 2, 2.5, and 3 standard deviations from the midline (which is a dotted purple line). It is intentionally more transparent so as to be seen as a slower background trend, so that the foreground bands (based on the 20 length SMA) can be interpreted within a developing context based on consideration of the slower period.
There are many other things to consider with Bollinger Bands, such as the 'squeeze' when the bands get narrow, which is often followed by a 'squeeze' up or down. It is best to consider BBs alongside other indicators (leading & lagging) and with consideration of volume in order to confirm or invalidate your thesis before making a trade.

RSI+ChannelbandsThis Indicator displays a normal RSI with overbought/-sold lines which is calculated with donchian channels, pivot channel, bollinger bands and three horizontal lines.
You can averaged the channels, bands and h-lines in any combination or you can use just one of them for calculating the overbought/-sold lines.
The midline is colored in default settings in yellow for upptrending and blue for downtrending.

Bollinger Bands + ADX Strategy// This strategy uses Bollinger Bands to buy when the price
// crosses over the lower band and sell when it crosses down
// the upper band. It only takes trades when the ADX is
// below a certain level, and exits all trades when it's above it.

(FireflyTA) COG AverageCOG Average
COG stands for Center of Gravity. This indicator is an average of multiple COGs based on different sets of timeframes. To get the single COGs this average is based on, use the Market Flow COG (Overlay) indicator.
COG Average is primarily a support and resistance indicator. It can also be used to identify trend and trend changes as well imminent breakouts.
----------------------
About "Center of Gravity"
The COG is an entity that is pulling price back to it frequently (this is why it is called Center of Gravity ) as the law of mean reversion dictates. Mean reversion can be loosely broken up into mean reversion on multiple timeframes, and the COGs are included for ULT (ultra low, 15-60m), L (low, 1h-4h), M (medium, 6h-12H) and H (higher, 1D+) timeframes. As this entity is a new development in TA there is still a lack of scientific evidence that it is reliable. However, if you look at the charts, you will notice that price action will respect this entity and circle around it on the appropriate timeframes most of the time.
The COG is similar to a Bollinger Band , it is using volatility as its main component. However, COGs are aggregated entities looking at more timeframes at the same time, so besides the Time X Volatility perspective that is provided by Bollinger Bands , this entity adds a third dimension by looking at multiple timeframes. The COG is the mean of all the BBs that are included in the calculation, which can be a large number. This makes a COG a meta-analytic entity that is more sensitive to market price action.
The COG helps you in identifying how far and for how long price has been overextended to one side beyond the means. In theory, the probabilities increase dramatically to see a mean reversion to the COG. Watching price interacting with the COG should make clear that the correlations are significant, however there might be differences based on the markets used. The COGs have primarily been tested with the BTCUSD market and for crypto in general.
A way to trade based on COGs is to look for weakness (if price is above the COG) or strength (if price is below the COG) in price action while it is approaching S&R.; If signs of accumulation or distribution arise, and the distance to the COG is meaningful (as well as being maintained for a few candles), it can provide additional backing for your long/short scalping and swing trading ideas. I'd recommend to always use the COG in combination with your knowledge on price action.
By using all COGs at the same time for ULTF, LTF , MTF and HTF you can get a feeling for where price is in the context overall market flow.
----------------------
Deviation Bands
The Deviation Bands are fib-based deviations of the COG. When this module is enabled, the deviation bands are plotted around the COG. The deviations can be adjusted manually as well by changing the values in the indicator UI. The main purpose of these bands is to identify the structure of price movements in relation to the COG distance, i.e. analyzing how long price can maintain levels in an area >X or

BBT‴ | Bollinger Band Trend Zone‴What does it do?
Makes available to you the BB (Bollinger Bands) in a colored format and provies signal on the right side bar according to a Short, Mid or Long period.
If the candles are going out of the Bands too often, then use the Extended Bollinger Band atributes available to create an extra band around the original ones.
How does it work?
The BB drawing is the exact same as the ordinary one. The big deal here is that the BB shade can be represented by a Short, Mid or Long MA period (7, 20 or 55 period), that you want it to be presented in the shade, which is the same as the MA lines you regularly use. When the MA goes down you have a given color and when the MA goes up you have another given color. This way you don't need to keep looking the MA lines, just perceive the current shade color.
What's my filling?
Makes the quick perception very easy, just look to the chart.
Indicator attributes:
- BB shade color acording to trend
- BB band line colors acording to trend
- right side bar signals color acording to trend
- BB shade can be darker, just drop the box and choose the darker version of it
- Extended Bollinger Band to create an extra band around the original ones
To have access to this indicator, please DM me.
Don't contact me in the comment area.
Best Bollinger BandsRemoving the Simple Moving Average and replacing it with the Hull Moving Average (HMA) in the Bollinger Bands (BB), you can not only predict support, resistance, and price movement, but you can also leverage the value of the BB in evaluating when price is over extended in an up and/or down trend.
[KL] Relative Volume StrategyThis strategy will Long when:
Confirmation #1: when volume is relatively high
Confirmation #2: during periods of price consolidation (See )
It exits when either (a) stop loss limit is reached, or when (b) price actions suggest trend is bearish.
Measuring price volatility to assume consolidation:
For each candlestick, we quantify price volatility by referring to the value of standard deviations (2x) of closing prices over a look-back period of 20 candles. This is exactly what the Bollinger Band (“BOLL”) indicates by default.
Knowing the value of standard deviation (2x) of prices (aka the width of lower/upper BOLL bands), we then compare it with ATR (x2) over a user-defined length (can be configured in settings). Volatility is considered to be low, relatively, when the standard deviation (x2) of prices is less than ATR (2x).

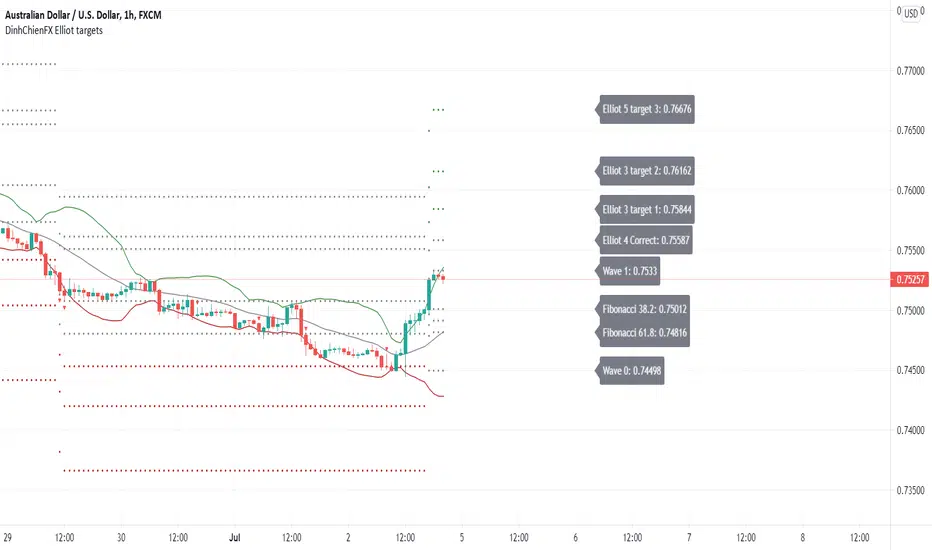
DinhChienFX Elliot targets 1.1We need to make things better and to solve the struggles of traders conquering this ventures capital arena.
I present my new Elliot targets script.
Anyone learning the Elliot wave is very difficult and difficult to understand.
I would like to take a few parts of the Elliot wave theory that is how to calculate the retracement area
and price levels according to the Fibonacci ratio of the Elliot wave. A Then combine the basic indicators Bollinger Band, MACD-H and RSI
to predict the future of the market. And try to automate the above.
The idea in the Elliot targets scenario is to combine:
+ Oscillators indicator (Rsi - Relative Strength Index)
+ Center Oscillators indicator (MACD - Moving Average convergence Divergence)
+ Volatility indicator (BB - Bollinger Band).
There are some option in the script, let see:
- Bollinger Band: calculates trend with signal combination from Bollinger Band indicator.
- RSI: calculates trend with signal combination from RSI.
- MACD: Main indicator of Elliot targets script, with option Histogram highest or lowest
in a week, a month, quarter, year depending on timeframe H1, H4 or Daily... I will show with pictures following photo.
- Label: Option to display the price notice board:
1 - Main bulletins board (default: off): showing all prices at Fibonacci levels (38.2, 50, 61.8, 161.8, 200, 261.8).
2 - Separate bulletin board for 2 trends (up - down): current price at Fibonacci levels (38.2, 50, 61.8, 161.8, 200, 261.8).
- Generate Alerts: 1. Uptrend triggered. 2. Downtrend activated.
Here are a few examples of how the editor uses the above indicators to predict goals:
- The signal is with only MACD:
- The signals combine MACD and Bollinger Band:
- The signals combine MACD and RSI:
- The signals combine MACD + Bollinger band + RSI:
* The label shows:
- Main label is at Uptrend:
- Main label is at Downtrend:
- The separate labels is at Uptrend:
- The separate labels is at Downtrend:
TopTenAlgo 10. SQZMOM Algorithmic Strategy with Alerts & SignalsEN: This Algorithm is a derivative of John Carter's "TTM Squeeze" volatility indicator. Many strategists have taken the indicator on Tradingview with simple moving averages and have looked at the biggest mistake only by dealing with squeeze and exit processes to squeeze. But I used the algorithm to determine where the markets would actually explode. For example, instead of using SMAs , I tested them on the Linear Regression Curve using Volume Weighted Moving Averages and Hull MAs. This gave me the opportunity to develop a more responsive algorithm and identify where the actual explosion would occur. The Gray Circles in the midline show that the market is entering a new jam (in the Bollinger Bands and Keltner Channel). This means low volatility , the market prepares itself for an explosive move (up or down). White Circles mean that it is about to get out of the jam. The Blue Circles, which no one can calculate, now inform that the exit is no longer jammed and that the explosion has taken place.
Mr. Carter recommends that you wait until the first gray after a gray cross and take a position in the momentum direction (for example, if the momentum value is above zero, relax). Exit position when the momentum changes (increase or decrease, this is indicated by a color change). In this algorithm, I tried to achieve good entry points using an additional indicator such as ADX and WaveTrend. To draw the histogram, I used a different method based on Linear Regression . Mr.Carter uses a simple momentum indicator. Strategy, alarms and signals have been added to the indicator so that you can optimize in algorithmic trading.
In summary, this algorithm is a strict algorithm in which additional 4-5 indicators are blended. Conveniences for Everyone ...
TR: Bu Algoritma John Carter'ın "TTM Squeeze" volatilite göstergesinin bir türevidir. Bir çok stratejist Tradingview' de gösterge' yi basit hareketli ortalamalarla ele almış ve en büyük hatayı sadece sıkışma ve sıkışmadan çıkış süreçlerini ele alarak bakmışlardır. Fakat ben algoritmayı piyasaların asıl patlama yapacağı yeri tespit etmek için kullandım. Örneğin SMA' ları kullanmak yerine Hacim Ağırlıklı Hareketli Ortalamaları ve Hull MA' ları kullanarak onları Linerar Regresyon Eğrisinde stress testine tabi tuttum. Buda bana daha duyarlı bir algoritma geliştirmem ve asıl patlamanın olacağı yerleri tespit etmem için fırsat verdi. Orta hattaki Gri Daireler, piyasanın yeni bir sıkışmaya girdiğini gösteriyor ( Bollinger Bantları ve Keltner Kanalı'nda). Bu, düşük volatilite anlamına gelir, piyasa kendisini patlayıcı bir harekete hazırlar (yukarı veya aşağı). Beyaz Daireler ise sıkışmadan çıkmak üzere olduğu anlamına gelir. Hiç kimsenin hesap edemediği Mavi Daireler ise artık sıkışmadan çıkıldığını ve patlamanın gerçekleştiğini haber verir.
Mr.Carter, gri bir çarpı işaretinden sonra ilk griye kadar beklemenizi ve momentum yönünde bir pozisyon almanızı önerir (örneğin, momentum değeri sıfırın üstünde ise, rahat olun). Momentum değiştiğinde pozisyondan çıkın (artırma veya azaltma, bunu o bir renk değişikliği ile belirtilir). Bu algoritmada ben, ADX ve WaveTrend gibi ek bir gösterge kullanarak iyi giriş noktalarıelde etmeye çalıştım. Histogramı çizmek için ise Linear Regresyon tabanlı farklı bir yöntem kullandım. Mr.Carter basit bir momentum göstergesi kullanır. Göstergeye algoritmik işlemlerde optimizasyon yapabilmeniz için strateji, alrmlar ve sinyaller eklenmiştir.
Özetle bu algoritma ek 4-5 göstergenin harmanlandığı sıkı bir algoritmadır. Herkese Kolaylıklar dilerim...

[jav] Mountain Oscillator
Introducing the Mountain Oscillator. Why not trading while admiring the scenery?
The main oscillator line is the black silhouette of the mountains, and each element of the landscape can be seen as a support or resistance - even the mountains far in the horizon, the misty band in the middle and the -1, 0 and 1 lines. (Well, almost every element... the sun is just for fun).
Equalling the heights of the mountains that are far away, or reaching the snow zone, are possible signs of an uptrend ending. On the other hand, stepping into a river is a clear sign of a reversal to the upside soon.
Strong uptrends are evidenced by significant portions of the mountain above the misty zone and/or the 0 line.
By default, the sky turns red/blue/dark gray depending on the trading hours. This option can be unchecked.
Calculations and usage :
The script is based on a modified version of Bollinger Bands. Bandwidth is calculated quite differently from the usual Bollinger indicator (not with the built-in stdev function). There is no need to input a multiplier factor, such as that used in BB - the script calculates it from 'Length' using a custom formula.
The 3 user inputs 'Length' ares recommended to be kept at 200, 100 and 50 period. In that way, the misty area in the landscape corresponds to price crossing EMAs of 50 and 100, and the zero line to EMA 200.
The different colors of the mountain and the horizon represent the Bollinger Bands corresponding to the mentioned periods of 50 and 100, whereas limits of -1 and +1 are those from the 'Length' parameter.
You will find that my coding skills are rudimentary, so any comment/suggestion to improve the script is welcome.
Credits
@everget for the 'Fancy Shapes' script which was used as a reference to draw the sun.

Newton theory (Bollinger Band Breakout)Initial capital 1000 USD
Order size 10%
Commission 0.3% with slippage
Timeframe 4h
This is Simple Bollinger Band Trend find out strategy.
I'm using the usual trailing offset as an exit for this strategy.
using 1x leverage to go long short within 3years backtest result more then 200% for all usd pair.
in next version i will try to find out more optimize sma,std,sl,tp parameter by using freqtrade hyperparameter optimization.
Happy Trading :)

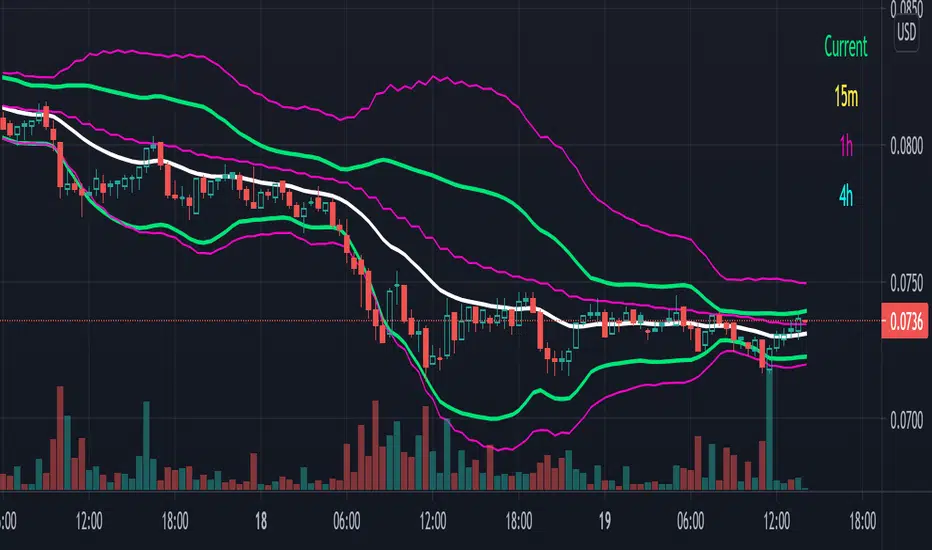
Multiple Timeframe Bollinger Bands - 15m, 1h, 4h plus currentI could not find any other indicator that does this on TradingView. I like to trade whilst looking at multiple time frames and on my desktop I can do that because I have three monitors. I went on vacation recently and I had to trade using my laptop. It sucked tabbing back and forth so I wrote this script.
I personally trade on a 1m chart with indicator data from longer charts so I get the fastest resolution possible. TradingView's horrid and useless idea posting algorithm won't let me post this script in that way so here's a 30 minute chart for posterity.
By default it shows only the time frame you are on but you can use the gear icon on the indicator to turn on 15 minute, 1 hour or 4 hour Bollinger bands. There is a color coded guide on the upper right hand side (yay for the new table feature) so you can see what you are getting yourself into. I have 1h bands and current frame (30m) bands on in the picture.
Use this on a fast chart with slower bands applied. It doesn't work all that well when you use it on a longer time frame with faster bands applied. I use this one a 1m or 5m chart with 15m and either 1h or 4h bands applied typically.
I am making use of this available for free though if you want my code to make adjustments it is available for a small donation to cover my development time; PM me if you are interested. My best bot strategies have all been based on this script so if you want to use this as a jumping off point for your Bollinger band-based strategies this will work well though you do need to buy the code from me for that.
Market Share AnalysisHOW THIS INDICATOR WORKS
-----------------------------------
I've been working on this new indicator to compare, for example, BTCUSD with it's market share or market dominance.
Market Share is the Coin's market cap divided by Total Market Cap. For example, Bitcoin Market Share is currently sitting around 45.7 %
Meaning, Bitcoin is around 45% of the total market of cryptocurrencies.
This indicator has different configurations you should pay attention.
1- Output:
- Market Share Change: this is the percentage change for market share from bar to bar moving up and down from a central line.
- Market Share: this is the close price from the market share symbol selected above.
2- Highlight:
- Divergences: Divergences shows the moment when the price rises and the dominance decreases or vice-versa. Divergences has extra config parameters (explained below).
- Rising/Decreasing: This plots a background red color when the market share price is below its MA(20) line and green background when it's above this line.
3- Show Abnormal signs:
This will print a plus sign in the market share chart when the market dominance rises or decreases too fast (Try changing StDev from 2.0 to 3.0)
4- Divergences:
Divergences has extra config parameters. For example, we want the price to rise or decrease 1% to show a divergence with the market share. Otherwise, it's not as important for us. Also, we can accept to consider an abnormal volume in the divergence or not.
HOW CAN WE INTERPRET THIS INFORMATION
-------------------------------------------------------
I've noticed when bitcoin rises in market share, it's doing or it's preparing for a Big Move. Usuallyl altcoins are dumping and Bitcoin gains the main attention. Best place to be is BTC.
I've also noticed when USDT.D dominance rises, means a big dump is happening or it's close to happen. The capital flow from different coins to Tether.
I have also observed the Bitcoin dominance divergences show us the moments of panic sell in the market. During those moments of extremely selling pressure, the capital flows from Alts to BTC again gaining market share when the price is dropping hard.
MORE INFO
--------------
This indicator allow us to change the symbol to any other like for example ETH.D. I encourage you to go to ETHUSD pair from your favorite exchange in 4H time-frame and change the symbol from this indicator to match ETH.D to have the Ethereum Market share to compare one next to each other.
You're going to find amazing divergences and rising/decreasing moments. Also, try looking at ETHBTC, and then check for ETH.D dominance. Amazing divergences will appear. I hope these are good signs for you too.
To reference any other symbol rather than BTC.D you can easily change the symbol to any other option like:
BTC.D => Ethereum Market Share
ETH.D => Ethereum Market Share
XRP.D => XRP Market Share
All these tickers are from CRYPTOCAP. So the correct ticker name would be for example: CRYPTOCAP:BTC.D to have the Bitcoin Market Dominance calculated by Trading View.
If you like the indicator, please like and comment below.
Good trades!

LIZ TIME DIMENSION (SMA)Each hourly foot can display the moving average line for the same period of time in the same color.
The average moving line that you want to see is displayed by time leg, as well as the long-term Bollinger band that should be noticed by the time leg.
1. You can get a lot of useful information at a glance by displaying the moving average line of the long-term and period setting that many traders are aware of.
○ The period setting of the moving average line displayed in each time and foot is not fixed as usual, but changed the period by time and foot, and the moving average line of the same color
is the same.
It is a moving average line of time (for example, an hourly average line and a four-hour average line).Therefore, the market price is always the same even if the time to see changes
You can see it on a scale.It doesn't happen when you look at it in five minutes, but when you look at it in four hours, it looks like a downward trend.
○ The sensitivity of the rate to the moving average line displayed is very high.
You can see how rate moves, such as trends, are determined, and you can see reality in abstract chart moves
I can feel it.Purple 24 hours (one day) moving average line with 1 minute to 4 hours of foot, Green 1 week moving average line with 5 minute to day.
The sensitivity to the Blue Monthly Movement Average Line, which is displayed from 5 mins to 5 weeks, and Red One Year Movement Average Line, which is displayed from 1 hour to 5 weeks,
is very high.
Just look at whether the rates are moving up or down the moving average line and you'll be able to decide what to look for.
○ What is the positional relation between the moving average line of seven (eight in addition to the weekly moving average line) in the short, short, medium, medium, long, and long periods?
To make the direction and intensity of the trend easier to recognize, it is colored between moving averages to be visible as short- and medium-term clouds.
The three clouds changed color to warm rising clouds and cold falling clouds, depending on the relation of the moving averages.
·Strong upward trend rates when all clouds are unified in either upward or downward direction and are arranged in the order of short-term, medium-term or long-term clouds
·The thickness of the clouds is strong, and when the thickness is increased, the trend rate is strong.
·Trendless market when clouds overlap or the colors of the clouds are mixed
• Range price when rates are moving back and forth between clouds
You can visually and intuitively understand the market conditions, such as .
○ Short-term, short-term, medium- and short-term positional relationships will indicate the timing of the entry payment and the direction of the long-short.It's also written.
In conjunction with this, the duration for which the background color should be long changes to light warm color and warm color, and the duration for short changes to light cold and cold
color.
2. The long-term Bollinger band is displayed so that you can trade with the higher time base than the time base you see.
○ You can ride on a long-term trend by detecting and entering the trend occurrence of long-term feet with short-term feet.
Buy high prices, sell low prices, relax your trend-follow-style tears, and enable stress-free entries.
○ A light, transparent gray filter is displayed between the long-term foot Bollinger band ±1σ which sets the period suitable for the time and foot.
I understand that while the rate is moving in this zone (called gray zone), it is difficult to trend and the price range is small, so it should not be taken care of.
Yes, you can use this filter to prevent deception when the volatility is not present, and if you are out of the filter, you can use the above sign.
By trading in accordance, you can invest in trend-follow tiles while avoiding losses in range markets.
○ Bollinger bands generally display six of ±1σ, ±2σ and ±3σ, but in this indicator, two are inside ±1σ and two are outside ±3σ.
We have added a total of four bands.The former sets up early entries and the latter sets up new reverse positions, expecting a market shift from overheating.
for tips on how to
○ Expansion period (expansion period) due to characteristics of the Bollinger band is a period when volatility is big for trade, and a squeeze period
(Shrinking period) I understand that the volatility is small and it is not suitable for trade.Also, it's a squeeze period, but it's not
You can seize investment opportunities by making you expect the timing to move from contraction to expansion and by watching.
※Valid time difference by series
1 minute, 5 minutes, 15 minutes, 30 minutes 1 Hour, 4 Hour, Daily, Week (Total 8 Hours)
。This is the top version of the Makenai Chart indicator.
。Bolinger band ±3σ with 200 SMA and 200 SMA as the center band is now displayed in common on each hour leg.
。Changing the setting of the foot short-term moving average line for 5 minutes 15 minutes 30 minutes 1 hour to make the short-term cloud easily twisted and to speed up the trading timing.
。Adding ultra short term and short term clouds, which are much shorter than short term clouds, we responded to the requests of traders who want to deal with the roller coaster market and
cut the profit quickly.
(Select short-term clouds, short-term clouds, and ultra-short-term clouds to be used for entry and settlement according to the trade style and the 'dissociation between price and moving average'
which varies depending on the brand, time, and market value.)
。According to the calculation of another indicator (LIZ ADX+DMI), the background has become gray synchronously for a period of inactivity and non-trading.
(In such a period, it is often difficult to follow the trend because the market price is difficult even for lower-level ones, and often it is difficult to follow the trend.)
·Many indicators are counted in one, so you can also view the free version of your account, which has three indicators to display.
The moving avarage lines are SMA. ( I have another version which has EMA lines.)
If you are interested in the invitation-only indicator, please contact us on private chat.
各時間足で同じ期間の移動平均線が同じ色で表示できます。
時間足によって見たい複数の移動平均線が表示される他、その時間足で意識すべき期間設定された長期ボリンジャーバンドも表示されます。
1.長期間でかつ多くのトレーダーが意識する期間設定の移動平均線が表示される事で
以下の有益な情報を一目で得る事ができます。
○各時間足に表示される移動平均線の期間設定は、通常のように期間を一定にするの ではなく、期間を時間足毎に変え同色の移動平均線は同じ時間の移動平均線
(例えば1時間平均線、4時間平均線というように。)としてあります。
このため、見る時間足が変わっても、相場を常に同じ尺度で眺める事ができます。
「5分足では上昇トレンドに、4時間足では下落トレンドに見える。」
という事が起こりません。
○表示される移動平均線に対するレートの感応度は非常に高く、移動平均線にレ-ト
が差し掛かると抵抗を受け反発したり移動平均線を抜けると、勢いよくトレンドが
発生するなど、レートの動きがどのようにして決まっているかを実感でき、抽象的
だったチャートの動きにリアリティーを感じる事ができます。
特に1分足から4時間足まで表示される紫24時間(1日)移動平均線、5分足から
日足まで表示される緑1週間移動平均線、5分足から週足まで表示される青1ヶ月
移動平均線、1時間足から週足まで表示される赤1年移動平均線に対する感応度は
非常に高く、それぞれの移動平均線の上下どちらでレートが推移しているかを見る
だけで、買い目線売り目線の決定ができます。
○短々期、短期、中短期、中期、中長期、長期、長々期の7本
(週足だけはそれに加え最長期の8本)の移動平均線がどのような位置関係にあるか
によってトレンドの方向と強さが認識しやすいよう移動平均線間に着色し短期雲、
中期雲として意識できるようになっています。
3つの雲は移動平均線の関係によりそれぞれ暖色の上昇雲、寒色の下落雲に色が変わり、
・全ての雲が上昇下落どちらかに統一されで短期雲、中期雲、長期雲という順に並
んでいる時は強い上昇トレンド相場
・雲の傾きがきつく厚みがしっかりしている、厚みが増している時は強いトレンド相場
・雲が重なったり、各雲の色がまちまちの時はトレンドレス相場
・雲と雲の間をレートが行ったり来たりしている時はレンジ相場
など、視覚的直感的に相場の状況が理解できます。
表示が可能な時間足は1分、5分、15分 30分、60分、4時間、1日、1週間(合計8つ)です。
※Makenai Chart Indicator の上位版です。
・200SMA,200SMAを中心バンドとするボリンジャーバンド±3σが各時間足に共通で表示されるようになりました。
・5分15分30分1時間足短期移動平均線の設定を変更し、短期雲がねじれやすくし、決済タイミングを早めました。
・短期雲よりさらに短い、超短期雲・短々期雲を追加し、ジェットコースター相場への対応、早めに利確・損切りしたいトレーダーの要望に対応しました。
(トレードスタイルに応じ、また銘柄・時間足・相場つきによって変わる『価格と移動平均線との解離』に応じ、エントリー・決済に使う短期雲・短々期雲・超短期雲を選択します。)
・別のインジケーター(LIZ ADX+DMI)の計算による、ボラティティーがなくトレードに向かない期間は、同期して背景がグレーになるようになりました。
(LIZ ADX+DMIの詳細はこちらのリンクからご覧になれます。 )
(そのような期間は下位足でも難しい相場つき、レンジやランダム相場になっている事が多いため、トレンドフォローが難しい可能性が高いです。)
・たくさんのインジケーターが1つにカウントされるため、表示できるインジケーター3つの制限がある、無料版のアカウントをお使いの方も表示できます
移動平均線はSMAです。(EMA線がある別のバージョンがあります)
招待専用インジに興味ある方はプライベートチャットに連絡をください。

Uber Dank CCI + Captain Beefheart Bollinger Bands ExtraordinareIntroducing, the Uber Dank CCI + Captain Beefheart Bollinger Bands Extraordinaire
Its bollinger bands, CCI and CCI Bollinger Bands all in one.
The color of the CCI shows the condition of the bollinger band on chart.
Close > upper band = red
Close > basis = yellow
Close < basis = blue
Close < lower band = green
Then a bollinger band is printed on the CCI itself,
The background color displays the condition of the CCI bollinger band by the same logic as the CCI color.
CCI > upper band = red
CCI > basis = yellow
CCI < basis = blue
CCI < lower band = green
The exclamation marks tell you when the conditions are coming to an end. They check the last two bars to see if both the CCI and the closing price are under their bollinger bands at the same time for at least one of those bars, and they check the current bar that at least one of those conditions has ended. That is why they will most often print two exclamation marks in a row.
MechaAlgoWhat is MechaAlgo?
MechaAlgo was created to assist any type of trader on a day to day basis. Our intelligent and accurate algorithms turn complex charts into profitable plays, minimizing losses and maximizing profits. We hope that you will find use in the tools and resources we provide, and we will continue to improve on our products in order to take your trading to new heights!
Any Time, Any Market
Our indicators work with real time data on any market. This means that any kind of trader will find our tools useful, regardless of what you are trading.
Feature List
Multiple Signal Modes
Numerous Candle Coloring Modes
Reversal Cloud Overlay
Auto Support & Resistance
Auto Trendlines
Auto Profit Targets
Real Time Informational Dashboard
Multi-Timeframe Trend Panel
Future Trend Projection
Many More Features to Come!
By using this script you acknowledge that MechaAlgo cannot guarantee you profit, and that this product was only created in attempt to benefit traders. You also acknowledge that past performance is not indicative of future results, and that the experience of other users or what you see online may not always be your experience.
Zig Lines with Percent & ValueOverview, Features, and Usage:
The Zig Lines with Percent & Value is an indicator that highlights the highest and lowest points of the market from pivot points and zigzag lines based on the ZigZag Period setting. By a default value of 13 for the ZigZag Period this works well on Bitcoin or other alt coins on the 1 hour or higher timeframe charts.
What makes this indicator unique is that it draws a green line to signify an uptrend or a red line to signify a down trend. It will also show the percent difference between the previous point/line, for example: If you see a -negative percentage point with a red line drawn to it, then you are looking at a low pivot point and then as the green line is drawn to a +positive percentage value the percentage you see is the difference between the two points. This is great to see a trend reversal as you can look at previous pivot points and notice about how far the price moves before it changes direction (trend reversal).
There is an invisible EMA line that is used to assist with coloring the negative vs positive values. The value above or below the percentage is the lowest or highest price at that pivot point . The display of the price at the pivot point depends on your ZigZag Period setting and the timeframe of your chart.
Added Bollinger Bands as it fits perfectly with the visuals of the Zig Lines & Pivots.
Usage of Bollinger Bands:
~As the price or candle gets close to the top or bottom of the Bollinger band it can give you a better confirmation that the pivot location is at it's final place, and the trend is more likely to switch directions.
It’s important to know this indicator should not be used for alerts of any type it does repaint as the green or red line is drawing based on live chart data and it can change depending on the direction of the market. This is a great visual tool for trend analysis or to be used with other indicators as a confirmation for a possible good entry or exit position.
Credits ( and consent to use ):
Credits go to user LonesomeTheBlue for creation of this 'Double Zig Zag with HHLL' script.
The addition of the Value above/below the Percentages is from user Noldo and that script is found here:
The Bollinger Bands setup was suggested by user countseven12 and his script that uses the same BB setup is found here:
References:
1. Chen, James. (2021 March 15). Zig Zag Indicator . Received from http: www.investopedia.com
2. Mitchell, Cory. (2021 April 30). Pivot Points . Received from http: www.investopedia.com

Tradingview ToolkitA new trader's biggest barrier to entry is lack of understanding where they are in terms of time and price and with tradingview free they are often limited to just 1 or 2 extra indicators as many new traders slap on RSI and MACD as 2/3 free ones. While these indicators are fine for trend analysis, its important to know where the price is in relation to time. Thus, this all-in-one script is meant to have a lot of customizable utility to save on indicator spots and act as a hotspot for many common needs.
-2 Sets of VWAP line w/ standard deviation bands with customizable timeframes.
-1 more customizable timeframe VWAP line (no std dev bands) to use as a long time frame reference
-Ability to plot previous VWAP close prices over current timeframe on all VWAP lines w/ basic color changing if price closes above/below
-2 Sets of Bollinger Bands with customizable source length and MA type
-3 customizable moving averages with custom timeframe/resolutions
-Inside candle barcolor repainter to easily notice if a candle was inside the range of the previous candle (price contraction)
Not meant to have everything on at once, but simply a place to enable and disable different things and save spots for more important things

Bollinger Bands OscillatorBollinger Bands as a standalone oscillator. Displays all the information of Bollinger Bands but with a handy oscillator to help locate entries. Entries and exits can be found when oscillator leaves the bands.

[EURUSD60] BB Expansion StrategyOverview
This is a strategy that can be used in the EURUSD 60 time frame.
It is a trend-following method that uses Bollinger Bands Expansions.
The idea of using Bollinger Bands expansion is well known to the general public, but I don’t know any strategy that this idea has been PINE coded.
The three main components of this strategy are as follows.
・Long term BB and Short term BB : When the short term BB expands more than the long term BB, it suggests the occurrence of a trend.
・14EMA of 240 t/f : The direction of 14EMA of the upper time frame is used as the trend direction.
・ATR lines : As a stop-loss line and a take-profit line.
Description
Fig. Long entry pattern
Fig. Short entry pattern
・Description of lines
Gray : Large BB (=Long term BB)
White : Small BB (=Short term BB)
Blue or Red line : Upper t/f EMA(default: 14EMA), blue is up-trend, red is down-trend
Yellow : Stop loss line by ATR(the term is 14)
Purple : Take profit line by ATR(the term is 14)
・Description of strategy
First of all, when the small BB expands more than the large BB, this strategy detects the occurrence of a trend.
Second, When the price crosses over or crosses under small BB basis, this strategy entries long or short to trend direction (by upper time frame 14EMA).
The default stop-loss range is three times ATR value, and the default take-profit target is 1.5 times the stop-loss range (=risk reward ratio is 1.5).

Simple Bollinger Bands + 3 EMAWe know that the number of indicators that we can use is limited, that is why with this indicator the Bollinger Bands + 3 EMAs join and be able to use 4 indicators in 1.
Bollinger Bands (BB)
Bollinger Bands (BB) are a widely popular technical analysis instrument created by John Bollinger in the early 1980’s. Bollinger Bands consist of a band of three lines which are plotted in relation to security prices. The line in the middle is usually a Simple Moving Average (SMA) set to a period of 20 days (the type of trend line and period can be changed by the trader; however a 20 day moving average is by far the most popular). The SMA then serves as a base for the Upper and Lower Bands which are used as a way to measure volatility by observing the relationship between the Bands and price. Typically the Upper and Lower Bands are set to two standard deviations away from the SMA (The Middle Line); however the number of standard deviations can also be adjusted by the trader.
Exponential Moving Average (EMA)
Moving averages visualize the average price of a financial instrument over a specified period of time. However, there are a few different types of moving averages. They typically differ in the way that different data points are weighted or given significance. An Exponential Moving Average (EMA) is very similar to (and is a type of) a weighted moving average. The major difference with the EMA is that old data points never leave the average. To clarify, old data points retain a multiplier (albeit declining to almost nothing) even if they are outside of the selected data series length.
The 3 EMAs that the Script has, are configured as follows:
Fast EMA (purple) 10 periods.
Slow EMA (blue) 55 periods.
Big EMA (olive) 200 periods.
However, you can configure each one with the color and the number of periods you want.
There are other indicators in the Public Library that have similar functions to this Script, but they all do it in a more complex and less friendly way when configuring it, for this reason we wanted to keep this Script as simple as possible.
[klemenxina] BB% MMABB% based indicator. It tracks the percentage distance between price and its deviations. Using this it shows overbought and oversold levels, signalling a good chance for mean reversion.
Triangles signal a good chance of price changing direction. Meaning green triangle = bull and red triangle = bear.
Script also includes warnings for change of trend when blue diamonds are printed. These indicate a deviation of the indicator baseline (BB%).
For the BB baseline, there are 7 options. When the testing is finished I will eliminate the bad ones.
The indicator works on all timeframes and has inputs for MA lengths, a different input for Hull MA variants and bb% deviation length.
Colouring options include a single colour, position colour which colours the baseline depending where it stands on the scale(+-50) and trend colour that uses trend detection for baseline colouring (red = bear, green = bull)
Script also includes divs.
Users can change the TF of the indi.
If you have any improvement ideas MSG me.
