Índice de direção de movimento médio (ADX)

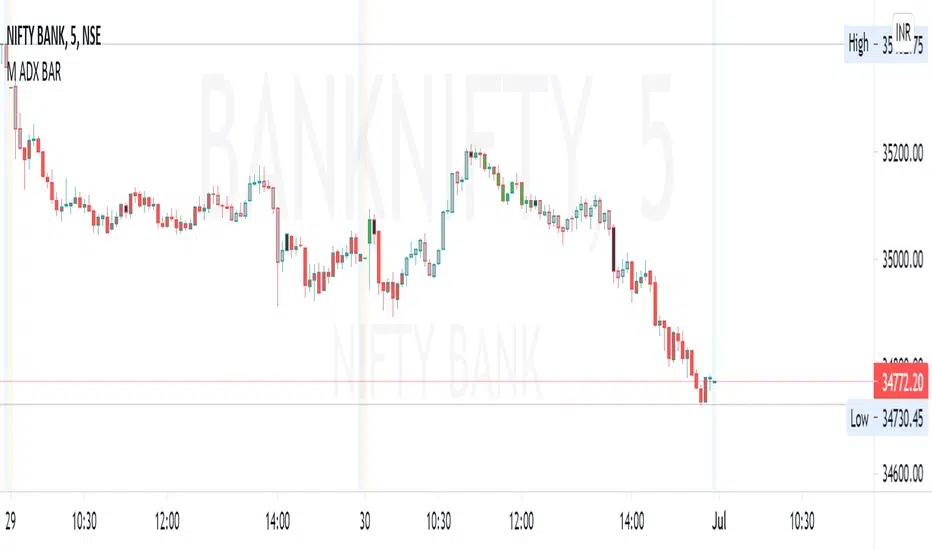
M ADX BARBar colors based on ADX and DI strength.
How to study:
ADX is less then 20 (adjustable value) is SILVER (no trend)
ADX >0 and DI delta (DI plus - DI minus) is >0 color LIME (trend up)
ADX>0 and DI delta <0 color RED (trend down)
ADX cross ADX Index ( adx+adx 14 period back)/2 color is BLACK and means start/end of trend
Converting the ADX into Bars for ease of use... (combining with RSI gives best results.. Timeframe 3min or more
ADX Histogram with DI linesInspired by the user scarf from Tradingview. In contrast with that other indicator, this one instead of a simple moving average (SMA) for the ADX calculations, uses a running moving average (RMA) or also known as Wilder's Average. I like having a histogram for the DI lines over just having lines alone because it makes it easier to see. In addition I made it so that values less than 5 for the DI lines are colored lightly to note that the movement was less significant(might not matter but some might care about it, atleast I do). The ADX has a color fainting effect too, and when it goes above the threshold then it becomes black to note that it is trending, as the indicator suggests.
The advantages with these additions and changes are that it shows a more traditional moving average like the original author Wellers Wilder suggested and you can see the crossings and directional movement changes easier from seeing the colors on the histogram easier than you would by looking at the DI lines alone. The disadvantages are you won't be able to tell when the ADX line is above both DI lines and when the ADX then makes a decrease from there(which can sometimes show a reversal), but personally it doesn't matter too much to me and perhaps to those who care more about seeing the direction than having to focus on all those 3 lines crossing all over the place.

ADX with Color like MACD HistogramThis is a usual ADX Indicator but the colors change when the next bar falls or grows from the previous bar.
I think that the use of ADX can be maximized by seeing whether the movement is lower or higher than the previous like MACD Histogram.
The ADX indicator is very powerful for driving long-term trends and is effectively used for 4-hour or 1-hour Time Frames.
When ADX is above level 20, the color of the Bar will be blue or light blue. The blue bar means that the bar is higher than the previous bar. The light blue bar means the bar is lower than the previous one.
When ADX is below level 20, the color of the bar will be dark gray or light gray. The dark gray bar means that the bar is lower than the previous bar. The light gray bar means the bar is higher than the previous bar.
When the bar turns blue that's when we can add shares to our winning position.
When the price is above level 40, the background of the bars will be red, indicating that the price is in a very strong trend and will run out of its thrust soon. That's when we get ready to take profit, which is when the ADX Bar which is blue turns light blue.
-
FYI, I use ADX just for adding the shares to my winning position and exiting the market. I don't wait for ADX turns blue to enter the market.

Ruckard TradingLatinoThis strategy tries to mimic TradingLatino strategy.
The current implementation is beta.
Si hablas castellano o espanyol por favor consulta MENSAJE EN CASTELLANO más abajo.
It's aimed at BTCUSDT pair and 4h timeframe.
STRATEGY DEFAULT SETTINGS EXPLANATION
max_bars_back=5000 : This is a random number of bars so that the strategy test lasts for one or two years
calc_on_order_fills=false : To wait for the 4h closing is too much. Try to check if it's worth entering a position after closing one. I finally decided not to recheck if it's worth entering after an order is closed. So it is false.
calc_on_every_tick=false
pyramiding=0 : We only want one entry allowed in the same direction. And we don't want the order to scale by error.
initial_capital=1000 : These are 1000 USDT. By using 1% maximum loss per trade and 7% as a default stop loss by using 1000 USDT at 12000 USDT per BTC price you would entry with around 142 USDT which are converted into: 0.010 BTC . The maximum number of decimal for contracts on this BTCUSDT market is 3 decimals. E.g. the minimum might be: 0.001 BTC . So, this minimal 1000 amount ensures us not to entry with less than 0.001 entries which might have happened when using 100 USDT as an initial capital.
slippage=1 : Binance BTCUSDT mintick is: 0.01. Binance slippage: 0.1 % (Let's assume). TV has an integer slippage. It does not have a percentage based slippage. If we assume a 1000 initial capital, the recommended equity is 142 which at 11996 USDT per BTC price means: 0.011 BTC. The 0.1% slippage of: 0.011 BTC would be: 0.000011 . This is way smaller than the mintick. So our slippage is going to be 1. E.g. 1 (slippage) * 0.01 (mintick)
commission_type=strategy.commission.percent and commission_value=0.1 : According to: binance . com / en / fee / schedule in VIP 0 level both maker and taker fees are: 0.1 %.
BACKGROUND
Jaime Merino is a well known Youtuber focused on crypto trading
His channel TradingLatino
features monday to friday videos where he explains his strategy.
JAIME MERINO STANCE ON BOTS
Jaime Merino stance on bots (taken from memory out of a 2020 June video from him):
'~
You know. They can program you a bot and it might work.
But, there are some special situations that the bot would not be able to handle.
And, I, as a human, I would handle it. And the bot wouldn't do it.
~'
My long term target with this strategy script is add as many
special situations as I can to the script
so that it can match Jaime Merino behaviour even in non normal circumstances.
My alternate target is learn Pine script
and enjoy programming with it.
WARNING
This script might be bigger than other TradingView scripts.
However, please, do not be confused because the current status is beta.
This script has not been tested with real money.
This is NOT an official strategy from Jaime Merino.
This is NOT an official strategy from TradingLatino . net .
HOW IT WORKS
It basically uses ADX slope and LazyBear's Squeeze Momentum Indicator
to make its buy and sell decisions.
Fast paced EMA being bigger than slow paced EMA
(on higher timeframe) advices going long.
Fast paced EMA being smaller than slow paced EMA
(on higher timeframe) advices going short.
It finally add many substrats that TradingLatino uses.
SETTINGS
__ SETTINGS - Basics
____ SETTINGS - Basics - ADX
(ADX) Smoothing {14}
(ADX) DI Length {14}
(ADX) key level {23}
____ SETTINGS - Basics - LazyBear Squeeze Momentum
(SQZMOM) BB Length {20}
(SQZMOM) BB MultFactor {2.0}
(SQZMOM) KC Length {20}
(SQZMOM) KC MultFactor {1.5}
(SQZMOM) Use TrueRange (KC) {True}
____ SETTINGS - Basics - EMAs
(EMAS) EMA10 - Length {10}
(EMAS) EMA10 - Source {close}
(EMAS) EMA55 - Length {55}
(EMAS) EMA55 - Source {close}
____ SETTINGS - Volume Profile
Lowest and highest VPoC from last three days
is used to know if an entry has a support
VPVR of last 100 4h bars
is also taken into account
(VP) Use number of bars (not VP timeframe): Uses 'Number of bars {100}' setting instead of 'Volume Profile timeframe' setting for calculating session VPoC
(VP) Show tick difference from current price {False}: BETA . Might be useful for actions some day.
(VP) Number of bars {100}: If 'Use number of bars (not VP timeframe)' is turned on this setting is used to calculate session VPoC.
(VP) Volume Profile timeframe {1 day}: If 'Use number of bars (not VP timeframe)' is turned off this setting is used to calculate session VPoC.
(VP) Row width multiplier {0.6}: Adjust how the extra Volume Profile bars are shown in the chart.
(VP) Resistances prices number of decimal digits : Round Volume Profile bars label numbers so that they don't have so many decimals.
(VP) Number of bars for bottom VPOC {18}: 18 bars equals 3 days in suggested timeframe of 4 hours. It's used to calculate lowest session VPoC from previous three days. It's also used as a top VPOC for sells.
(VP) Ignore VPOC bottom advice on long {False}: If turned on it ignores bottom VPOC (or top VPOC on sells) when evaluating if a buy entry is worth it.
(VP) Number of bars for VPVR VPOC {100}: Number of bars to calculate the VPVR VPoC. We use 100 as Jaime once used. When the price bounces back to the EMA55 it might just bounce to this VPVR VPoC if its price it's lower than the EMA55 (Sells have inverse algorithm).
____ SETTINGS - ADX Slope
ADX Slope
help us to understand if ADX
has a positive slope, negative slope
or it is rather still.
(ADXSLOPE) ADX cut {23}: If ADX value is greater than this cut (23) then ADX has strength
(ADXSLOPE) ADX minimum steepness entry {45}: ADX slope needs to be 45 degrees to be considered as a positive one.
(ADXSLOPE) ADX minimum steepness exit {45}: ADX slope needs to be -45 degrees to be considered as a negative one.
(ADXSLOPE) ADX steepness periods {3}: In order to avoid false detection the slope is calculated along 3 periods.
____ SETTINGS - Next to EMA55
(NEXTEMA55) EMA10 to EMA55 bounce back percentage {80}: EMA10 might bounce back to EMA55 or maybe to 80% of its complete way to EMA55
(NEXTEMA55) Next to EMA55 percentage {15}: How much next to the EMA55 you need to be to consider it's going to bounce back upwards again.
____ SETTINGS - Stop Loss and Take Profit
You can set a default stop loss or a default take profit.
(STOPTAKE) Stop Loss % {7.0}
(STOPTAKE) Take Profit % {2.0}
____ SETTINGS - Trailing Take Profit
You can customize the default trailing take profit values
(TRAILING) Trailing Take Profit (%) {1.0}: Trailing take profit offset in percentage
(TRAILING) Trailing Take Profit Trigger (%) {2.0}: When 2.0% of benefit is reached then activate the trailing take profit.
____ SETTINGS - MAIN TURN ON/OFF OPTIONS
(EMAS) Ignore advice based on emas {false}.
(EMAS) Ignore advice based on emas (On closing long signal) {False}: Ignore advice based on emas but only when deciding to close a buy entry.
(SQZMOM) Ignore advice based on SQZMOM {false}: Ignores advice based on SQZMOM indicator.
(ADXSLOPE) Ignore advice based on ADX positive slope {false}
(ADXSLOPE) Ignore advice based on ADX cut (23) {true}
(STOPTAKE) Take Profit? {false}: Enables simple Take Profit.
(STOPTAKE) Stop Loss? {True}: Enables simple Stop Loss.
(TRAILING) Enable Trailing Take Profit (%) {True}: Enables Trailing Take Profit.
____ SETTINGS - Strategy mode
(STRAT) Type Strategy: 'Long and Short', 'Long Only' or 'Short Only'. Default: 'Long and Short'.
____ SETTINGS - Risk Management
(RISKM) Risk Management Type: 'Safe', 'Somewhat safe compound' or 'Unsafe compound'. ' Safe ': Calculations are always done with the initial capital (1000) in mind. The maximum losses per trade/day/week/month are taken into account. ' Somewhat safe compound ': Calculations are done with initial capital (1000) or a higher capital if it increases. The maximum losses per trade/day/week/month are taken into account. ' Unsafe compound ': In each order all the current capital is gambled and only the default stop loss per order is taken into account. That means that the maximum losses per trade/day/week/month are not taken into account. Default : 'Somewhat safe compound'.
(RISKM) Maximum loss per trade % {1.0}.
(RISKM) Maximum loss per day % {6.0}.
(RISKM) Maximum loss per week % {8.0}.
(RISKM) Maximum loss per month % {10.0}.
____ SETTINGS - Decimals
(DECIMAL) Maximum number of decimal for contracts {3}: How small (3 decimals means 0.001) an entry position might be in your exchange.
EXTRA 1 - PRICE IS IN RANGE indicator
(PRANGE) Print price is in range {False}: Enable a bottom label that indicates if the price is in range or not.
(PRANGE) Price range periods {5}: How many previous periods are used to calculate the medians
(PRANGE) Price range maximum desviation (%) {0.6} ( > 0 ): Maximum positive desviation for range detection
(PRANGE) Price range minimum desviation (%) {0.6} ( > 0 ): Mininum negative desviation for range detection
EXTRA 2 - SQUEEZE MOMENTUM Desviation indicator
(SQZDIVER) Show degrees {False}: Show degrees of each Squeeze Momentum Divergence lines to the x-axis.
(SQZDIVER) Show desviation labels {False}: Whether to show or not desviation labels for the Squeeze Momentum Divergences.
(SQZDIVER) Show desviation lines {False}: Whether to show or not desviation lines for the Squeeze Momentum Divergences.
EXTRA 3 - VOLUME PROFILE indicator
WARNING: This indicator works not on current bar but on previous bar. So in the worst case it might be VP from 4 hours ago. Don't worry, inside the strategy calculus the correct values are used. It's just that I cannot show the most recent one in the chart.
(VP) Print recent profile {False}: Show Volume Profile indicator
(VP) Avoid label price overlaps {False}: Avoid label prices to overlap on the chart.
EXTRA 4 - ZIGNALY SUPPORT
(ZIG) Zignaly Alert Type {Email}: 'Email', 'Webhook'. ' Email ': Prepare alert_message variable content to be compatible with zignaly expected email content format. ' Webhook ': Prepare alert_message variable content to be compatible with zignaly expected json content format.
EXTRA 5 - DEBUG
(DEBUG) Enable debug on order comments {False}: If set to true it prepares the order message to match the alert_message variable. It makes easier to debug what would have been sent by email or webhook on each of the times an order is triggered.
HOW TO USE THIS STRATEGY
BOT MODE: This is the default setting.
PROPER VOLUME PROFILE VIEWING: Click on this strategy settings. Properties tab. Make sure Recalculate 'each time the order was run' is turned off.
NEWBIE USER: (Check PROPER VOLUME PROFILE VIEWING above!) You might want to turn on the 'Print recent profile {False}' setting. Alternatively you can use my alternate realtime study: 'Resistances and supports based on simplified Volume Profile' but, be aware, it might consume one indicator.
ADVANCED USER 1: Turn on the 'Print price is in range {False}' setting and help us to debug this subindicator. Also help us to figure out how to include this value in the strategy.
ADVANCED USER 2: Turn on the all the (SQZDIVER) settings and help us to figure out how to include this value in the strategy.
ADVANCED USER 3: (Check PROPER VOLUME PROFILE VIEWING above!) Turn on the 'Print recent profile {False}' setting and report any problem with it.
JAIME MERINO: Just use the indicator as it comes by default. It should only show BUY signals, SELL signals and their associated closing signals. From time to time you might want to check 'ADVANCED USER 2' instructions to check that there's actually a divergence. Check also 'ADVANCED USER 1' instructions for your amusement.
EXTRA ADVICE
It's advised that you use this strategy in addition to these two other indicators:
* Squeeze Momentum Indicator
* ADX
so that your chart matches as close as possible to TradingLatino chart.
ZIGNALY INTEGRATION
This strategy supports Zignaly email integration by default. It also supports Zignaly Webhook integration.
ZIGNALY INTEGRATION - Email integration example
What you would write in your alert message:
||{{strategy.order.alert_message}}||key=MYSECRETKEY||
ZIGNALY INTEGRATION - Webhook integration example
What you would write in your alert message:
{ {{strategy.order.alert_message}} , "key" : "MYSECRETKEY" }
CREDITS
I have reused and adapted some code from
'Directional Movement Index + ADX & Keylevel Support' study
which it's from TradingView console user.
I have reused and adapted some code from
'3ema' study
which it's from TradingView hunganhnguyen1193 user.
I have reused and adapted some code from
'Squeeze Momentum Indicator ' study
which it's from TradingView LazyBear user.
I have reused and adapted some code from
'Strategy Tester EMA-SMA-RSI-MACD' study
which it's from TradingView fikira user.
I have reused and adapted some code from
'Support Resistance MTF' study
which it's from TradingView LonesomeTheBlue user.
I have reused and adapted some code from
'TF Segmented Linear Regression' study
which it's from TradingView alexgrover user.
I have reused and adapted some code from
"Poor man's volume profile" study
which it's from TradingView IldarAkhmetgaleev user.
FEEDBACK
Please check the strategy source code for more detailed information
where, among others, I explain all of the substrats
and if they are implemented or not.
Q1. Did I understand wrong any of the Jaime substrats (which I have implemented)?
Q2. The strategy yields quite profit when we should long (EMA10 from 1d timeframe is higher than EMA55 from 1d timeframe.
Why the strategy yields much less profit when we should short (EMA10 from 1d timeframe is lower than EMA55 from 1d timeframe)?
Any idea if you need to do something else rather than just reverse what Jaime does when longing?
FREQUENTLY ASKED QUESTIONS
FAQ1. Why are you giving this strategy for free?
TradingLatino and his fellow enthusiasts taught me this strategy. Now I'm giving back to them.
FAQ2. Seriously! Why are you giving this strategy for free?
I'm confident his strategy might be improved a lot. By keeping it to myself I would avoid other people contributions to improve it.
Now that everyone can contribute this is a win-win.
FAQ3. How can I connect this strategy to my Exchange account?
It seems that you can attach alerts to strategies.
You might want to combine it with a paying account which enable Webhook URLs to work.
I don't know how all of this works right now so I cannot give you advice on it.
You will have to do your own research on this subject. But, be careful. Automating trades, if not done properly,
might end on you automating losses.
FAQ4. I have just found that this strategy by default gives more than 3.97% of 'maximum series of losses'. That's unacceptable according to my risk management policy.
You might want to reduce default stop loss setting from 7% to something like 5% till you are ok with the 'maximum series of losses'.
FAQ5. Where can I learn more about your work on this strategy?
Check the source code. You might find unused strategies. Either because there's not a substantial increases on earnings. Or maybe because they have not been implemented yet.
FAQ6. How much leverage is applied in this strategy?
No leverage.
FAQ7. Any difference with original Jaime Merino strategy?
Most of the times Jaime defines an stop loss at the price entry. That's not the case here. The default stop loss is 7% (but, don't be confused it only means losing 1% of your investment thanks to risk management). There's also a trailing take profit that triggers at 2% profit with a 1% trailing.
FAQ8. Why this strategy return is so small?
The strategy should be improved a lot. And, well, backtesting in this platform is not guaranteed to return theoric results comparable to real-life returns. That's why I'm personally forward testing this strategy to verify it.
MENSAJE EN CASTELLANO
En primer lugar se agradece feedback para mejorar la estrategia.
Si eres un usuario avanzado y quieres colaborar en mejorar el script no dudes en comentar abajo.
Ten en cuenta que aunque toda esta descripción tenga que estar en inglés no es obligatorio que el comentario esté en inglés.
CHISTE - CASTELLANO
¡Pero Jaime!
¡400.000!
¡Tu da mun!

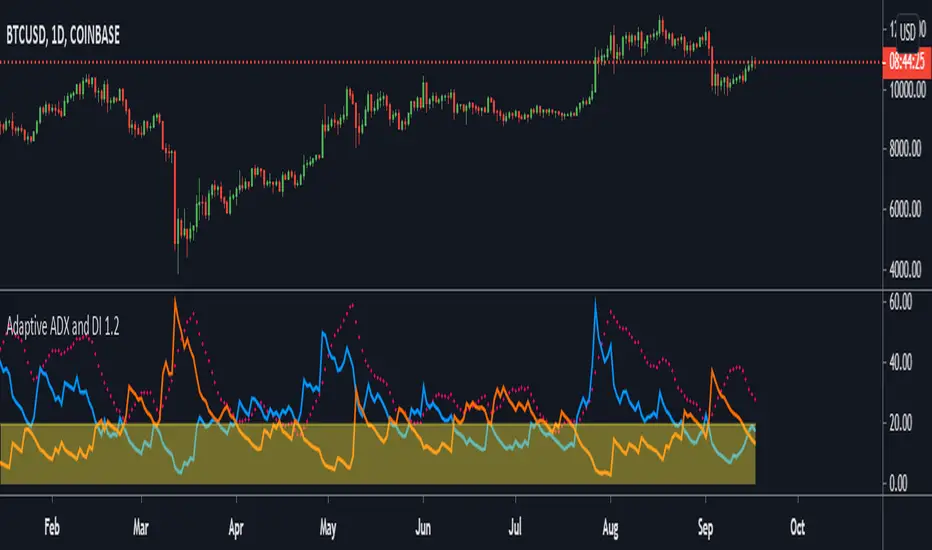
Adaptive ADX and DIThis is part 2 of 11 in the system named Ninetales/Volt V2 you can find on Tradingview.
It simply measures all of the combinations of the defined parameters of a typical ADX + DI , and returns the most logically accurate values.
Use it however you would use a standard ADX + DI, just add your preferred values to test against each other, and set the period you would like for it to backtest.
Standard use would be to wait for ADX(red line) to be above the threshold(yellow shaded area). The short when orange is above the blue line, and long when the blue line is above the orange line.
KENVIN ADX CROSSThis is Pro ADX Indicator was modified and renovated to more smooth and effectively
- easier to self modify (customize)
- quickly detect trend
- easier to view with signal color cross

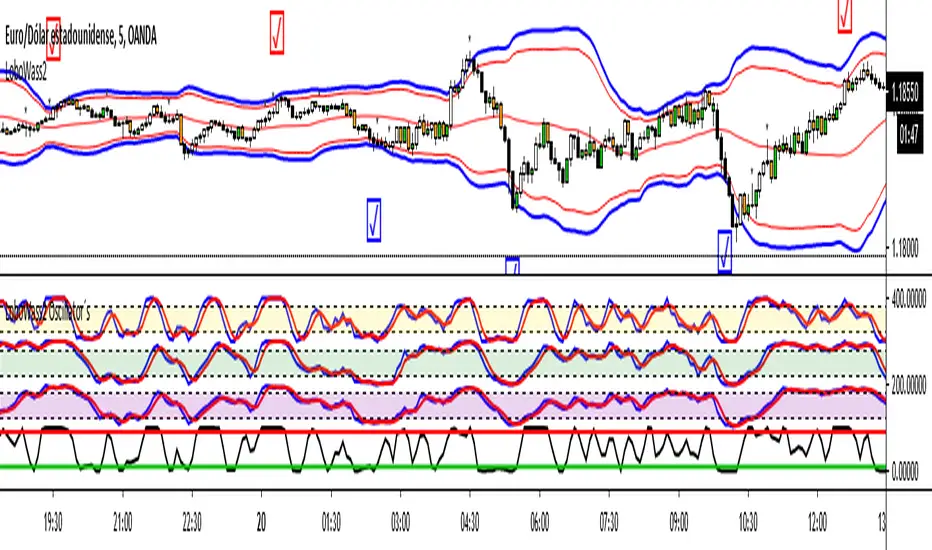
LoboWass2 Oscillator´s by Hashtag_binaryThis indicator composed of several oscillators was designed to be used with the strategy called LoboWass2 to be applied with Binary Options.
The idea of these oscillators is to be able to observe when all together appear in the same position, either overbought or oversold, and take the trade.
Remember that this is a confirmation tool, you must carry out prior analysis as your capital could be at risk. I recommend using this tool for the indicated strategy, as it was designed for that purpose. By working properly and professionally you can achieve great results, it all depends on you.
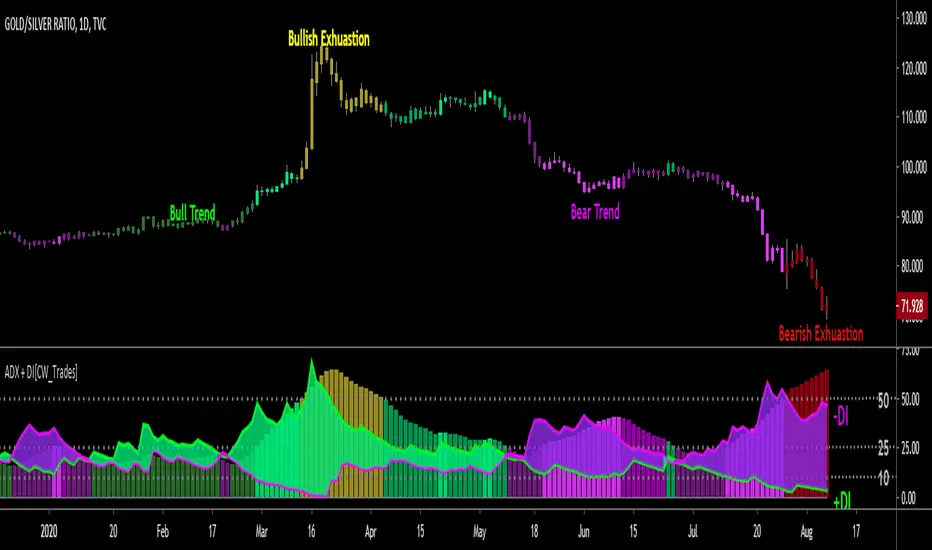
ADX + DI w/ Colored Candles [CW_Trades]The Average Directional Index (ADX) is a technical analysis indicator used to determine price trend and price strength by comparing current price to recent price history. The price trend can be either up or down(bullish/bearish), and this is shown by two accompanying indicators, the Negative Directional Indicator (-DI, purple line) and the Positive Directional Indicator (+DI, green line) which compare price highs to price lows on a 14-period lookback. The strength of the trend is shown by the histogram in the background and also utilizes a 14-period lookback in its calculation.
When the +DI is trending above the -DI it indicates a short-term bullish trend in price. If the histogram is rising while the +DI is above the -DI it indicates strength in the bullish trend. If the histogram is declining while the +DI is above the -DI it indicates weakness in the bullish trend.
When the -DI is trending above the +DI it indicates a short-term bullish trend in price. If the histogram is rising while the -DI is above the +DI it indicates strength in the bearish trend. If the histogram is declining while the -DI is above the +DI it indicates weakness in the bearish trend.
When the +DI is above the -DI the histogram will be colored shades of green. When the -DI is above the +DI the histogram will be colored shades of purple.
The ADX has 3 key levels to watch, and they are 10, 25 and 50.
-When the ADX histogram bars are below 10 it indicates no identifiable strength in the price trend, or neutral. The histogram bars will be colored gray when the ADX is below 10.
-When the ADX histogram bars are between 10 and 25 it indicates a weak trend in price. The histogram bars will be shades of dark green or dark purple when in this zone.
-When the ADX histogram bars are above 25 and below 50 it indicates a strong trend in price. The histogram bars will be shades of medium green/purple or bright green/purple when the ADX is between 25
and 50. Bright green or bright purple indicate that the current histogram bar is higher than the preceding histogram bar, medium shades of either green or purple indicate that the current histogram bar is
lower than the preceding histogram bar. The brighter the shade of green or purple, the stronger the trend.
-When the ADX histogram bars are above 50 it indicates potential trend exhaustion. When the +DI is above the -DI and the ADX is above 50 the histogram will be colored yellow which indicates a potential
end of the bull trend. When the -DI is above the +DI and the histogram bars are above 50 the histogram will be colored red which indicates a potential end of the bearish trend.
Trend Cloud
The clouds reflect a possible overextension of the trend. Traders could use it as a signal to scale out the positions in the direction of the present trend or avoid scaling in.
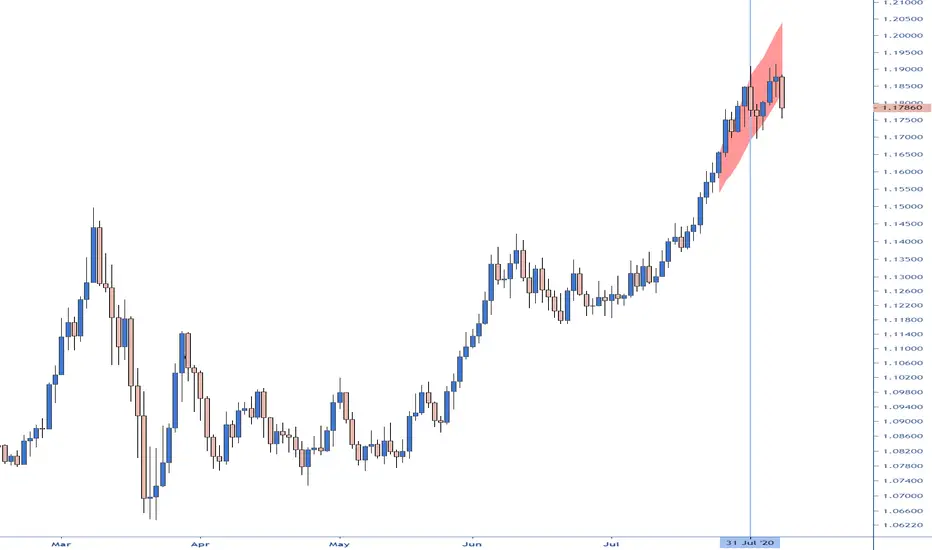
The indicator plots the difference between ADX over the 45 level proportionate to the range between an ATR multiplier around MA. By default, the ADX is calculated with a DI length of 14 and an ADX smoothing of 14, an ATR length of 14, MA length of 20 and a multiplier of 2.
On the chart, I have highlighted with the vertical line the candles when the indicator was activated on all four timeframes simultaneously.
LB Squeeze Momentum DivergencesThis study tries to highlight LazyBear Squeeze Momentum divergences
as they are defined by
TradingLatino TradingView user
Squeeze momentum green peaks are connected by a line
Associated prices to these green peaks are also connected
If both lines have a different slope orientation
then there is a divergence.
It only shows two last divergence lines and angles.
The original chart screenshot shows some divergence lines
on the top or main chart
these were drawn manually
because you cannot write to two different charts
from the same pine script study (Well, not in August 2020 anyways)
It's aimed at BTCUSDT pair and 4h timeframe.
HOW IT WORKS
Simple geometric mathematics are used
to calculate the two lines degrees
Then both degrees are compared
to show if both lines agree ( // or \\ )
or if they disagree ( /\ or \/ )
SETTINGS
(SQZDiver) Show degrees : Show degrees of each Squeeze Momentum Divergence
lines to the x-axis.
(SQZDiver) Show desviation labels : Whether to show
or not desviation labels for the Squeeze Momentum Divergences.
(SQZDiver) Show desviation lines : Whether to show
or not desviation lines for the Squeeze Momentum Divergences.
(ADX) Smoothing
(ADX) DI Length
(ADX) key level
(ADX) Print : Whether to show
or not scaled ADX line
(SQZMOM) BB Length
(SQZMOM) BB MultFactor
(SQZMOM) KC Length
(SQZMOM) KC MultFactor
(SQZMOM) Use TrueRange (KC)
(SQZMOM) Print : Whether to show
or not Squeeze Momentum indicator.
WARNING
Some securities and timeframes might output degrees
too next to zero.
The code might need to be tweaked to meet your needs.
USAGE
One strategy is to sell when you are in a long entry
when you find out that the price slope is upwards ( / )
while the lb smilb slope is downwards: ( \ )
E.g. You will see:
/
\
on the indicator.
Why?
Because it might signal you that the price is
going to correct downwards soon.
FEEDBACK 1
Please let me know if there is any
other strategy based on the red side of
LB Squeeze Momentum
so that I might add support for it in the future.
FEEDBACK 2
Calculating degrees in a chart
with a different x-axis scale
is a nightmare
that's why I did not a range settings
so that values next to zero are
converted into zero
and thus showing an horizontal line.
Feedback is welcome on this matter.
EXTRA 1
If you turn off showing the divergence lines
and if you turn off showing the divergence labels
you almost get what TradingLatino user uses
as its default momentum indicator.
EXTRA 2
Optionally this indicator can show you
a rescaled ADX (it only works properly on 2020 Bitcoin charts)
ABOUT COLOURS
TradingLatino user has both dark green and light green
inverted compared to this LB SQZMOM chart.
CREDITS
I have reused and adapted some code from
'Squeeze Momentum Indicator' study
which it's from TradingView LazyBear user.
I have reused and adapted some code from
'Directional Movement Index + ADX & Keylevel Support' study
which it's from TradingView console user.

RDX ScoreModified TradingView script for @bankniftydoctor's RDX strategy. Original script idea credits to @TheProfessorDev
- I have modified the code to reflect core RDX strategy score, instead of the simplified one
- Every bar (including ones in RSI 45-55) will display its RDX score.
p.s .For the uninitiated, these number generated by this script are used for the RDX strategy devised by @bankniftydoctor. There's an anchored note at the upper right corner, which briefly summarises the RDX score & the positions to be taken accordingly.

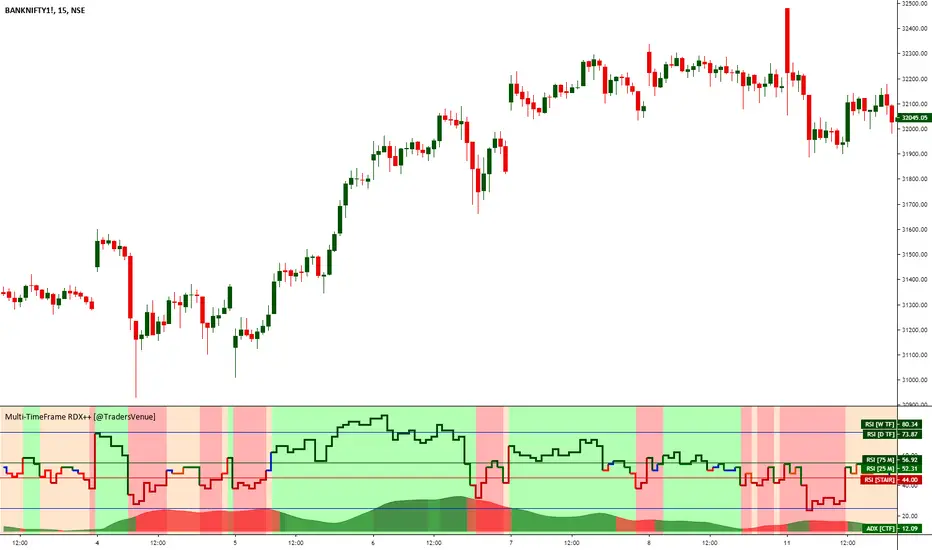
Multi-TimeFrame RDX++ [@TradersVenue]// @Release: EMA Cross++ v49
// @Author : Prasuna.Barik
// This is multi timeframe RSI indicator which displays RSI value of 15/25/75/D/W/M timeframes in single window.
// One can select or deselect individual RSI's, choose RSI length of default RSI, length of slow/fast RSI.
// Current RSI indicator considers below scenarios to be bullish 1) RSI > iRSIBuyLvl 2) Smaller TF RSI > Larger TF RSI
// Current RSI indicator considers below scenarios to be bearish 1) RSI < iRSIBuyLvl 2) Smaller TF RSI < Larger TF RSI
// Background of the indicator turns green when RSI trades above iRSIBuyLvl, turns red when RSI trades below iRSISellLvl else orage
// If SlowRSI > SlowRSI then it indicates EMA(RSI(14), LEN) is in a upward slope i.e. its bullish
// Along with RSI it displayes ADX as well. So one may go through the settings and enable or disable display of DI and ADX lines.
// Few UI/UX customizations in chart, like changing line width, transparency, BG Color is provisioned for enhanced viewability
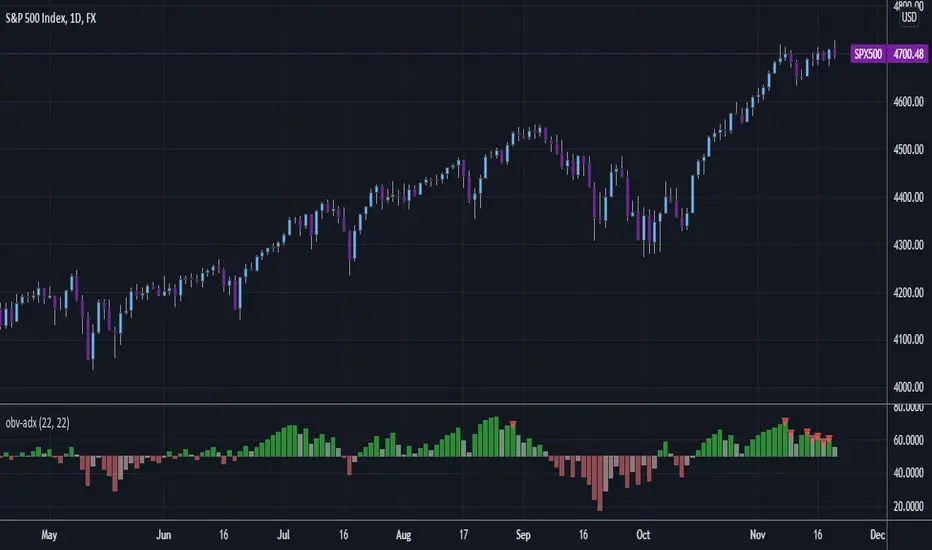
OBV - ADX and DI+/-This is the ADX and DI+/- indicator applied to OBV!
This really clearly shows up and down, but using VOLUME! Don't ignore it, there is too much information captured in the OBV.
If you just love the ADX/DI format, it is included in a checkbox.
Want some excellent background highlighting, turn in on in a checkbox.
Shout out to some inspirations
csw-dmi
unRekt-KISS-Addie
[WJ] - ADX v2 [DMI, Alerts, Histogram, Customizable]A handy all-in-one package for DMI and ADX
Color-coordinated line for DMI with an EMA and histogram to gauge momentum, mark potential reversals, and quickly gather all the information you need to make your decisions.
Quick take-aways:
- Color of the ADX line indicates the current trend
- An ADX below the EMA indicates a potentially falling/reversing trend
- Customizable line w/ alerts for ADX crossovers
- Histogram to help catch potential reversals faster, and to gauge the momentum
Please let me know what you think, and in any features you think would increase the effectiveness of this amazing tool.


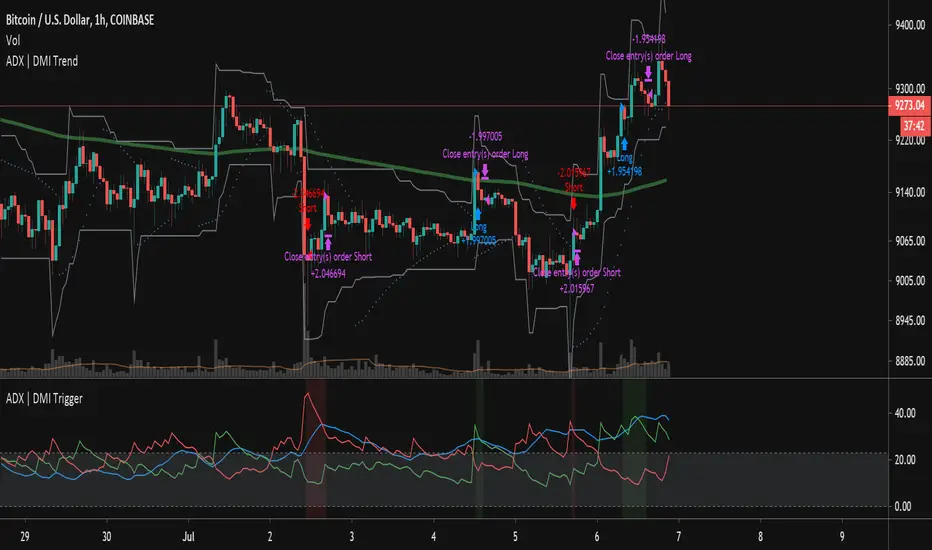
ADX | DMI Trend StrategyThis strategy takes the ADX Indicator I wrote and applies it to a strategy for back testing purposes.
I've also applied a date filter so you can back test specific date ranges and a moving average filter so you can choose whether to filter your longs/shorts based on a moving average.
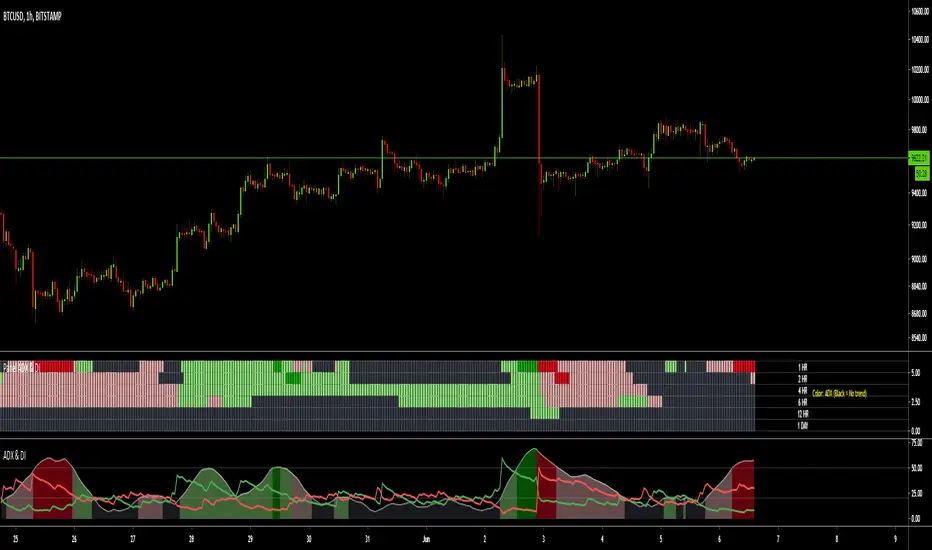
MTF ADX & DI - Monitoring PanelMonitoring panel showing the ADX (Average Directional Index) & DMI (Directional Movement Index) as color code for 6 different timeframes.
This gives a very easy overview on the current state of the market and if it is trending.
- ADX basically describes the strength of a Trend
- DMI give indication on the direction of the trend, usually shown as +DI and -DI
Meanings of the Colors:
ADX is below Low Threshold (no trend) : Black
ADX is above Low Threshold and DI is positive (weak bullish trend) : Light Green
ADX is above High Threshold and DI is positive (strong bullish trend) : Dark Green
ADX is above Low Threshold and DI is negative (weak bearish trend) : Light Red
ADX is above High Threshold and DI is negative (strong bearish trend) : Dark Red
- Low Threshold (default = 20) and High Threshold (default = 50) can be changed in the settings
- Timeframes can be changed, but the description labels are currently hardcoded - if you want to change it, just copy the script and change them
- Currently there are two additional timeframes commented in the code - if you want to use them, just copy the script and uncomment them
Have fun and as always I am open for constructive feedback.
Cheers!
LIZ ADX+DMIThe thick lines represent ADX .
When the volatility increases, it faces up and the color changes from gray to green.
When the background is gray and starts to turn green from below the horizontal line of reference value of 20, the volatility increases, indicating that the environment is becoming easier to trade.
When ADX rises and then peaks out, the line goes down and the previously green line changes to gray.
This means that the trend that was going on before is now over.People who hold positions use them to sign off their hands.
Also, those who want to see the trend change and build a new position with a backstop can use it to sign their entries.
When the background is gray (due to the deterioration of ADX ), it indicates that the volatility is low, there is no value width, and the direction is unclear, so it's not a good time to trade.
The two thin lines, red and blue, are DMI.A red line at the top and a blue line at the bottom indicates that the buying power is dominant, and the gap between the two lines is painted red.
On the other hand, if the blue line is up and the red line is down, it shows that the selling power is superior and it is painted blue.
When the two ADX lines intersect, and the color between the lines is changing from red to blue or blue to red, it indicates that the buyer's advantage has changed.
You can look at when the line crosses, and then enter in the new direction of dominance and build a position.
You can also determine that your position is in line with the market flow if it is in line with your current predominance.
However, in the opposite case, it suggests that the position you have is not in the right direction.
When two DMI lines are crossed frequently, it indicates a range or random rate.
In such cases, the background is often gray, indicating that it is difficult to make a profit in trade.
If you are interested in the invitation-only indicator, please contact us on private chat.
太い線はADXを表してます。
ボラティリティーが上昇すると上を向き、色がグレーから緑に変化します。
背景がグレーの期間で、水平線で示す基準値20より低い位置から上を向き緑に変化し始める時、ボラティリティーが上昇し、トレードしやすい環境になりつつある事を示唆しています。
ADXが上昇し、やがてピークアウトするとラインが下を向き、それまで緑だったラインの色がグレーに変わります。これは、それまで続いていたトレンドが一旦終了した事を意味します。
ポジションを持っていた人は、手仕舞いのサインに使います。
また、トレンドの転換を確認し、逆張りで新規ポジションの構築を狙っている人はエントリーのサインに使えます。
ADXが低下しているせいで,背景がグレーになっている時は,ボラティリティーが低下しており、値幅がなく、方向性がはっきりしないという理由で取引に向いていない時期である事を示します。
赤、青2本の細いラインはDMIです。赤いラインが上、青いラインが下の時は買い勢力が優勢である事を示し、2本の線の間が赤に塗られます。
反対に青いラインが上、赤いラインが下の時は売り勢力が優勢である事を示し、青に塗られます。
2本のADXラインが交差し、線の間に塗られた色が、
赤から青、または青から赤に変化する時、買い方売り方の優劣が入れ替わった事を示唆します。
ラインがクロスするタイミングを見て、新しく優勢になった方向にエントリーし、ポジションを構築できます。
また、自分が既に持っているポジションが、現在優勢である方向と一致している時はマーケットの流れに合っていると判断できます。
しかし反対の時は、あなたが持っているポジションの方向が合っていない事を示唆しています。
2本のDMIラインが頻繁にクロスしている時は、レンジ相場やランダム相場である事を示唆します。
そのような時は背景もグレーになっている時が多く、トレードで利益を出すのが難しい環境である事を表しています。
招待専用インジに興味ある方はプライベートチャットに連絡をください。

PROFIT+ V3 ALERTThis is an alert indicator for PROFIT+ V3 strategy .
Add it to your chart with the strategy and create alerts to
receive notifications when Buy and Sell signals are generated.
To receive access for the strategy and this indicator, please pm me or contact
me at telegram from the link below.
----------------------------------------------------------------------------
Это алерт индикатор к стратегии PROFIT+ V3 .
Используйте индикатор со стратегией и создавайте алерты
для получения уведомлений когда генерируются сигналы
на покупку и продажу.
Для получения доступа к стратегии и к данному индикатору,
пожалуйста, напишите мне в лс или в телеграм через ссылку ниже.

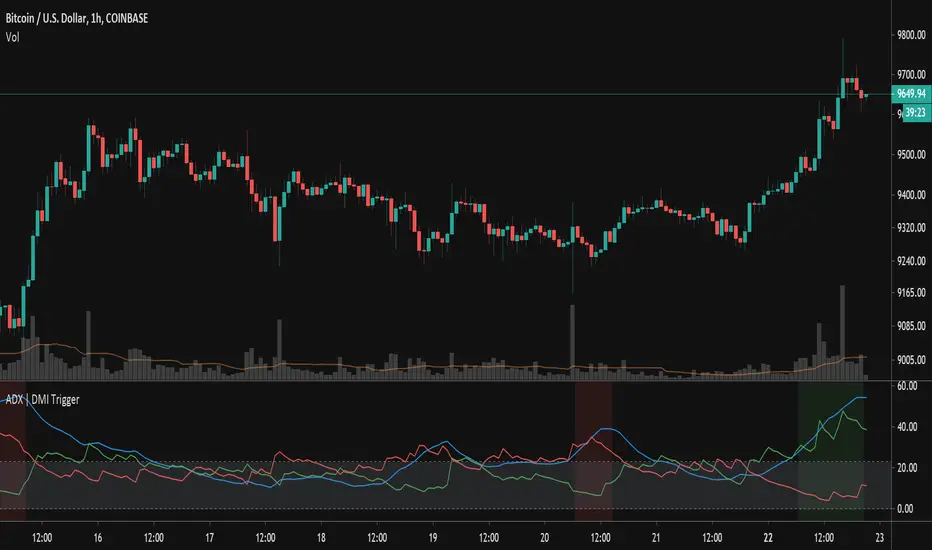
ADX TriggerThis script fires off a buy alert when the ADX is rising and above a user-defined value (default 25). It fires off a sell signal when ADX starts sloping downward. The lookback period to determine if it is sloping up/down (in bars) is also configurable by the user. The plot highlights green when there is a "go" signal. Thanks to @9e52f12edd034d28bdd5544e7ff92e for the idea.