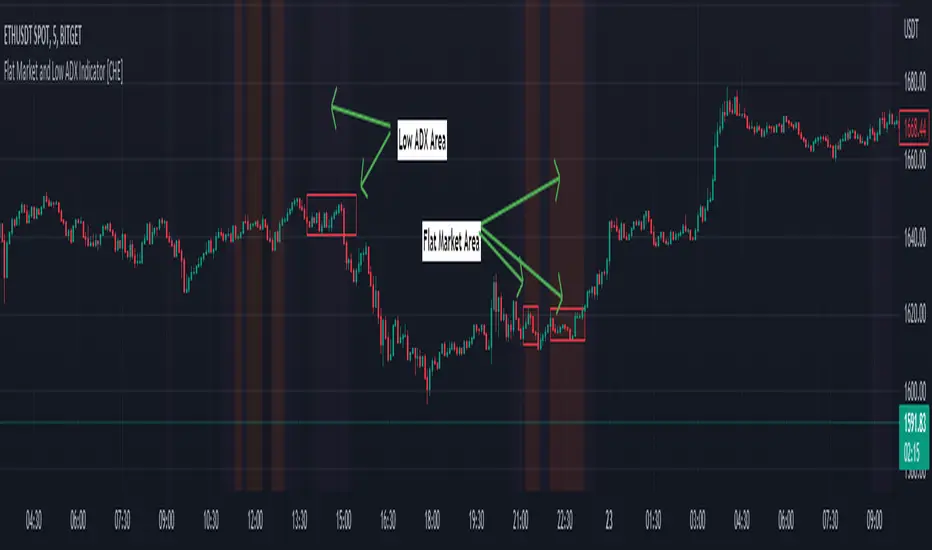
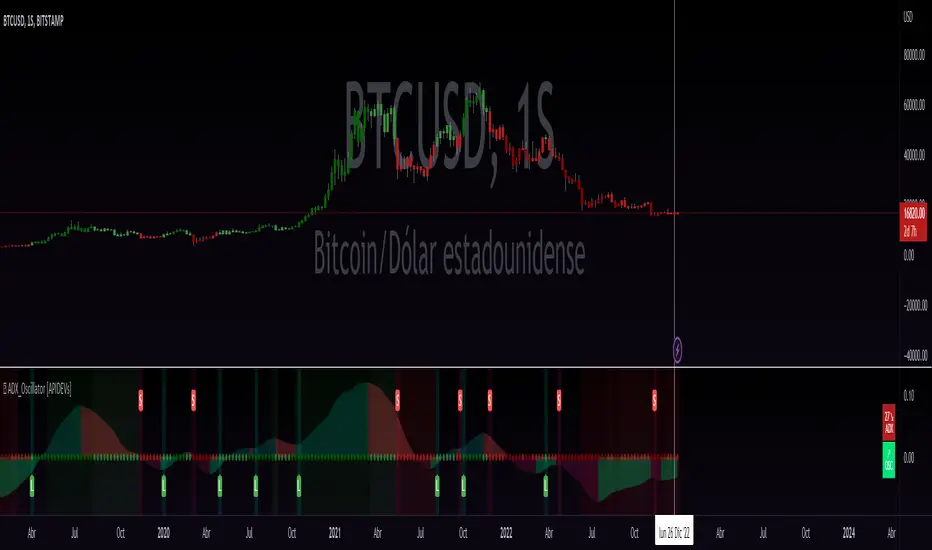
Flat Market and Low ADX Indicator [CHE]Why use the Flat Market and Low ADX Indicator ?
Flat markets, where prices remain within a narrow range for an extended period, can be both critical and dangerous for traders. In a flat market, the price action becomes less predictable, and traders may struggle to find profitable trading opportunities. As a result, many traders may decide to take a break from the market until a clear trend emerges.
However, flat markets can also be dangerous for traders who continue to trade despite the lack of clear trends. In the absence of a clear direction, traders may be tempted to take larger risks or make impulsive trades in an attempt to capture small profits. Such behavior can quickly lead to significant losses, especially if the market suddenly breaks out of its flat range, causing traders to experience large drawdowns.
Therefore, it is essential to approach flat markets with caution and to have a clear trading plan that incorporates strategies for both trending and flat markets. Traders may also use technical indicators, such as the Flat Market and Low ADX Indicator, to help identify flat markets and determine when it is appropriate to enter or exit a position.
The confluence between flat markets and low ADX readings can further increase the risk of trading during these periods. The ADX (Average Directional Index) is a technical indicator used to measure the strength of a trend. A low ADX reading indicates that the market is in a consolidation phase, which can coincide with a flat market. When a flat market occurs during a period of low ADX, traders should be even more cautious, as there is little to no directional bias in the market. In this situation, traders may want to consider waiting for a clear trend to emerge or using range-bound trading strategies to avoid taking excessive risks.
Introduction:
Pine Script is a programming language used for developing custom technical analysis indicators and trading strategies in TradingView. This particular script is an indicator designed to identify flat markets and low ADX conditions. In this description, we will delve deeper into the functionality of this script and how it can be used to improve trading decisions.
Description:
The first input in the script is the length of the moving average used for calculating the center line. This moving average is used to define the high and low range of the market. The script then calculates the middle value of the range by taking the double exponential moving average (EMA) of the high, low, and close prices.
The script then determines whether the market is flat by comparing the middle value of the range with the high and low values. If the middle value is greater than the high value or less than the low value, the market is not flat. If the middle value is within the high and low range, the script considers the market to be flat. The script also uses RSI filter settings to further confirm if the market is flat or not. If the RSI value is between the RSI min and max values, then the market is considered flat. If the RSI value is outside this range, the market is not considered flat.
The script also calculates the ADX (Average Directional Index) to determine whether it's in a low area. ADX is a technical indicator used to measure the strength of a trend. The script uses the ADX filter settings to define the ADX threshold value. If the ADX value is below the threshold value, the script considers the market to be in a low ADX area.
The script provides various input options to customize the display settings, including the option to show the flat market and low ADX areas. Users can choose their preferred colors for the flat market and low ADX areas and adjust the transparency levels to suit their needs.
Conclusion:
In conclusion, this Pine Script indicator is designed to identify flat market and low ADX conditions, which can help traders make informed trading decisions. The script uses a range of inputs and calculations to determine the market direction, RSI filter, and ADX filter. By customizing the display settings, users can adjust the indicator to suit their preferences and improve their trading strategies. Overall, this script can be a valuable tool for traders looking to gain an edge in the markets.
Acknowledgments:
Thanks to the Pine Script™ v5 User Manual www.tradingview.com
Índice de direção de movimento médio (ADX)
Athena Momentum Squeeze - Short, Lean, and Mean This is a very profitable strategy focusing on 15 minute intervals on the Micro Nasdaq Futures contracts. CME_MINI:MNQH2023
As this contract only keeps positions for on average about an hour risk is managed. At a profit factor of 3.382 with a max drawdown of $123 from January 1st to February 15. Looking back to Dec 2019 still maintains a profit factor of 1.3.
See backtesting: www.screencast.com
2019 backtesting: www.screencast.com
Based on the classic Lazy Bear Oscillator Squeeze with a number of modifications from ADX, MAs and adding fibonacci levels.
We like keeping strategies simple yet powerful, no completely where you can't understand your own trades.
Our team is always modifying and improving the strategy. Always open to collaborating on improving as there is no perfect strategy. www.screencast.com

Multiple Indicators ScreenerThis is a stock screener that incorporates open source code by QuantNomad, with the addition of slow and fast EMA pullback and crossover functions. It is designed for intraday scalping and quick trades, using 1, 3, and 5 minute candles. The RSI, Supertrend, and ADX indicators help to confirm trade setups, and the use of discount, premium, and equilibrium zones can improve results. With the ability to screen 40 stocks, the screener ensures that no quick action is missed. ]
Disclaimer
It is important to note that any trade initiated using this screener should be well researched, as the creator is not responsible for any profit or loss incurred.
Dynamo
╭━━━╮
╰╮╭╮┃
╱┃┃┃┣╮╱╭┳━╮╭━━┳╮╭┳━━╮
╱┃┃┃┃┃╱┃┃╭╮┫╭╮┃╰╯┃╭╮┃
╭╯╰╯┃╰━╯┃┃┃┃╭╮┃┃┃┃╰╯┃
╰━━━┻━╮╭┻╯╰┻╯╰┻┻┻┻━━╯
╱╱╱╱╭━╯┃
╱╱╱╱╰━━╯
Overview
Dynamo is built to be the Swiss-knife for price-movement & strength detection, it aims to provide a holistic view of the current price across multiple dimensions. This is achieved by combining 3 very specific indicators(RSI, Stochastic & ADX) into a single view. Each of which serve a different purpose, and collectively provide a simple, yet powerful tool to gauge the true nature of price-action.
Background
Dynamo uses 3 technical analysis tools in conjunction to provide better insights into price movement, they are briefly explained below:
Relative Strength Index(RSI)
RSI is a popular indicator that is often used to measure the velocity of price change & the intensity of directional moves. RSI computes the relative strength of the current price by comparing the security’s bullish strength versus bearish strength for a given period, i.e. by comparing average gain to average loss.
It is a range bound(0-100) variable that generates a bullish reading if average gain is higher, and a bullish reading if average loss is higher. Values over 50 are generally considered bullish & values less than 50 indicate a bearish market. Values over 70 indicate an overbought condition, and values below 30 indicate oversold condition.
Stochastic
Stochastic is an indicator that aims to measure the momentum in the market, by comparing most recent closing price of the security to its price range for a given period. It is based on the assumption that price tends to close near the recent high in an up trend, and it closes near the recent low during a down trend.
It is also range bound(0-100), values over 80 indicate overbought condition and values below 20 indicate oversold condition.
Average Directional Index(ADX)
ADX is an indicator that can quantify trend strength, it is derived from two underlying indices, known as Directional Movement Index(DMI). +DMI represents strength of the up trend, and -DMI represents strength of the down trend, and ADX is the average of the two.
ADX is non-directional or trend-neutral, which means, it does not follow the direction of the price, instead ADX will rise only when there is a strong trend, it does not matter if it’s an up trend or a down trend. Typical ranges of ADX are 25-50 for a strong trend, anything below 25 is considered as no trend or weak trend. ADX can frequently shoot upto higher values, but it generally finds exhaustion levels around the 60-75 range.
About the script
All these indicators are very powerful tools, but just like any other indicator they have their limitations. Stochastic & ADX can generate false signals in volatile markets, meaning price wouldn’t always follow through with what’s being indicated. ADX may even fail to generate a signal in less volatile markets, simply because it is based on moving averages, it tends to react slower to price changes. RSI can also lose it’s effectiveness when markets are trending strong, as it can stay in the overbought or oversold ranges for an extended period of time.
Dynamo aims to provide the trader with a much broader perspective by bringing together these contrasting indicators into a single simplified view. When Stochastic becomes less reliable in highly volatile conditions, one can cross validate their deduction by looking at RSI patterns. When RSI gets stuck in overbought or oversold range, one can refer to ADX to get better picture about the current trend. Similarly, various combinations of rules & setups can be formulated to get a more deterministic view, when working with either of these indicators.
There many possible use cases for a tool like this, and it totally depends on how you want to use it. An obvious option is to use it to trigger signals only after it has been confirmed by two or more indicators, for example, RSI & Stochastic make a great combination for cross-over or cross-under strategies. Some of the other options include trend detection, strength detection, reversals or price rejection points, possible duration of a trend, and all of these can very easily be translated into effective entry and exit points for trades.
How to use it
Dynamo is an easy-to-use tool, just add it to your chart and you’re good to start with your market analysis. Output consists of three overlapping plots, each of which tackle price movement from a slightly different angle.
Stochastic: A momentum indicator that plots the current closing price in relation to the price-range over a given period of time.
Can be used to detect the direction of the price movement, potential reversals, or duration of an up/down move.
Plotted as grey coloured histograms in the background.
Relative Strength Index(RSI): RSI is also a momentum indicator that measures the velocity with which the price changes.
Can be used to detect the speed of the price movement, RSI divergences can be a nice way to detect directional changes.
Plotted as an aqua coloured line.
Average Directional Index(ADX): ADX is an indicator that is used to measure the strength of the current trend.
Can be used to measure how strong the price movement is, both up and down, or to establish long terms trends.
Plotted as an orange coloured line.
Features
Provides a well-rounded view of the market movement by amalgamating some of the best strength indicators, helping traders make better informed decisions with minimal effort.
Simplistic plots that aim to convey clean signals, as a result, reducing clutter on the chart, and hopefully in the trader's head too.
Combines different types of indicators into a single view, which leads to an optimised use of the precious screen real-estate.
Final Note
Dynamo is designed to be minimalistic in functionality and in appearance, as it is being built to be a general purpose tool that is not only beginner friendly, but can also be highly-configurable to meet the needs of pro traders.
Thresholds & default values for the indicators are only suggestions based on industry standards, they may not be an exact match for all markets & conditions. Hence, it is advisable for the user to test & adjust these values according their securities and trading styles.
The chart highlights one of many possible setups using this tool, and it can used to create various types of setups & strategies, but it is also worth noting that the usability & the effectiveness of this tool also depends on the user’s understanding & interpretation of the underlying indicators.
Lastly, this tool is only an indicator and should only be perceived that way. It does not guarantee anything, and the user should do their own research before committing to trades based on any indicator.

Advanced ADX[Intellection]█ OVERVIEW
"ADX" is a popular technical analysis indicator used to determine trend strength.
Advanced ADX is divided in two main sectors:
Default ADX
Higher time frame ADX analysis and trend phase
█ DESCRIPTION
You have two ADX's, One has the same time frame as your chart and the other one can be set by yourself in settings, Named Vision time frame.
Default value of "Vision ADX" is on 240minutes means 4hour, We recommend for time frames less than 1h using 4h "Vision time frame".
"Vision main plot" is also based on higher time frame analysis. The higher time frame analysis uses a combination of Three exponential moving averages (67, 89 and 111 periods) and the ADX to determine the position for long or short trades. The "Vision main plot" is shaded and changes color:
Green means bull phase
Red means bear phase
Gray means not defined or neutral
█ TRADING GUIDES
You can filter your signals based on "Vision ADX" value and color
Some trading tips:
When in green zone we don't recommend going short or just lower your risk for short positions. Simply for when ever your position is opposite of the color.
When ADX stays for a long period under 30 then it crosses 30 you might consider a volatility is about to come!
Good volatilities come when there is huge distance between default "ADX" and "Vision ADX"
█ Recap
"Advanced ADX" indicates three analysis:
1-Indicates default "ADX" based on your time frame.
2-Indicates higher time frame "ADX" based on the time frame you choose in settings.
3-Indicates higher time frame trend phase.
Don't forget to take time and learn it before trading it.

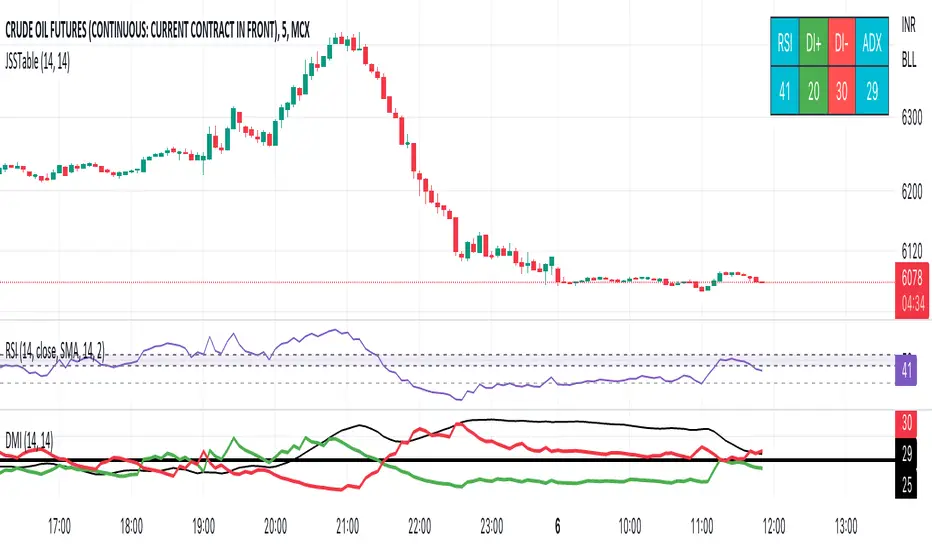
JSS Table - RSI, DI+, DI-, ADXSimple table to show the values for indicators which can be used to initiate trades:
RSI: Long above 55 // Short below 45 // Choppy between 45-55
DI+: Long above 25
DI-: Short above 25
Note when to avoid trend trades:
- If DI+ and DI- are both below 25 then market is choppy
- If RSI is between 45-55 then market is choppy
ADX Volume Trend
Thie indicator is a modified and upgraded version of the popular ADX tool.
ADX is used to determine the strength of a trend, and also to determine the direction in which the trend is likely to go.
With this script, I have added in the formula the usage of volume, leading to the following functionality.
The length is used to determine the period to calculate the trend strength and direction, and the average is used to then determine the oscillator and to confront the previous line.
The volume average determines how many volumes bars the indicator should use to determine if a volume bar is above or below average if volume mode is selected.
With the volume mode on, you'll get the DI+ and DI- lines, which are by default displayed as a histogram that calculates the difference between the two lines, called "Directional difference", are calculated using also the volume in the formula, multiplying the normal output by the volume multiplier. I suggest using this mode in high-volume markets.
The trend strength difference is the area calculated using the difference between the ADX line and his moving average and can be used to analyze divergences in the swing points.
It has a lot of improvements and new functionalities, like:
- Histogram to show the output at best
- Averages to compare the data
- The option to include the volume inside of the formula
- Other options and esthetic changes
This indicator is created to improve the usability of the popular ADX indicator, including the very important variable of the volumes, in fact, it's the best to use for the Volume Spread Analysis.

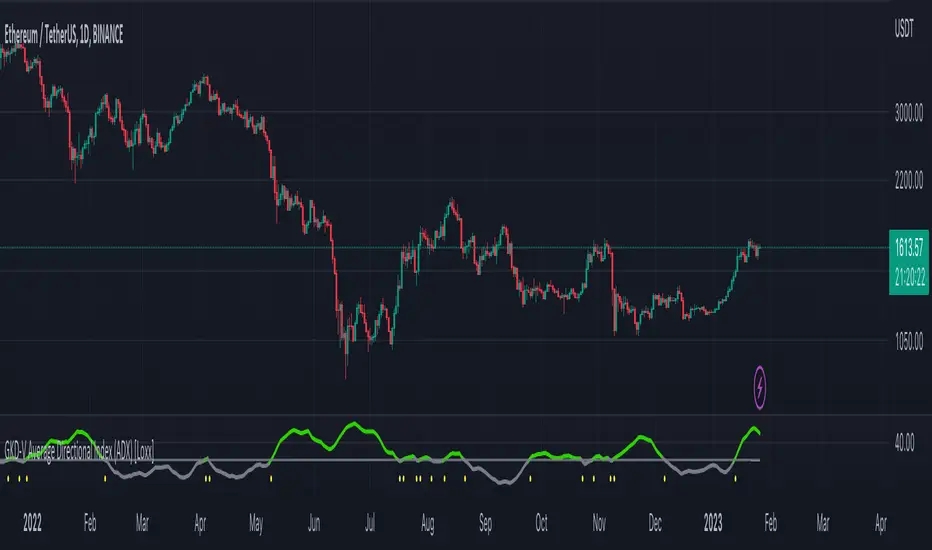
GKD-V Average Directional Index (ADX) [Loxx]Giga Kaleidoscope Average Directional Index (ADX) is a Volatility/Volume module included in Loxx's "Giga Kaleidoscope Modularized Trading System".
█ Giga Kaleidoscope Modularized Trading System
What is Loxx's "Giga Kaleidoscope Modularized Trading System"?
The Giga Kaleidoscope Modularized Trading System is a trading system built on the philosophy of the NNFX (No Nonsense Forex) algorithmic trading.
What is an NNFX algorithmic trading strategy?
The NNFX algorithm is built on the principles of trend, momentum, and volatility. There are six core components in the NNFX trading algorithm:
1. Volatility - price volatility; e.g., Average True Range, True Range Double, Close-to-Close, etc.
2. Baseline - a moving average to identify price trend
3. Confirmation 1 - a technical indicator used to identify trends.
4. Confirmation 2 - a technical indicator used to identify trends.
5. Continuation - a technical indicator used to identify trends.
6. Volatility/Volume - a technical indicator used to identify volatility/volume breakouts/breakdown.
7. Exit - a technical indicator used to determine when a trend is exhausted.
How does Loxx's GKD (Giga Kaleidoscope Modularized Trading System) implement the NNFX algorithm outlined above?
Loxx's GKD v1.0 system has five types of modules (indicators/strategies). These modules are:
1. GKD-BT - Backtesting module (Volatility, Number 1 in the NNFX algorithm)
2. GKD-B - Baseline module (Baseline and Volatility/Volume, Numbers 1 and 2 in the NNFX algorithm)
3. GKD-C - Confirmation 1/2 and Continuation module (Confirmation 1/2 and Continuation, Numbers 3, 4, and 5 in the NNFX algorithm)
4. GKD-V - Volatility/Volume module (Confirmation 1/2, Number 6 in the NNFX algorithm)
5. GKD-E - Exit module (Exit, Number 7 in the NNFX algorithm)
(additional module types will added in future releases)
Each module interacts with every module by passing data between modules. Data is passed between each module as described below:
GKD-B => GKD-V => GKD-C(1) => GKD-C(2) => GKD-C(Continuation) => GKD-E => GKD-BT
That is, the Baseline indicator passes its data to Volatility/Volume. The Volatility/Volume indicator passes its values to the Confirmation 1 indicator. The Confirmation 1 indicator passes its values to the Confirmation 2 indicator. The Confirmation 2 indicator passes its values to the Continuation indicator. The Continuation indicator passes its values to the Exit indicator, and finally, the Exit indicator passes its values to the Backtest strategy.
This chaining of indicators requires that each module conform to Loxx's GKD protocol, therefore allowing for the testing of every possible combination of technical indicators that make up the six components of the NNFX algorithm.
What does the application of the GKD trading system look like?
Example trading system:
Backtest: Strategy with 1-3 take profits, trailing stop loss, multiple types of PnL volatility, and 2 backtesting styles
Baseline: Leader Exponential Moving Average
Volatility/Volume: Average Directional Index (ADX) as shown on the chart above
Confirmation 1: Double Smoothed Stochastic of Momentum
Confirmation 2: Jurik Turning Point Oscillator
Continuation: Fisher Transform
Exit: Rex Oscillator
Each GKD indicator is denoted with a module identifier of either: GKD-BT, GKD-B, GKD-C, GKD-V, or GKD-E. This allows traders to understand to which module each indicator belongs and where each indicator fits into the GKD protocol chain.
Giga Kaleidoscope Modularized Trading System Signals (based on the NNFX algorithm)
Standard Entry
1. GKD-C Confirmation 1 Signal
2. GKD-B Baseline agrees
3. Price is within a range of 0.2x Volatility and 1.0x Volatility of the Goldie Locks Mean
4. GKD-C Confirmation 2 agrees
5. GKD-V Volatility/Volume agrees
Baseline Entry
1. GKD-B Baseline signal
2. GKD-C Confirmation 1 agrees
3. Price is within a range of 0.2x Volatility and 1.0x Volatility of the Goldie Locks Mean
4. GKD-C Confirmation 2 agrees
5. GKD-V Volatility/Volume agrees
6. GKD-C Confirmation 1 signal was less than 7 candles prior
Continuation Entry
1. Standard Entry, Baseline Entry, or Pullback; entry triggered previously
2. GKD-B Baseline hasn't crossed since entry signal trigger
3. GKD-C Confirmation Continuation Indicator signals
4. GKD-C Confirmation 1 agrees
5. GKD-B Baseline agrees
6. GKD-C Confirmation 2 agrees
1-Candle Rule Standard Entry
1. GKD-C Confirmation 1 signal
2. GKD-B Baseline agrees
3. Price is within a range of 0.2x Volatility and 1.0x Volatility of the Goldie Locks Mean
Next Candle:
1. Price retraced (Long: close < close or Short: close > close )
2. GKD-B Baseline agrees
3. GKD-C Confirmation 1 agrees
4. GKD-C Confirmation 2 agrees
5. GKD-V Volatility/Volume agrees
1-Candle Rule Baseline Entry
1. GKD-B Baseline signal
2. GKD-C Confirmation 1 agrees
3. Price is within a range of 0.2x Volatility and 1.0x Volatility of the Goldie Locks Mean
4. GKD-C Confirmation 1 signal was less than 7 candles prior
Next Candle:
1. Price retraced (Long: close < close or Short: close > close )
2. GKD-B Baseline agrees
3. GKD-C Confirmation 1 agrees
4. GKD-C Confirmation 2 agrees
5. GKD-V Volatility/Volume Agrees
PullBack Entry
1. GKD-B Baseline signal
2. GKD-C Confirmation 1 agrees
3. Price is beyond 1.0x Volatility of Baseline
Next Candle:
1. Price is within a range of 0.2x Volatility and 1.0x Volatility of the Goldie Locks Mean
3. GKD-C Confirmation 1 agrees
4. GKD-C Confirmation 2 agrees
5. GKD-V Volatility/Volume Agrees
█ Average Directional Index (ADX)
What is Average Directional Index (ADX)
Trading in the direction of a strong trend reduces risk and increases profit potential. The average directional index (ADX) is used to determine when the price is trending strongly. In many cases, it is the ultimate trend indicator. After all, the trend may be your friend, but it sure helps to know who your friends are.
ADX is used to quantify trend strength. ADX calculations are based on a moving average of price range expansion over a given period of time. The default setting is 14 bars, although other time periods can be used. ADX can be used on any trading vehicle such as stocks, mutual funds, exchange-traded funds and futures.
ADX is plotted as a single line with values ranging from a low of zero to a high of 100. ADX is non-directional; it registers trend strength whether price is trending up or down. The indicator is usually plotted in the same window as the two directional movement indicator (DMI) lines, but for our purposes here, we are only concerned with the ADX itself.
Signals
Traditional: ADX is above the threshold cutoff; both longs/shorts triggered when ADX is above the threshold cutoff
Crossing: ADX crosses above/below the threshold cutoff; longs or shorts are only valid on the candle where the cross happens. Both cross-ups and cross-downs are valid for both shorts and longs
Signal Modifiers
X-Bar Rule: If signals occur within XX bars, then the signal is still valid
Bars Rising: This is for traditional signals only. This requires that an upward slop of ADX be present over XX bars
Other things to note
The GKD trading system requires that a GKD-V indicator be present in the indicator chain, but the GKD-V indicator doesn't need to be active. You can turn on/off the Volatility Ratio as you wish so you can backtest your trading strategy with the filter on or off.
Additional features will be added in future releases.
This indicator is only available to ALGX Trading VIP group members . You can see the Author's Instructions below to get more information on how to get access.
Strategy Myth-Busting #5 - POKI+GTREND+ADX - [MYN]This is part of a new series we are calling "Strategy Myth-Busting" where we take open public manual trading strategies and automate them. The goal is to not only validate the authenticity of the claims but to provide an automated version for traders who wish to trade autonomously.
Our fifth one we are automating is one of the strategies from "The Best 3 Buy And Sell Indicators on Tradingview + Confirmation Indicators ( The Golden Ones ))" from "Online Trading Signals (Scalping Channel)". No formal backtesting was done by them and resuructo messaged me asking if we could validate their claims.
Originally, we mimic verbatim the settings Online Trading Signals was using however weren't getting promising results. So before we stopped there we thought we might want to see if this could be improved on. So we adjusted the Renko Assignment modifier from ATR to Traditional and adjusted the value to be higher from 30 to 47. We also decided to try adding another signal confirmation to eliminate some of the ranged market conditions so we choose our favorite, ADX . Also, given we are using this on a higher time-frame we adjusted the G-Channel Trend detection source from close to OHLC4 to get better average price action indication and more accurate trend direction.
This strategy uses a combination of 2 open-source public indicators:
poki buy and sell Take profit and stop loss by RafaelZioni
G-Channel Trend Detection by jaggedsoft
Trading Rules
15m - 4h timeframe. We saw best results at the recommended 1 hour timeframe.
Long Entry:
When POKI triggers a buy signal
When G-Channel Trend Detection is in an upward trend (Green)
ADX Is above 25
Short Entry:
When POKI triggers a sell signal
When G-Channel Trend Detection is in an downward trend (red)
ADX Is above 25
If you know of or have a strategy you want to see myth-busted or just have an idea for one, please feel free to message me.

Ichimoku Cloud and ADX with Trailing Stop Loss (by Coinrule)The Ichimoku Cloud is a collection of technical indicators that show support and resistance levels, as well as momentum and trend direction. It does this by taking multiple averages and plotting them on a chart. It also uses these figures to compute a “cloud” that attempts to forecast where the price may find support or resistance in the future.
The Ichimoku Cloud was developed by Goichi Hosoda, a Japanese journalist, and published in the late 1960s. It provides more data points than the standard candlestick chart. While it seems complicated at first glance, those familiar with how to read the charts often find it easy to understand with well-defined trading signals.
The Ichimoku Cloud is composed of five lines or calculations, two of which comprise a cloud where the difference between the two lines is shaded in.
The lines include a nine-period average, a 26-period average, an average of those two averages, a 52-period average, and a lagging closing price line.
The cloud is a key part of the indicator. When the price is below the cloud, the trend is down. When the price is above the cloud, the trend is up.
The above trend signals are strengthened if the cloud is moving in the same direction as the price. For example, during an uptrend, the top of the cloud is moving up, or during a downtrend, the bottom of the cloud is moving down.
DMI is simple to interpret. When +DI > - DI, it means the price is trending up. On the other hand, when -DI > +DI, the trend is weak or moving on the downside. The ADX does not give an indication of the direction but about the strength of the trend.
Typically values of ADX above 25 mean that the trend is steeply moving up or down, based on the -DI and +DI positioning. This script aims to capture swings in the DMI, and thus, in the trend of the asset, using a contrarian approach.
Trading on high values of ADX, the strategy tries to spot extremely oversold and overbought conditions. Values of ADX above 45 may suggest that the trend has overextended and is maybe about to reverse.
This strategy combines the Ichimoku Cloud with the ADX indicator to better enter trades.
Long orders are placed when these basic signals are triggered.
Long Position:
Tenkan-Sen is above the Kijun-Sen
Chikou-Span is above the close of 26 bars ago
Close is above the Kumo Cloud
MACD line crosses over the signal line
-DI is greater than +DI
ADX is greater than 45
Close Position:
3% increase trailing
3% decrease trailing
The script is backtested from December 2022 and provides good returns.
A trading fee of 0.1% is also taken into account and is aligned to the base fee applied on Binance.

Cuban's Pair Trading IndexThe purpose of this indicator is to visually simplify the relationship between two assets when searching for pair trades or higher beta opportunities.
With highly correlated pairs, it can be a blessing or a curse during volatility when you're somehow stuck in the only lower beta pairs, or maybe you're market neutral and the wrong leg starts nuking.
This indicator was built as a visual way to track pair relationships.
Fundamentally, this script does the following:
Plots the relative performance of the relationship between two assets across multiple time horizons
Uses a consistent measurement of historical performance, regardless of asset -- currently standard deviations, may add log difference in the future
Plots a custom Average Directional Index on the current chart ticker for current asset contextual momentum
Plots the average 'rotation' of both the ADX and Pair Delta independently, over n numbers of rotations -- able to be specified using the 'Rotation Lookback' variable
If you've never pair traded crypto before (i.e. long $DYDX, short $ETH), you might not be aware that most highly correlated alt asset returns tend to oscillate on a low timeframe rolling basis around the performance of the majors -- and more recently, predominantly $ETH. With this in mind and using this oscillator, we can track that relationship.
Users are given the ability to adjust the following:
Comparison Asset
Fast and Slow Delta Lookbacks
Whether to wait for one bar delay during security calls
Rotation Lookback
Rotation Threshold for Pair Delta and ADX independently
ADX Lookback
Whether to utilize the ADX on the current chart ticker or also net that off against the ADX of the comparison asset
TO DO:
Aesthetic update to Pair Delta plot
Permanent fix for security call forced delay

RSI & ADX [APIDEVs]The RSI ( Relative Strength Index ) is an oscillator-type indicator used by traders who perform technical analysis to estimate the status of overbought or oversold of an asset on the stock market.
This tool gives the trader the advantage of comparing supply and demand (buying and selling), therefore, we must take into account the following interpretation for its use.
If the buy and sell index are equal, the indicator takes a percentage value of 50, which indicates that the relative forces are in equity.
As its value is over 50%, it indicates that the buyer interest is higher than the seller.
When it is less than 50%, then we must know that the selling force is greater.
It also indicates that when the RSI is above 70 on the oscillator, the price is oversold, therefore, it should exit the market.
Similarly, when the RSI is below 30, the asset is oversold, so it is considered convenient to buy.
NEW RSI & ADX
The main improvement lies in the incorporation of a script that allows to visually observe the force of the movement and that this reinforces the perception of the RSI trajectory. It is for this reason that we incorporate the Average Directional Index ( ADX ) in this indicator so that through its logic it can provide other visual elements to help traders.
In this merger we try to maintain the original design of the RSI in order to make a clean integration that does not confuse traders with another indicator.
Improvements made:
• The coloration resulting from the crossing of the DI + and DI- of the ADX was incorporated into the line that marks point 50 of this indicator.
o When the Di + is above the DI- the trend is bullish therefore the middle line of the RSI will be painted green.
o When the Di- is above the DI + the trend is bearish therefore the middle line of the RSI will be painted green.
• A green background was added for the uptrend and red for the downtrend, which is activated exclusively when the price acquires a strong trend. This highly important feature for the interpretation of this new version of the indicator was absorbed from the ADX.
• A function was added that allows showing the weakness of the RSI by changing its color from green to red as the case may be.
• Thinking of the more traditional users, a function was incorporated that allows painting the RSI in a single color.
• A color selector was incorporated that allows painting the candles based on ADX or RSI.
• Added a side panel that indicates the numerical value of the ADX and the RSI.
• As a visual improvement, an upper and lower band was created that more clearly shows the oversold and overbought state of the oscillator.

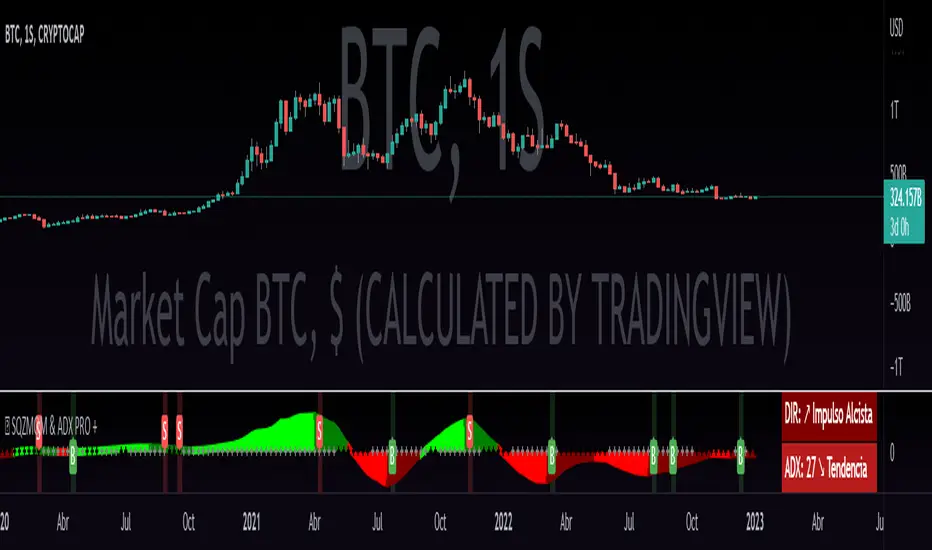
ADX_Oscillator [APIDEVs]ADX (ORIGINAL VERSION)
The ADX Indicator ( Average Directional Index ), is a non-directional oscillator type indicator, that is, it quantifies the strength of a trend regardless of its direction. In its original version, it is made up of 3 lines that represent the direction and strength of the movement:
• A line representing the ADX indicator.
• A green line representing the bullish Direction Index (DI +).
• A red line representing the Bearish Direction Index (DI-).
When the ADX is greater than 35, the market is in a strong trend, when it is between 35 and 20 the market is in trend and when it is less than 20 it indicates that the market is in range.
ADX OSCILLATOR (OUR VERSION)
At APIDEVs we really care about improving the understanding and experience of our users, which is why, in response to multiple requests, we decided to make important modifications to the ADX , which we consider to be the most powerful indicator of strength.
For many traders it was really confusing to understand that the ADX could be bullish or bearish and at the same time have the same numerical values, so in our version of the “ADX PRO +” we added colors and different intensity levels for your better understanding, however. , many needed a more explicit indicator and it is based on this request that we decided to take a leap into the incredible and that is how the “ADX OCILLATOR” was born.
We convert the ADX into a trend oscillator, now simpler and with multiple advantages which we will proceed to list:
1. The ADX was transformed into a directional oscillator whose color is based on the crossing of (DI +) and (DI-). This modification opens the door to the replacement of the Squeeze Momentum Indicator (SQZMOM) as a directional complement to the ADX .
2. A Background was added that is activated exclusively when the market has a strong upward or downward trend, specifying through its colors and intensity the type and direction of the force.
3. The original ADX parameters were adjusted to almost eliminate completely the “no trend” condition. This condition only created confusion for traders.
4. Added a system of signals based on the direction of the oscillator and the strength of the ADX .
• When the oscillator is sloping up and the ADX is green, the LONG (L) signal is activated.
• When the oscillator slopes downward and the ADX is red, the SHORT (S) signal is activated.
5. A side panel has been enabled that visually expresses the numerical value and direction of the ADX , as well as the direction of the oscillator.
6. An alert system was enabled so that traders receive notifications on all their devices:
• It is activated when the ADX changes color.
• It is activated when the Oscillator crosses the 0 point.
• It is activated when any input signal is activated.
RSI Bands [APIDEVs]RSI BANDS:
It is an exclusive product of ApiDevs, this indicator selectively integrates a series of highly advanced algorithms that aim to provide the trader with an effective and profitable trading system, based on a series of conditions that project the price direction with a reasonable probability.
This indicator bears the name of “RSI Bands”, this is because we have based this trading system on the “Relative Strength Index ( RSI )”, the strength of this indicator is centennial and we at APIDEVs have decided to focus our efforts on the development of powerful tools based on the favorite indicators of the afternoon.
WHAT IT HAS INCORPORATED:
1. Exponential Moving Average (EMAs): The RSI Bands has, by default, a band composed of two moving averages of 10 and 55 exponential periods, which can be modified in the indicator menu.
• Possibility of changing the value of the EMAs.
• Function was enabled to change the color and transparency of the bands.
• Visual alerts SHORT (L) and LONG (L) were added when there is the crossing of the EMAS.
• Hull Moving Average ( HMA ) of 100 periods was also incorporated, also modifiable for those who wish to strengthen their visual analysis. (Disabled by default)
• We also add an Exponential Moving Average ( EMA ) of 200 periods to mark the trend. (Disabled by default).
2. ATR ( Average True Range ): This indicator has two main functions in the RSI Bands, the first is to mark the trend of the asset and the second is to establish a margin of safety in price volatility , that is, a maximum estimate of the setbacks without this representing a change in the direction of the price.
3. RSI ( Relative Strength Index ): It was visually incorporated into the RSI Bands, the graph is obtained on the right side and its purpose is to visually indicate where the price is with respect to the RSI PRO+ indicator, offering the following improvements :
• ALERT SYSTEM: THE RSI PRO+ has the ADX incorporated into its algorithm, which allows establishing a filter that will provide reliable inputs, represented by the LONG (L) and SHORT (S) signals.
• FILTER AGAINST TREND: The signals described above will be activated according to the crossing of the RSI above the 50 point, provided that the ADX agrees with the market direction.
• Possibility of deactivating this graphical representation.
4. ADX ( Average Directional Index ): The ADX in this indicator is intended to estimate the strength of the movement, it is present in each part of the code, either to indicate the strength of the market or to serve as a filter against trend. In the same way, we apply certain exclusive improvements for this indicator:
• It was established as default values of the ADX that the Level Range was 10 and the Level Trend 25. This significantly changes the behavior of this indicator, almost completely eliminating the zone of disinterest that was usually considered.
• A function was activated to paint the sails the color of the ADX .
5. ADX Ocillator: Yes, we developed a Wave oscillator type ADX and incorporated it into this strategy. From this indicator, which we recommend using in conjunction with the RSI Bands, we extracted the LONG (L) and SHORT (S) signals. The ADX Oscillator is the improved version of the traditional ADX as it offers the following improvements:
• Its interpretation is much simpler.
• Allows you to set entry and exit signals during the trend change and during the price path.
• It has an integrated alert system.
STRATEGY PANEL:
This panel is an exclusive creation of APIDEVs, and its purpose is to parameterize five conditionals based on the indicators that make up our RSI strategy, giving the trader an immediate vision of the status of the asset analyzed considering this strategy. That is, we decided to transfer our experience of using this indicator on a panel that will project the price trajectory visually. It has the following characteristics:
• It can be placed anywhere on the screen through the main menu of the indicator, it can even be deactivated.
• It can be resized, we designed this to adapt to all types of screens, including those of mobile phones.
• It has an upper panel called "Project" which will calculate the percentage probability that the price has to take a direction based on all the indicators incorporated into the strategy. Their values range from (+ 100%) to (-100%).
STRATEGY PANEL PARAMETERS:
1. EMAs: This panel has 2 variables:
• LONG: If the fast EMA is above the slow EMA .
• SHORT: If the fast EMA is below the slow EMA .
2. RSI: This panel has 3 variables:
• LONG: The RSI should be bullish (green) and above the 50 point.
• SHORT: The RSI should be bearish (red) and be below the 50 point.
• RANK: (Range)this condition is activated when there is no concordance with the RSI condition and its crossing.
3. ATR: This panel has 2 variables:
• LONG: When the price is above the ATR.
• SHORT: When the price is below the ATR.
4. ADX: This panel has 3 variables:
• LONG: The ADX is green. That is, the DI + is above the DI-.
• SHORT: The ADX is red. That is, the DI- is above the DI +.
• RANK: ADX is below point 10.
It also has a numerical value that indicates the value of the ADX and two texts indicating the strength of the trend:
• Trend ( bullish or bearish ).
• Strong trend ( bullish or bearish ).
5. OSC: This panel has 3 variables:
• LONG: The oscillator slopes upward and the built-in ADX is green.
• SHORT: The oscillator slopes downward and the built-in ADX is red.
• RANK: The oscillator slopes downward and the built-in ADX is green and the opposite. In short, there is no coherence in the movement of the oscillator and the projection of the ADX .

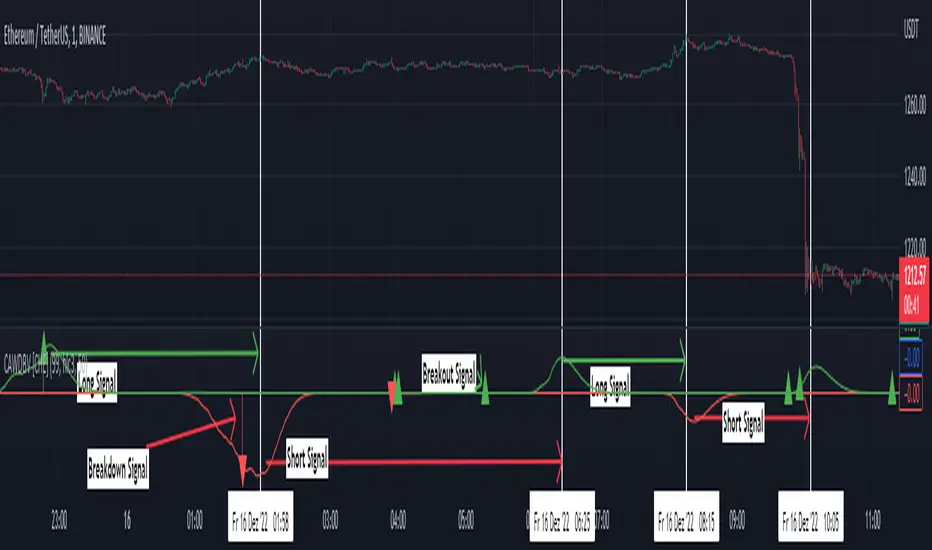
TL_Strategy [APIDEVs]TL_STRATEGY:
The TL_STRATEGY , is a whole ecosystem of indicators that make up a quite powerful and famous strategy in cryptocurrency trading, it is composed of the following indicators:
• Exponential moving media bands (10 and 55).
• Squeeze Momentum indicator (SQZMON PRO +).
• Volume profile (VP Developed by APIDEVs).
• Average directional index ( ADX PRO +).
In ApiDev , we decided to visually optimize this strategy, that is why we created an information panel that shows the joint projection of all the indicators that we already mentioned.
IMPROVEMENTS MADE IN THE STRATEGY:
Simpler: We simplified the interface of all indicators [so that the trader can follow the ABCs of his strategy without much complication.
Buy and sell signals: Based on a strategy that incorporates two moving averages of 10 and 55 periods, the observation of the strength of the ADX and the directionality of the oscillators of the SQZMON, signals of buying and selling to be valued by the trader.
Side panel: We integrate a side panel that allows observing the assessment and direction of all the indicators that make up the strategy.
It has an alert system that will send notifications about the changes that occur in the indicator.

QZMOM & ADX PRO+The Momentum Squeeze Indicator is a momentum oscillator that indicates how explosively the price will move. Its first known version was called "TTM Squeeze" by John Carter explained in his book "Mastering the Trade" (chapter 11) and popularized in TradingView by a developer named LazyBear.
The black crosses on the center line show that the market has just entered a consolidation. This means low volatility, the market is preparing for an explosive move (up or down). The gray crosses mean the "Squeeze". Carter suggests waiting until the first gray after a black cross and taking a position in the direction of the oscillator. For its part, LazyBear recommends using an additional indicator such as ADX to improve the effectiveness of entry points and position closures.
Oscillator understanding improvements:
During the indicator creation process we were able to better understand the logic of the oscillator and based on that knowledge we implemented improvements.
Oscillator development improvements:
Side panel:
The ADX algorithm was incorporated, which is displayed numerically on the right panel of the indicator, shows the value of ADX and its directionality.
Added an arrow pointer to indicate oscillator directionality.
Two exponential moving averages of 11 and 55 periods have been added to the right panel, this will mark if the trend is bullish or bearish depending on the crossover of the EMAs.
An indicator of the Indicator Squeeze was also included, which marks the periods of price consolidation (OFF) and the periods in which the price should react explosively.
Added a feature that allows automatic color changing of the panels based on the color of the oscillator and the ADX.
o ADX: Dark green (bullish force).
o ADX: Light green (loss of bullish strength).
o ADX: Dark red (bearish force).
o ADX: Light red (loss of bearish strength).
o ADX: Orange (loss of strength, disinterest and low volume).
Signs:
A very famous strategy that we have learned is that of the trading expert Jaime Merino, who by combining the Momentum Squeeze Indicator and a ADX común, logró vincular eficientemente la debilidad del ADX con el inicio de un momentum alcista o bajista. La parametrización de su estrategia se señaló en alertas de compra y venta, que se representan de la siguiente manera:
B (Comprar): se activa cuando un movimiento bajista marcado por el ADX (pendiente negativa) termina y el oscilador toma direccionalidad alcista (impulso alcista).
S (Vender): se activa cuando un movimiento alcista marcado por el ADX (pendiente negativa) termina y el oscilador toma direccionalidad bajista (momentum bajista).
Filter:
To prevent any trader from trading against the trend, a filter was added that limits bearish entry alerts when the trend is up and vice versa, that is, when the EMA 10 is above the EMA 55, it is understood that the trend is up in that time frame, therefore bearish entry alerts will not be triggered. It will be the decision of each trader to activate or deactivate this function.
Alerts:
This is without a doubt the most awaited function for all Latin American traders, (Just kidding), but being aware, I am very proud of the implementation of alerts for each improvement made to this indicator, if you decide to use the Momentum Squeeze Indicator you can automate alerts for the following actions:
Buy and sell alerts.
Alerts to activate the Squeeze to (ON).
Oscillator quadrant change alerts
or bullish momentum.
or bearish momentum.
o Bullish force.
o Bearish force.
Recommendations:
One of the things that became clearer in the development of this indicator is the coloring of the dials, which is why we recommend the use of four colors, one for each oscillator grid.
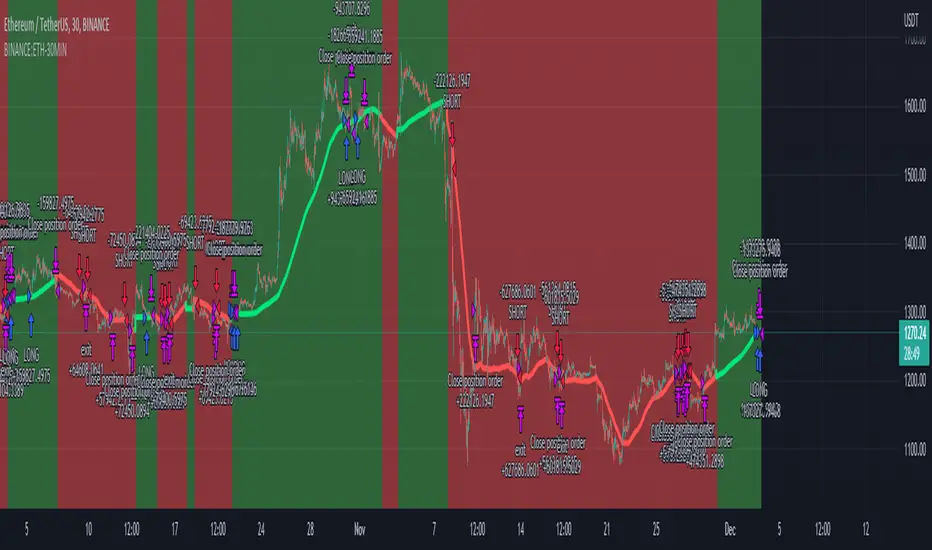
MACD + RSI + ADX Strategy (ChatGPT-powered) by TradeSmartThis is a trading strategy made by TradeSmart, using the recommendations given by ChatGPT . As an experiment, we asked ChatGPT on which indicators are the most popular for trading. We used all of the recommendations given, and added more. We ended up with a strategy that performs surprisingly well on many crypto and forex assets. See below for exact details on what logic was implemented and how you can change the parameters of the strategy.
The strategy is a Christmas special , this is how we would like to thank the support of our followers.
The strategy has performed well on Forex, tested on 43 1-hour pairs and turned a profit in 21 cases. Also it has been tested on 51 crypto pairs using the 1-hour timeframe, and turned a profit in 45 cases with a Profit Factor over 1.4 in the top-5 cases. Tests were conducted without commission or slippage, unlike the presented result which uses 0.01% commission and 5 tick slippage.
Some of the top performers were:
SNXUSDT
SOLUSDT
CAKEUSDT
LINKUSDT
EGLDUSDT
GBPJPY
TRYJPY
USDJPY
The strategy was implemented using the following logic:
Entry strategy:
Long entry:
Price should be above the Simple Moving Average (SMA)
There should be a cross up on the MACD (indicated by the color switch on the histogram, red to green)
RSI should be above the 50 level
Volume is above the selected volume-based Exponential Moving Average (EMA)
ADX should also agree to this position: below 50 and over 20, and above the Regularized Moving Average (REMA)
Short entry:
Price should be under the Simple Moving Average (SMA)
There should be a cross down on the MACD (indicated by the color switch on the histogram, red to green)
RSI should be below the 50 level
Volume is above the selected volume-based Exponential Moving Average (EMA)
ADX should also agree to this position: below 50 and over 20, and above the Regularized Moving Average (REMA)
Exit strategy:
Stop Loss will be placed based on ATR value (with 1.5 Risk)
Take profit level will be placed with a 2.5 Risk/Reward Ratio
Open positions will be closed early based on the Squeeze Momentum (Long: change to red, Short: change to green)
NOTE! : The position sizes used in the example is with 'Risk Percentage (current)', according which the position size will be determined such
that the potential loss is equal to % of the current available capital. This means that in most of the cases, the positions are calculated using leverage.
Parameters of every indicator used in the strategy can be tuned in the strategy settings as follows:
Plot settings:
Plot Signals: true by default, Show all Long and Short signals on the signal candle
Allow early TP/SL plots: false by default, Checking this option will result in the TP and SL lines to be plotted also on the signal candle rather than just the entry candle. Consider this only when manual trading, since backtest entries does not happen on the signal candle.
Entry Signal:
Fast Length: 12 by default
Slow Length: 26 by default
Source: hlcc4 by default
Signal Smoothing: 9 by default
Oscillator MA Type: EMA by default
Signal Line MA Type: EMA by default
Exit Strategy:
ATR Based Stop Loss: true by default
ATR Length (of the SL): 14 by default
ATR Smoothing (of the SL): EMA by default
Candle Low/High Based Stop Loss: false by default, recent lowest or highest point (depending on long/short position) will be used to calculate stop loss value. Set 'Base Risk Multiplier' to 1 if you would like to use the calculated value as is. Setting it to a different value will count as an additional multiplier. Please select only one active stop loss. Default value (if nothing or multiple stop losses are selected) is the 'ATR Based Stop Loss'.
Candle Lookback (of the SL): 10 by default
Base Risk Multiplier: 1.5 by default, the stop loss will be placed at this risk level (meaning in case of ATR SL that the ATR value will be multiplied by this factor and the SL will be placed that value away from the entry level)
Risk to Reward Ratio: 2.5 by default, the take profit level will be placed such as this Risk/Reward ratio is met
Force Exit based on Squeeze Momentum: true by default, a Long position will be closed when Squeeze Momentum turns red inside an open position and a Short position will be closed when Squeeze Momentum turns green inside an open position
BB Length: 20 by default
BB Mult Factor: 1.0 by default
KC Length: 20 by default
KC Mult Factor: 1.5 by default
Use True Range (KC): Yes by default
Base Setups:
Allow Long Entries: true by default
Allow Short Entries: true by default
Order Size: 1.5 by default
Order Type: Risk Percentage (current) by default, allows adjustment on how the position size is calculated: Cash: only the set cash ammount will be used for each trade Contract(s): the adjusted number of contracts will be used for each trade Capital Percentage: a % of the current available capital will be used for each trade Risk Percentage (current): position size will be determined such that the potential loss is equal to % of the current available capital Risk Percentage (initial): position size will be determined such that the potential loss is equal to % of the initial capital
Trend Filter:
Use long trend filter: true by default, only enter long if price is above Long MA
Show long trend filter: true by default, plot the selected MA on the chart
MA Type (Long): SMA by default
MA Length (Long): 100 by default
MA Source (Long): close by default
Use short trend filter: true by default, only enter long if price is under Short MA
Show short trend filter: false by default, plot the selected MA on the chart
MA Type (Short): SMA by default
MA Length (Short): 100 by default
MA Source (Short): close by default
Simple RSI Limiter:
Limit using Simple RSI: true by default, if set to 'Normal', only enter long when Simple RSI is lower then Long Boundary, and only enter short when Simple RSI is higher then Short Boundary. If set to 'Reverse', only enter long when Simple RSI is higher then Long Boundary, and only enter short when Simple RSI is lower then Short Boundary.
Simple RSI Limiter Type:
RSI Length: 14 by default
RSI Source: hl2 by default
Simple RSI Long Boundary: 50 by default
Simple RSI Short Boundary: 50 by default
ADX Limiter:
Use ADX Limiter: true by default, only enter into any position (long/short) if ADX value is higher than the Low Boundary and lower than the High Boundary.
ADX Length: 5 by default
DI Length: 5 by default
High Boundary: 50 by default
Low Boundary: 20 by default
Use MA based calculation: Yes by default, if 'Yes', only enter into position (long/short) if ADX value is higher than MA (ADX as source).
MA Type: REMA by default
MA Length: 5 by default
Volume Filter:
Only enter trades where volume is higher then the volume-based MA: true by default, a set type of MA will be calculated with the volume as source, and set length
MA Type: EMA by default
MA Length: 10 by default
Session Limiter:
Show session plots: false by default, show crypto market sessions on chart: Sidney (red), Tokyo (orange), London (yellow), New York (green)
Use session limiter: false by default, if enabled, trades will only happen in the ticked sessions below.
Sidney session: false by default, session between: 15:00 - 00:00 (EST)
Tokyo session: false by default, session between: 19:00 - 04:00 (EST)
London session: false by default, session between: 03:00 - 11:00 (EST)
New York session: false by default, session between: 08:00 - 17:00 (EST)
Date Range:
Limit Between Dates: false by default
Start Date: Jul 01 2021 00:00:00 by default
End Date: Dec 31 2022 00:00:00 by default
Trading Time:
Limit Trading Time: false by default, tick this together with the options below to enable limiting based on day and time
Valid Trading Days Global: 1234567 by default, if the Limit Trading Time is on, trades will only happen on days that are present in this field. If any of the not global Valid Trading Days is used, this field will be neglected. Values represent days: Sunday (1), Monday (2), ..., Friday (6), Saturday(7) To trade on all days use: 123457
(1) Valid Trading Days: false, 1234567 by default, values represent days: Sunday (1), Monday (2), ..., Friday (6), Saturday(7) The script will trade on days that are present in this field. Please make sure that this field and also (1) Valid Trading Hours Between is checked
(1) Valid Trading Hours Between: false, 0930-1600 by default, hours between which the trades can happen. The time is always in the exchange's timezone
Fine-tuning is highly recommended when using other asset/timeframe combinations.

Clean ADX with bidirectional Breakout VolumeThe default Average Directional Index (ADX) helps traders determine the strength of a trend, not its actual direction. The Clean ADX helps traders determine the strength of a trend on a longer time, and the possible direction on different timeframes.
The bidirectional Breakout Volume determines both directions of breakout or breakdown volume. When volume is high by comparing the previous volume high over n periods to the current volume or when volume is lower by comparing the previous volume low over n periods to the current volume.
If the current volume exceeds the previous volume high or low, then the indicator columns will turn red or green.
This indicator should make trading easier and improve analysis. Nothing is worse than indicators that give confusingly different signals.
The combination of the first and second indicator therefore makes perfect sense to me and now you are able to find your long or short trends earlier.
I hope you enjoy my new ideas
best regards
Chervolino
ZenBot Signals - Trend StrengthI developed this indicator as a "regime detection" for my algo trading bot. It uses the ADX +/- values with a few twists.
- If ADX DI+ is over 30 and DI- is below 20 and falling (inverse for shorts)
- Price action rising/falling thru various VWAP standard deviations indicates a strong trend break
- Some other custom juju (open source so have fun).
I use this primarily to monitor the SPY index as a backdrop for my long and short trades. If the colored line below price bars is red or green, a strong trend is present and there is a decent trade environment.

ETHUSDT Long-Short using EMA,OBV,ADX,LinearReg,DXY(No repaint)This script strategy is used to follow the trending EMA with a delta difference (Price-EMA) to know when to enter and with 5 variables mentioned below, stop loss is below EMA line all the time in long and above EMA line in short, is like a trailing stop after candle is closed. Hard stop is also placed to prevent big candles movements, also correlation between VIX and ETH when the correlation is <-0.2 the position can be opened.
Indicators used:
EMA , OBV , ADX , Linear regression and Dollar Index trending, Leverage is available for Long and Short positions.
LONG
When Price is above EMA and price-ema difference is smaller than "Long delta Price/MA"
OBV(4hrs) is above OBV-EMA(110)
Linear regression is strong
ADX is strong >50
DXY is trending down
SHORT
When Price is below EMA and ema-price difference is smaller than "Long delta Price/MA"
OBV(4hrs) is below OBV-EMA(110)
Linear regression is weak
ADX is weak <50
DXY is trending up
BINANCE:ETHUSDT 30 minutes Timeframe
Wunder Keltner botWunder Keltner bot
1. Wunder Keltner bot is based on the breakout of the Keltner channel. For calculation, 2 channels are used, one for long trades, and the other for short trades. The division into 2 channels is used for more accurate entry calculations depending on trend directions.
2. The ADX indicator is used to filter signals and determine the trend strength. ADX determines the strength of the trend and confirms the entry into the strategy if the value is greater than the level indicated in the settings.
3. There are 3 ways to calculate Stop Loss and Take Profit. You can choose one of them:
Classic Stop Loss and Take Profit in a fixed percentage
ATR Stop Loss
Keltner. Stop Loss, which is set on the opposite Keltner’s Channel Band from Keltner breakout.
4. ATR and Keltner use Risk Reward (R:R) to calculate Take Profit. The script calculates Risk Reward based on the determined Stop loss level and uses the ration to calculate Take Profit.
5. A function for calculating risk on the portfolio (your deposit) has been added to the script. When this option is enabled, you get a calculation of the entry amount in dollars relative to your Stop Loss. In the settings, you can select the risk percentage on your portfolio. The loss will be calculated from the amount that will be displayed on the chart.
For example. Deposit - $1000, you set the risk to 1%. SL 5%. Entry volume will be $200. The loss at SL will be $10.10$ this is your 1% risk or 1% of the deposit.
Important! The risk per trade must be less than the Stop Loss value. If the risk is greater than SL, then you should use leverage.
The amount of funds entering the trade is calculated in dollars. This option was created if you want to send the dollar amount from Tradingview to the exchange. However, putting your volume in dollars you get the incorrect net profit and drawdown indication in the backtest results, as TradingView calculates the backtest volume in contracts.
To display the correct net profit and drawdown values in Tradingview Backtest results, use the ”Volume in contract” option.

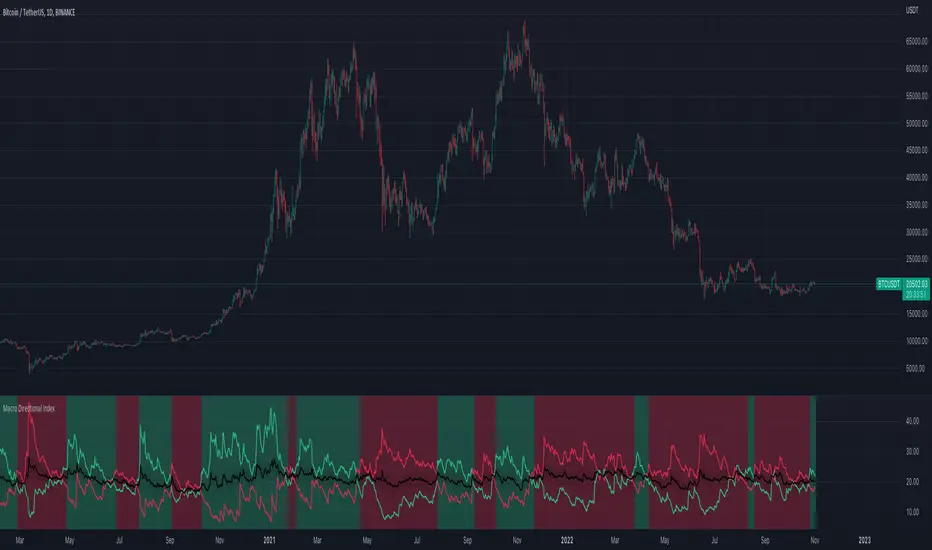
Macro Directional IndexCore to this indicator is the rate at which DI+ and DI- are moving away or towards each other. This is called The Rate of Change (ROC). The ROC length dictates how many bars back you want to compare to the current bar to see how much it has changed. It is calculated like this:
(source - source /source ) * 100
This indicator has 4 values in the status line:
DI+
DI-
Distance between DI+ and DI-
DI Rate of Change
DI Rate of Change
The rate of change is smoothed using an EMA. A shorter EMA length will cause the ROC to flip back and forth between positive and negative while a larger EMA length will cause the ROC to change less often. "Since the rate of change is used to indicate periods of 'consolidation', you want to find a setting that doesn't flip back and forth too often.
Directional Index Middle Channel
Between the DI+ and DI- is a black centerline. Offset from this centerline is a channel that is used to filter out false crosses of the DI+ and DI-. Sometimes, the DI+ and DI- lines will come together in this channel and cross momentarily before resuming the direction prior to the cross. When this happens, you don't want to flip your bias too soon. The wider the channel, the later the indicator will signal a DI reversal. A narrower channel will call it sooner but risks being more choppy and indicating a false cross."
Alpha ADX DI+/DI- V5 by MUNIF SHAIKHMODIFIED ADX DI+/DI- V5
Usage: To use this indicator for entry: when DMI+ crosses over DMI-, there is a bullish sentiment, however ADX also needs to be above 25 to be significant, otherwise the move is not necessarily sustainable.
Inversely, when DMI+ crosses under DMI- and ADX is above 25, then the sentiment is significantly bearish , but if ADX is below 20, the signal should be disregarded.
The line control represents, if the ADX is greater than the line of 25, the price trend is considered strong
