INVITE-ONLY SCRIPT
Overbalance
Atualizado

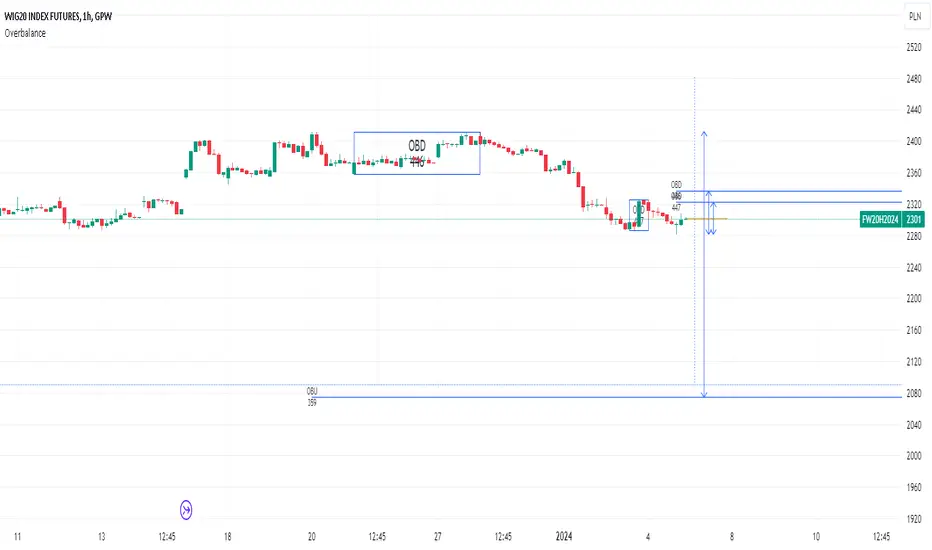
Overbalance script tracks trend moves and biggest corrections in those moves.
Based on last trend extreme value (low or high) it can draw line symbolizing correction equal to
the biggest correction in that trend. It can track up to 20 independent (both up and down) trends on one chart.
Overbalance method works on an assumption that trend continues until we have correction bigger than the biggest existing correction in that trend. Comparing the historically biggest correction with the current one can give a warning signal.
There are markets and instruments for which the size of corrections is repeated, and tracking corrections in the trend can be used to predict the trend change moment. - Just remember that if something happened in the past it is not guaranteed that it will happen again.
This script can be used by ANY user. You DO NOT NEED to have PRO or PREMIUM account to use it.
Script settings:
Trend min change [%] - Filter out price moves smaller than % of current price.
OB up - Showing overbalance in up trends
OB down - Showing overbalance in down trends
Historical with precision [%] - Showing corrections moves that were equal to biggest previous correction in that trend with a given (%) precision.
OB prediction up - Showing overbalance threshold in current up trends
OB prediction down - Showing overbalance threshold in current down trends
OB Exceeded - Showing broken overbalance thresholds
Arrows - Showing overbalance thresholds with an arrows
(with labels) - Showing labels over overbalance threshold arrows
Price line - It draws a line at the price level, under the arrows.
Troubleshooting:
In case of any problems, send error details to the author of the script.
Notas de Lançamento
Package of improvements and bug fixes:- Table with all trends, overbalance values and fib retracements factors.
- Broken trends are marked in the table with the red background
- New settings section:
Table: Position - Defining place where table will be drawn
Text - Defining table text size
List of fields visible in the table:
From value - Showing price value at the start point of a trend.
From time - Showing for how many days this trend exist.
Fib. retr. max - Showing what was the maximal fibonacci retracement for this trend.
Fib. retr. cur - Showing fibonacci retracement value for the current price.
Fib retr. OB - Showing fibonacci retracement value for overbalance threshold.
Ob. distance - Showing price distance from the overbalance threshold.
Verify Fib retr with inaccuracy ‰ - Feature that is highlighting fibonacci retracement values having value around typical fibonacii value with the provided precision ( in ‰)
Script sob convite
O acesso a este script é restrito aos usuários autorizados pelo autor e pode requerir pagamento. Você pode adicioná-lo a seus favoritos, mas só poderá utilizá-lo após solicitar permissão e obtê-la do autor. Contate Investor_R para mais informações, ou siga as instruções do autor abaixo.
O TradingView não sugere pagar por um script e usá-lo, a menos que você confie 100% no seu autor e entenda como o script funciona. Em muitos casos, você pode encontrar uma boa alternativa de código aberto gratuita nos nossos Scripts da Comunidade.
Instruções do autor
″To get access or report problem write on toolkit4trading@proton.me
Quer usar esse script no gráfico?
Aviso: por favor leia antes de solicitar acesso.
To get access or report problem write on toolkit4trading@proton.me
More details on Website and Youtube.
More details on Website and Youtube.
Aviso legal
As informações e publicações não devem ser e não constituem conselhos ou recomendações financeiras, de investimento, de negociação ou de qualquer outro tipo, fornecidas ou endossadas pela TradingView. Leia mais em Termos de uso.