PROTECTED SOURCE SCRIPT
Atualizado Auto Market Bias Dashboard |TG|
Overview
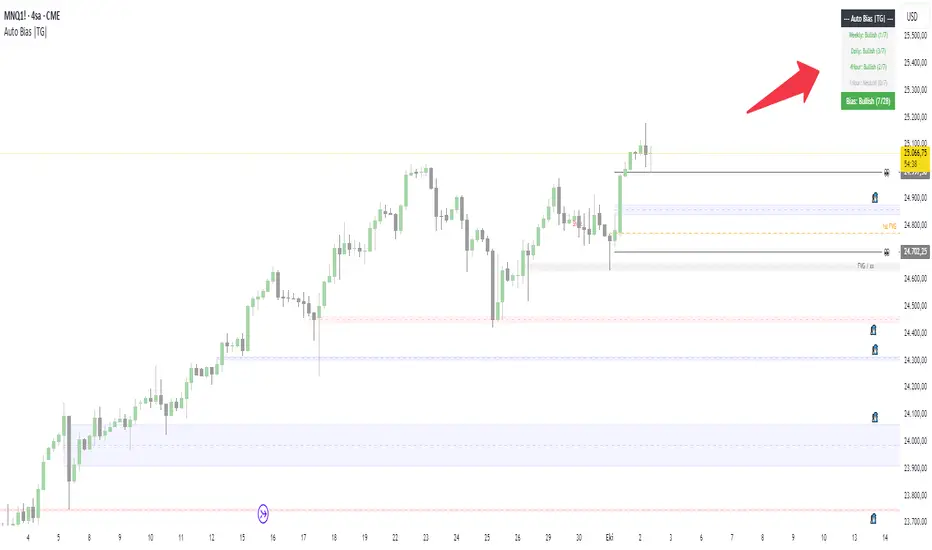
The Auto Market Bias Dashboard is a Pine Script v5 indicator developed on the TradingView platform. This tool automatically calculates and visualizes the market bias for the selected asset (crypto, forex, or futures). By analyzing the market structure across different timeframes (Weekly, Daily, 4-Hour, 1-Hour), it identifies bullish, bearish, or neutral trends. Its main purpose is to provide traders with a quick summary to simplify the decision-making process. The indicator is optimized particularly for 1-hour and higher timeframes and issues warnings on lower timeframes.
How It Works?
The indicator uses a scoring system based on 7 fundamental questions for each timeframe. Each question evaluates market dynamics and assigns a score of +1 (bullish), -1 (bearish), or 0 (neutral):
Is the Trend in an Upward Direction? – The closing price is checked against the 20-period SMA.
Has the Previous Candle's High Been Breached? – For breakout analysis, the close is evaluated against the previous candle's high/low.
Was Respect Paid to PDA? (FVG/Sweep) – Market structure alignment is sought through Fair Value Gap (FVG) detection (calculated specifically for each TF).
Is Volume Increasing in the Direction of Price? – Volume is compared to its 20-period SMA and the candle direction (TF-specific).
Does the Correlated Asset Show the Same Bias? – Trend alignment is checked with the selected correlated asset (e.g., ES1!, MNQ1!, MES1!); neutral conditions are supported.
Market Structure – Reversal signals are sought through pivot high/low detection (high: bearish, low: bullish).
Has Volatility Increased? – ATR (14 periods) and its SMA (20 periods) are combined with the candle direction (TF-specific).
The total bias for each timeframe is calculated (/7). The overall bias combines the weekly score with double weighting ((Weekly × 2) + Daily + 4H + 1H = /28). Results:
Positive (>0): Bullish (Green) – Buying opportunity.
Negative (<0): Bearish (Red) – Selling opportunity.
Zero: Neutral (Silver) – Indecisive.
Notas de Lançamento
Monthly bias added.Notas de Lançamento
Time interval settings have been added; you can now open and close the time interval you want.Notas de Lançamento
Improvement Script protegido
Esse script é publicada como código fechado. No entanto, você pode usar ele livremente e sem nenhuma limitação – saiba mais aqui.
Aviso legal
As informações e publicações não devem ser e não constituem conselhos ou recomendações financeiras, de investimento, de negociação ou de qualquer outro tipo, fornecidas ou endossadas pela TradingView. Leia mais em Termos de uso.
Script protegido
Esse script é publicada como código fechado. No entanto, você pode usar ele livremente e sem nenhuma limitação – saiba mais aqui.
Aviso legal
As informações e publicações não devem ser e não constituem conselhos ou recomendações financeiras, de investimento, de negociação ou de qualquer outro tipo, fornecidas ou endossadas pela TradingView. Leia mais em Termos de uso.