O que são intervalos baseados em segundos
Second-based intervals show price movements in very short time windows. You can configure them to see rapid price changes even within one second. They can help you see exactly when prices jump up or down during the trading day. Essential for high-frequency trading strategies and precise entry timing, you can use them on our Supercharts along with many other tools for high-frequency trading.
CONTENTS:
- What are second-based intervals
- Second-based intervals vs tick-based intervals
- How to enable second-based intervals
- Additional tools for second-based trading
What are second-based intervals
If you're an intraday trader, seconds matter. With intervals based on seconds, you can see price action almost in real time and respond quickly. They're especially helpful during high volatility and news-driven events.
The interval is displayed on the X (horizontal) axis of the Supercharts. After a certain amount of time passes, new elements are added. For example, if you select the hollow candle chart type and a 10-second interval, each candle will represent ten seconds of price movement regardless of how sharp or still it's been.
On TradingView, you can choose flexible intervals to match your strategy: 1, 5, 10, 15, 30, and 45 seconds.
Second-based intervals vs tick-based intervals
These two intervals are similar in that they can both present the most precise data when plotting a chart's elements. A second is the smallest amount of time, and a tick is the smallest amount of price.
The core difference between these two is that the first is a time-based interval and the second is a price-based interval. Because of that, they present you with different opportunities.
Second-based intervals
- Use time on the X (horizontal) axis of the chart
- Work with any chart type
- May clutter your chart with empty and less informative elements during periods of low trading activity or for assets with low liquidity
Tick-based intervals
- Use price for the X (horizontal) axis of the chart
- Don't work with Renko, line break, Kagi, point and figure, and range charts
- Filter out quiet periods automatically
How to enable second-based intervals
These intervals are available for the most liquid symbols, including stocks, indices, cryptocurrencies, and futures.
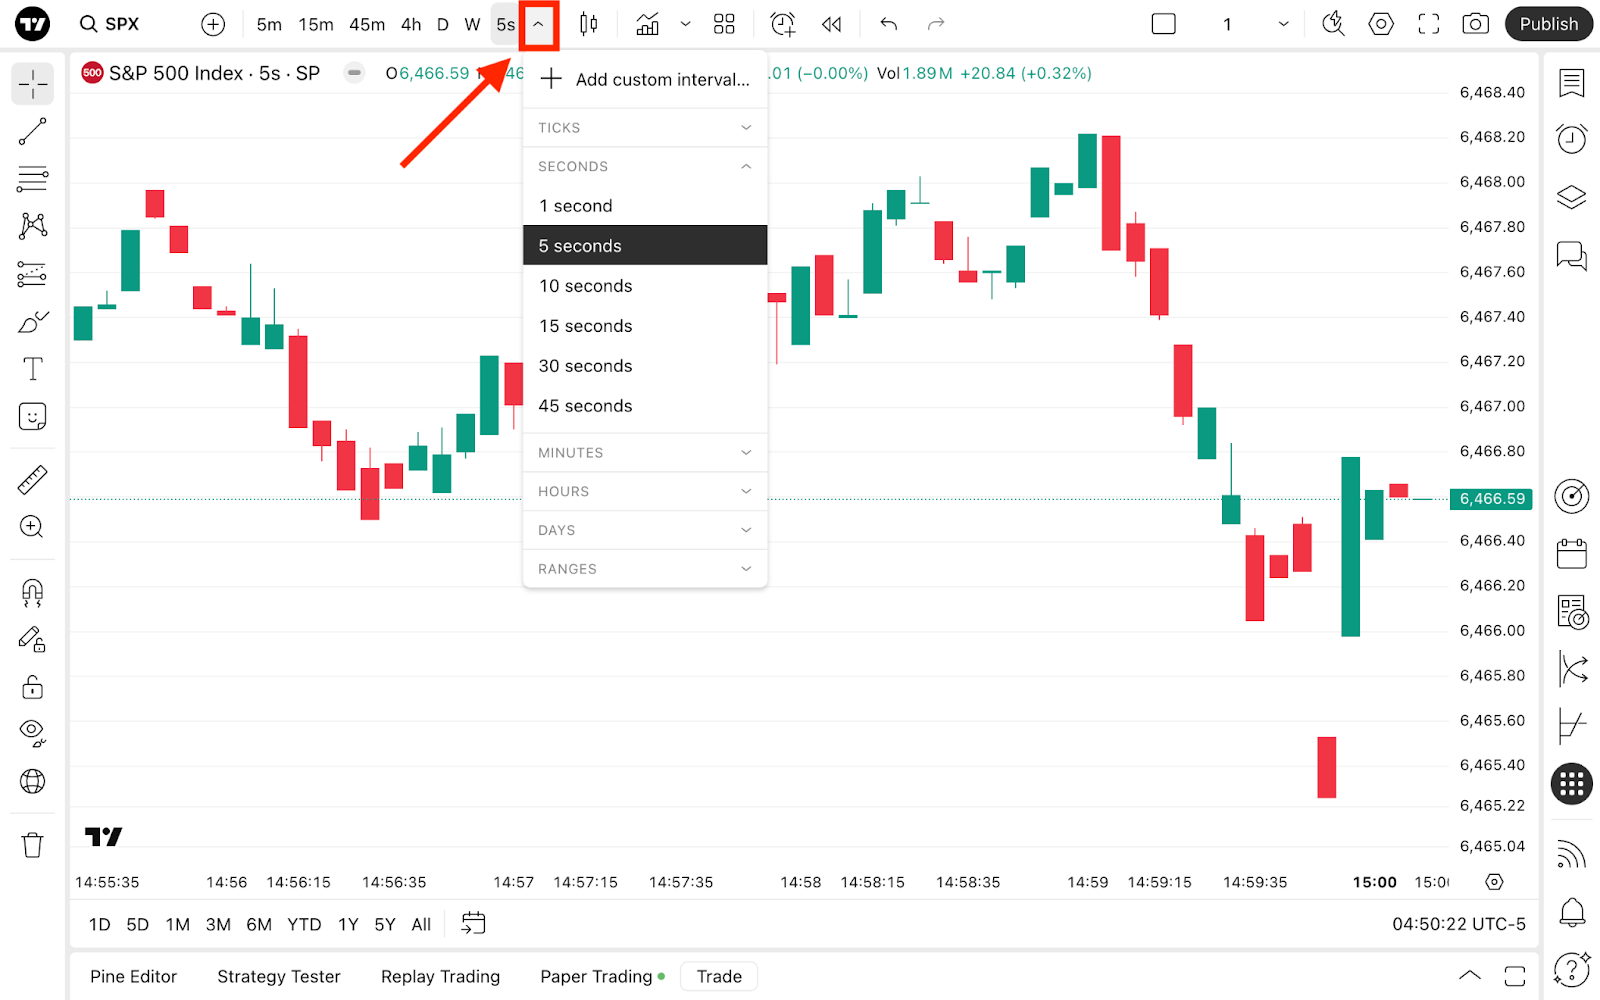
After you've chosen one of these symbols, click on "Chart interval" on the upper toolbar and select the desired interval.
Or simply start typing the number you want to set your Supercharts to. For example, 1S, 10S, etc.
Additional tools for second-based trading
If you need maximum precision for scalping or momentum trading, second-based intervals can be complemented with indicators such as Stochastic RSI, MACD, or Pivot points. Also, explore our indicator templates, create your own and share them with the global community of like-minded traders.
Additionally, you can try the Fibonacci retracement and rectangle drawing tools to identify the potential pullback and resistance/support zones.
Continue exploring our custom intervals, chart types and many other tools and pages to stay sharp with the market and be prepared for the next trading opportunity.
Also read:
- The technical analysis essentials
- Introduction to fundamental analysis
- How to trade on TradingView
- Paper Trading — main functionality
- TradingView Calendar: key economic and corporate events
Second-based intervals show price movements in very short time windows. You can configure them to see rapid price changes even within one second. They can help you see exactly when prices jump up or down during the trading day. Essential for high-frequency trading strategies and precise entry timing, you can use them on our Supercharts along with many other tools for high-frequency trading.
CONTENTS:
- What are second-based intervals
- Second-based intervals vs tick-based intervals
- How to enable second-based intervals
- Additional tools for second-based trading
What are second-based intervals
If you're an intraday trader, seconds matter. With intervals based on seconds, you can see price action almost in real time and respond quickly. They're especially helpful during high volatility and news-driven events.
The interval is displayed on the X (horizontal) axis of the Supercharts. After a certain amount of time passes, new elements are added. For example, if you select the hollow candle chart type and a 10-second interval, each candle will represent ten seconds of price movement regardless of how sharp or still it's been.
On TradingView, you can choose flexible intervals to match your strategy: 1, 5, 10, 15, 30, and 45 seconds.
Second-based intervals vs tick-based intervals
These two intervals are similar in that they can both present the most precise data when plotting a chart's elements. A second is the smallest amount of time, and a tick is the smallest amount of price.
The core difference between these two is that the first is a time-based interval and the second is a price-based interval. Because of that, they present you with different opportunities.
Second-based intervals
- Use time on the X (horizontal) axis of the chart
- Work with any chart type
- May clutter your chart with empty and less informative elements during periods of low trading activity or for assets with low liquidity
Tick-based intervals
- Use price for the X (horizontal) axis of the chart
- Don't work with Renko, line break, Kagi, point and figure, and range charts
- Filter out quiet periods automatically
How to enable second-based intervals
These intervals are available for the most liquid symbols, including stocks, indices, cryptocurrencies, and futures.
After you've chosen one of these symbols, click on "Chart interval" on the upper toolbar and select the desired interval.

Or simply start typing the number you want to set your Supercharts to. For example, 1S, 10S, etc.
Additional tools for second-based trading
If you need maximum precision for scalping or momentum trading, second-based intervals can be complemented with indicators such as Stochastic RSI, MACD, or Pivot points. Also, explore our indicator templates, create your own and share them with the global community of like-minded traders.
Additionally, you can try the Fibonacci retracement and rectangle drawing tools to identify the potential pullback and resistance/support zones.
Continue exploring our custom intervals, chart types and many other tools and pages to stay sharp with the market and be prepared for the next trading opportunity.
Also read:
- The technical analysis essentials
- Introduction to fundamental analysis
- How to trade on TradingView
- Paper Trading — main functionality
- TradingView Calendar: key economic and corporate events
CONTEÙDOS:
- O que são intervalos baseados em segundos
- Intervalos baseados em segundos vs. intervalos baseados em ticks
- Como habilitar intervalos baseados em segundos
- Ferramentas adicionais para negociação baseada em segundos
O que são intervalos baseados em segundos
Se você é um trader intradiário, segundos são importantes. Com intervalos baseados em segundos, você pode ver a ação do preço quase em tempo real e responder rapidamente. Eles são especialmente úteis durante eventos de alta volatilidade e eventos impulsionados por notícias.
O intervalo é exibido no eixo X (horizontal) dos Supergráficos. Após um certo período de tempo, novos elementos são adicionados. Por exemplo, se você selecionar o tipo de gráfico de vela vazia e um intervalo de 10 segundos, cada vela representará dez segundos de movimento de preço, independentemente de quão acentuada ou parada tenha sido.
No TradingView, você pode escolher intervalos flexíveis para corresponder à sua estratégia: 1, 5, 10, 15, 30 e 45 segundos.
Intervalos baseados em segundos vs intervalos baseados em ticks
Esses dois intervalos são semelhantes, pois ambos podem apresentar os dados mais precisos ao traçar os elementos de um gráfico. Um segundo representa o menor período de tempo e um tick representa o menor período de preço.
A principal diferença entre os dois é que o primeiro é um intervalo baseado em tempo e o segundo é um intervalo baseado em preço. Por isso, eles apresentam oportunidades diferentes.
Intervalos baseados em segundos
- Use o tempo no eixo X (horizontal) do gráfico
- Funciona com qualquer tipo de gráfico
- Pode sobrecarregar seu gráfico com elementos vazios e menos informativos durante períodos de baixa atividade de negociação ou para ativos com baixa liquidez
Intervalos baseados em ticks
- Use o preço para o eixo X (horizontal) do gráfico
- Não funciona com gráficos Renko, quebra de linha, Kagi, ponto e figura e gráficos de intervalo
- Filtrar períodos de baixa automaticamente
Como habilitar intervalos baseados em segundos
Esses intervalos estão disponíveis para os símbolos com mais liquidez, incluindo ações, índices, criptomoedas e futuros.
Após escolher um desses símbolos, clique em "Intervalo do gráfico" na barra de ferramentas superior e selecione o intervalo desejado.

Ou simplesmente comece a digitar o número que deseja definir para seus Supergráficos. Por exemplo, 1S, 10S, etc.
Ferramentas adicionais para negociação baseada em segundos
Se você precisa de precisão máxima para scalping ou negociação de momentum, intervalos baseados em segundos podem ser complementados com indicadores como RSI Estocástico, MACD ou pontos de Pivô. Explore também nossos templates de indicadores, crie os seus próprios e compartilhe-os com a comunidade global de traders com ideias semelhantes.
Além disso, você pode experimentar as ferramentas de retração de Fibonacci e desenho de retângulos para identificar potenciais zonas de pullback e resistência/suporte.
Continue explorando nossos intervalos personalizados, tipos de gráficos e muitas outras ferramentas e páginas para se manter atualizado com o mercado e preparado para a próxima oportunidade de negociação.
Leia também: