VWAP (Any Anchor)Hello Traders,
Introduction:
The Volume Weighted Average Price (VWAP) is a powerful trading indicator used to gauge the average price at which an asset has traded, weighted by volume, over a specific period.
One of the key factors that can significantly impact the effectiveness of VWAP is the concept of "anchoring." In this TradingView indicator script description, we'll explore the concept of anchoring and how it's integrated into a customizable VWAP indicator.
Understanding Anchoring:
Anchoring in VWAP refers to selecting a specific point in time from which the VWAP calculation begins.
This "anchor point" serves as the starting reference for VWAP, and it can substantially impact the indicator's behavior and interpretation.
Anchoring allows traders to adapt VWAP to different trading strategies and scenarios.
Here are some common anchor points used in the script and their significance:
1. Time-Based Anchors: Traders often anchor VWAP to specific times of the trading day, such as the market open (e.g., 9:30 am EST) or close (e.g., 4:00 pm EST).
You could add in the script any time-based anchor you think is relevant for your trading.
2. Event-Based Anchors: Anchoring can also be based on specific market events.
For example, some traders anchor VWAP to events like "3 Consecutive Green Candles" or "Supertrend" direction changes.
Feel free to adapt the script here and add the relevant events-based anchor for your trading.
3. Multi-Timeframe Anchoring: Traders can anchor VWAP on different timeframes, allowing them to analyze price and volume interactions across various horizons.
This flexibility is especially valuable for swing traders adapting to longer-term trends.
Anchor Selection
Traders can choose from various anchor points, including time-based, event-based, and even an "External Connector" for flexibility in adapting VWAP to specific scenarios.
The External connector is the output from another script used in this VWAP script.
Your script may have a condition being “true” whenever a signal is printed - you can use this signal as the anchor for the VWAP.
Conclusion:
Understanding anchoring in VWAP is essential for traders using this indicator effectively.
Choosing and customizing anchor points empowers traders to adapt VWAP to their specific trading styles and strategies.
Whether focused on intraday precision or analyzing longer-term trends, a customizable VWAP indicator with flexible anchoring options can be valuable to your trading toolkit.
Tailor your VWAP to your unique needs and gain deeper insights into market trends and price action.
Made with love
Dave
Média de Preço Ponderada pelo Volume (VWAP)

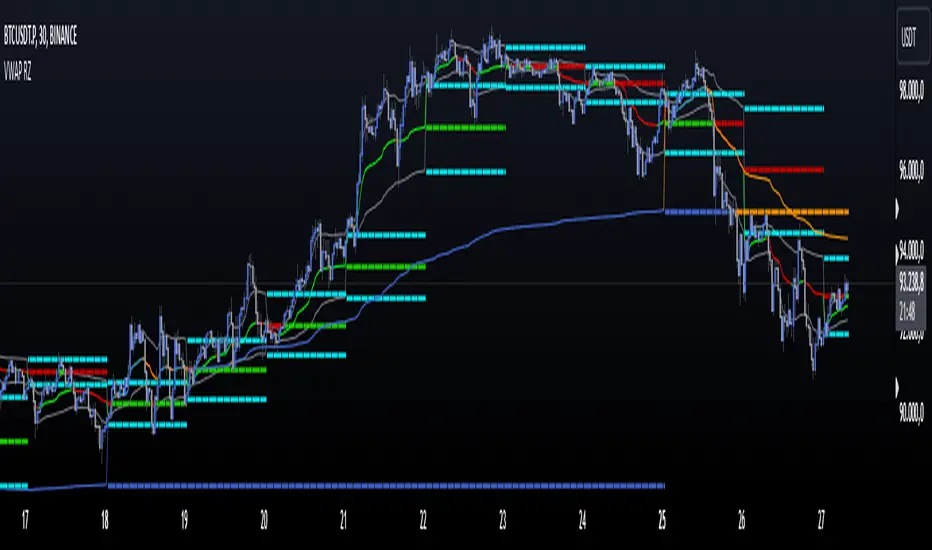
VWAP Balance ZonesVWAP Balance Zones (VBZ) Is based on 3 concepts.
Many Traders use VWAP to help determine Price Trends.
Trends are typically identified by new Highs or new Lows.
Balanced is found when Supply and Demand are mostly Equal.
VBZ tracks the daily, weekly, and monthly highs and lows; Then plots the average (50%) between the VWAP and the respective extremes.
50% VWAP Zones can be considered significant since they attempt to identify the equilibrium between market participants within the current trend, serving as key reference points to consider for decision making. >While in an uptrend, Buyers may see price falling to the Hi 50% as an attractive value entry for the continuation upwards.
>While ALSO in an uptrend, Sellers may see price falling to the Hi 50% as a change in sentiment with more downwards movement on the way.
Because of these conflicting mindsets, these zones are thought to display areas of balance between buyers and sellers, which can serve as potential decision points throughout the day.
VBZ Draws Zones from the Daily (High/Low/Close) VWAPs and the Day's (High/Low/Close) extremes as seen below.
Technically speaking, an average between vwap and extreme is a single point, to make these into zones I am using multiple sources for vwap and tracking different points of the bar throughout the day (ex. Close VWAP & Daily Highest Close)
Weekly and Monthly are only displaying the Average Price between the VWAP and the (Weekly or Monthly) High/Low.
These hold up as important levels for speculation; however, since most action will be discovered at the daily zones, I am not displaying the zones for the Weekly and Monthly to keep noise to a minimum.
Unique Behaviors:
- Weekly values are hidden on the first day of the week since they are similar to the daily values on the first day of the week.
- Monthly values are hidden in the first week of the month for the same reason.

Quantum VWAP ProThe VWAP indicator is another of our suite of volume indicators and one which was first referred to in 1988 when it appeared in an article entitled “The Total Cost Of Transactions On The NYSE” in the March edition of the Journal Of Finance from that year, which went on to explain its importance, particularly from an institutional perspective, which underpins its significance in appreciating the power and importance of this indicator.
In many ways, it is akin to the volume price analysis methodology itself, as we are merely attempting to follow the footprints in the sand left by their passage and described by volume. The same is true here, but in this case, we are following the institutions in much the same way.
Originally, the VWAP indicator was developed as a benchmark to measure whether an institutional customer received a fair execution of their order by the broker buying and selling on their behalf. The difference between the reported price and the VWAP gave the customer a benchmark against which to judge whether they had received a fair price or not. A portfolio manager for example, wants to know how the price they paid compared to the average price of the stock during the time it took to fill the order. If an order is filled at a worse price than the VWAP, it raises questions as to the ability of the broker. If the broker purchased a million shares at $40.50 and the VWAP during this time was at $40.70, the customer is likely to be happy since they paid 20 cents less than ‘fair value’. Equally, if the stock were purchased above, at, say $40.90 per share, the customer would consider this a poor trade, paying well above the fair value price at the VWAP.
The simplicity of this easy-to-understand benchmark, which creates this fair value price concept, has led to its wholehearted adoption amongst the institutions, and moreover, why algorithmic VWAP orders now dominate institutional market activity. A huge percentage of institutional orders are executed as VWAP orders, which raises two key questions. First of all, why, and second, how can we benefit from using the indicator?
If we start with the why, according to reports from the leading market makers, almost 40% of orders are now executed on this basis as they attempt to obtain a buy or sell price close to or better than the VWAP during the time it takes to complete the buy or sell order. These orders, therefore, help to hugely reinforce the importance of the VWAP since it is the guiding principle on which these orders are based. Even Warren Buffet uses VWAP, as evidenced when he sold his entire position in Southwest Airlines over two days, holding 2.3 million shares.
This highlights the key issues for any large institutional investor involving the price. If executed in a single order, an order to buy a large block of shares would almost certainly swamp the market, raising the price exponentially and, in addition, overwhelm the average volume traded in the day.
It is this issue of putting the price up against their own buying or conversely seeing the price fall as a result of their own selling that leads to the parent and child order scenario where significant block orders are broken into a multitude of smaller orders, which are duly executed over days, weeks or months. It is this aspect of institutional order execution that makes the VWAP such a potent indicator.
However, at Quantum Trading, we don’t just build a single indicator and leave it at that! We always take them to another level, and here we have done the same, bundling together a total of five indicators into one amazing value package so you can select your favorite from those on offer. The reason for this is we recognize the different ways the volume-weighted average price is used, which is why we offer a total of FIVE variants to choose from, and these are as follows:
VWAP – Volume Weighted Average Price
MVWAP – Moving Volume Weighted Average Price
AVWAP – Anchored Volume Weighted Average Price
TWAP – Time Weighted Average Price
Interday Volume Weighted Average Price
All five variants include the option to display upper and lower bands that act as envelopes above and below the VWAP based on standard deviation, which you can adjust and set yourself. These price envelopes become essential dynamic support and resistance levels, which can help predict the extremes of price action as it oscillates around the VWAP from the fastest to the slowest timeframes and everything in between.
All five indicators are packaged into one powerful indicator, which we have named the Quantum VWAP Pro indicator for obvious reasons, and as you would expect, it works in all markets and instruments, whether stocks, futures, ETFs, forex or cryptocurrencies.
Finally, as with all our indicators, we recommend you use it in multiple timeframes.

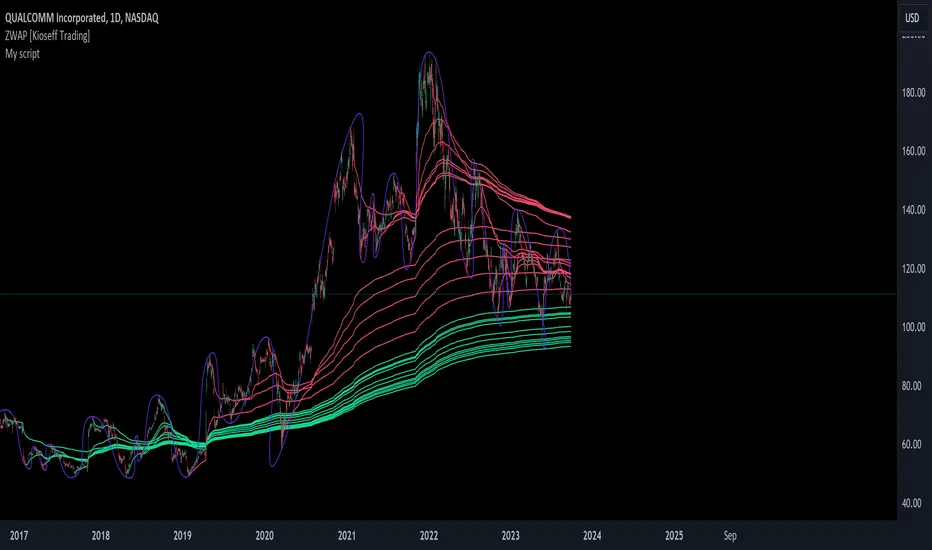
ZWAP (ZigZag Anchored VWAP) [Kioseff Trading]Hello!
Quick script showcasing the new polyline function for Pine Script!
Features
Up to 100 high/low pivot points auto anchored VWAP
Visible range auto anchored VWAP
Curved ZigZag (Adjustable!)
With the new polyline function, auto-anchored VWAP at specific price points is more viable.
When using line.new() only 500 lines can exist on the chart concurrently and, since VWAP is calculated on every update, a "proper" VWAP drawn using line.new() can extend 500 bars at most, to which no additional VWAP lines can be drawn after.
Of course, when using the plot() function a VWAP line will draw on every bar; however, this method isn't highly compatible with auto-anchoring VWAP lines.
However!
A polyline, from beginning to end irrespective of the number of coordinates used, constitutes 1 polyline; 100 can exist simultaneously with 10,000 xy coordinates per line.
The image above shows an attempt to draw the same auto-anchored VWAP lines using the line.new() function. Not an ideal outcome!
The image above shows the same attempt using the polyline.new() function!
Very nice (:
The image above shows the indicator auto anchoring to zig zag turning points.
Subsequent to a new anchoring, VWAP is calculated for the following bars - up to the current bar.
Thank you for checking this out; if you have any ideas to spice it up feel free to comment!
Crypto Spot/Futures Dominance Indicator with AlertsFutures/Spot Dominance Indicator:
Overview:
The futures/spot dominance indicator is a versatile tool used by traders and analysts to assess the relative strength or dominance of the futures market in relation to the spot (or cash) market for a specific asset. It offers insights into market sentiment, potential arbitrage opportunities, and risk management while incorporating the VWAP indicator for added context.
How It Works:
This indicator automatically detects and adapts to the futures symbol applied to the chart, simplifying the setup for traders. However, it still necessitates manual input of the corresponding spot pair to ensure accuracy.
Automatic Futures Symbol Detection: The indicator starts by automatically detecting the futures symbol on the trading chart, eliminating the need for manual configuration. This ensures that the indicator is applied to the correct futures contract.
Manual Spot Pair Entry: To provide a reliable reference point for the comparison, traders must manually input the corresponding spot symbol via the indicator's inputs. For instance, if the indicator detects the BTCUSDT.P futures symbol, traders would manually enter the BTCUSDT spot symbol.
Gathering Data: The indicator collects historical price data for both the detected futures contract and the manually specified spot symbol. This data includes open, high, low, and close prices, as well as trading volume.
VWAP Calculation: To gain a deeper understanding of price trends and market dynamics, the indicator calculates the VWAP (Volume Weighted Average Price) for both the futures and spot markets. The VWAP places more weight on prices with higher trading volume, offering a weighted average that reflects market consensus.
Premium/Discount Calculation: By subtracting the VWAP of the spot market from the VWAP of the futures market, the indicator quantifies the premium or discount of the futures price concerning the spot price. A positive value indicates a premium, while a negative value suggests a discount.
Plotting: The premium/discount value is displayed as a line on the chart, often alongside moving averages or other smoothing techniques for improved trend analysis.
Alerts: In addition to its analysis capabilities, this indicator now includes alerts to enhance your trading experience. It alerts you in the following scenarios:
Premium Above Average: Notifies you when the premium crosses above the average line.
Premium Below Average: Alerts you when the premium crosses below the average line.
Premium Above Zero: Provides an alert when the premium crosses above the zero line.
Premium Below Zero: Generates an alert when the premium crosses below the zero line.
Benefits of the Futures/Spot Dominance Indicator:
Sentiment Analysis: Traders use the indicator to assess market sentiment. A futures premium might signify bullish sentiment, while a discount could indicate bearish sentiment.
Arbitrage Opportunities: Identifying price discrepancies between futures and spot markets can help traders spot arbitrage opportunities, where they can profit from price differentials.
Risk Management: The indicator assists in evaluating risks associated with futures positions, helping traders manage their exposure effectively.
Trend Confirmation: When used in conjunction with other technical indicators, futures/spot dominance, along with VWAP, can provide additional confirmation of price trends.
Hedging: Investors and corporations use this tool to gauge the effectiveness of hedging strategies based on futures contracts.
Speculative Trading: Traders and investors use the indicator to inform speculative positions, aligning their trades with perceived market strength or weakness.
Insightful Analysis: Futures/spot dominance analysis, enriched by VWAP data, offers insights into market behavior during specific events or changes in economic conditions.
In summary, the futures/spot dominance indicator, with its integration of VWAP and automatic futures symbol detection, provides traders and investors with a comprehensive tool to assess market dynamics. It aids in sentiment analysis, risk management, and trend confirmation while offering potential arbitrage opportunities. The newly added alerts enhance the indicator's functionality, providing timely notifications of key market events. However, it relies on manual input of the corresponding spot pair to ensure precise comparisons between futures and spot markets. It should be used alongside other analysis techniques for a well-rounded view of the market.

VWAP with CharacterizationThis indicator is a visual representation of the VWAP (Volume Weighted Average Price), it calculates the weighted average price based on trading volume. Essentially, it provides a measure of the average price at which an asset has traded during a given period, but with a particular focus on trading volume. In our case, the indicator calculates the VWAP for the current trading symbol, using a predefined simple moving average (SMA) with a period of 14. This volume-weighted moving average offers a clearer view of the behavior of the VWAP and, of consequence of market dynamics.
One of the distinctive features of this indicator is its ability to provide a more "linear" representation of the data. This means that the data is "smoothed" to remove noise, allowing you to more easily identify the direction of the market trend. This smoother representation is especially useful because the financial market can be subject to significant fluctuations and volatility, and this indicator can help get a more stable view of the trend.
The indicator also offers a visualization of the market trend in a very intuitive way. Using an evaluation of the highs and lows of the last 10 days, determine whether the market is in an uptrend, downtrend, or no trend at all. To make this evaluation even clearer and more immediate, the indicator line is colored dynamically. When the trend is bullish, the line is blue, while in case of a bearish trend, it takes on a distinctive color, such as pink. If the trend is not defined, the line will be colored differently, for example light yellow. This coloration gives traders an immediate visual indication of the prevailing trend, allowing them to make more informed decisions regarding trading operations.
One potential strategy involves watching candles when they cross the VWAP line strongly. If, for example, a candlestick breaks above the VWAP line, we may look for retest areas near key support levels to gauge a potential long entry. In other words, we would consider that the price may have the potential to rise further after breaking above the VWAP line, and we would look to enter a long position to take advantage of this opportunity.
On the other hand, if a candlestick crosses below the VWAP line, we might consider looking for retest areas near the VWAP line itself, which now serves as potential resistance. This could indicate a possible short entry opportunity, as the price may struggle to break above the resistance represented by the VWAP line after breaking it down. In this case, we would look to take advantage of the expected continuation of the downtrend.
In both cases, the idea is to exploit significant movements across the VWAP line as signals of potential reversal or continuation of the trend. This strategy can help identify key entry points based on price behavior relative to the VWAP line.

SOFEX Strong Volatility Trend Follower + BacktestingWhat is the SOFEX Strong Volatility Trend Follower + Backtesting script?
🔬 Trading Philosophy
This script is trend-following, attempting to avoid choppy markets.
It has been developed for Bitcoin and Ethereum trading, on 1H timeframe.
The strategy does not aim to make a lot of trades, or to always remain in a position and switch from long to short. Many times there is no direction and the market is in "random walk mode", and chasing trades is futile.
Expectations of performance should be realistic.
The script focuses on a balanced take-profit to stop-loss ratio. In the default set-up of the script, that is a 2% : 2% (1:1) ratio. A relatively low stop loss and take profit build onto the idea that positions should be exited promptly. There are many options to edit these values, including enabling trailing take profit and stop loss. Traders can also completely turn off TP and SL levels, and rely on opposing signals to exit and enter new trades.
Extreme scenarios can happen on the cryptocurrency markets, and disabling stop-loss levels completely is not recommended. The position size should be monitored since all of it is at risk with no stop-loss.
⚙️ Logic of the indicator
The Strong Volatility Trend Follower indicator aims at evading ranging market conditions. It does not seek to chase volatile, yet choppy markets. It aims at aggressively following confirmed trends. The indicator works best during strong, volatile trends, however, it has the downside of entering trades at trend tops or bottoms.
This indicator also leverages proprietary adaptive moving averages to identify and follow strong trend volatility effectively. Furthermore, it uses the Average Directional Index, Awesome Oscillator, ATR and a modified version of VWAP, to categorize trends into weak or strong ones. The VWAP indicator is used to identify the monetary (volume) inflow into a given trend, further helping to avoid short-term manipulations. It also helps to distinguish choppy-market volatility with a trending market one.
📟 Parameters Menu
The script has a comprehensive parameter menu:
Preset Selection : Choose between Bitcoin or Ethereum presets to tailor the indicator to your preferred cryptocurrency market.
Indicator Sensitivity Parameter : Adjust the sensitivity to adapt the indicator, particularly to make it seek higher-strength trends.
Indicator Signal Direction : Set the signal direction as Long, Short, or Both, depending on your preference.
Exit of Signals : You have options regarding Take-Profit (TP) and Stop-Loss (SL) levels. Enable TP/SL levels to exit trades at predetermined levels, or disable them to rely on direction changes for exits. Be aware that removing stop losses can introduce additional risk, and position sizing should be carefully monitored.
By enabling Trailing TP/SL, the system switches to a trailing approach, allowing you to:
- Place an initial customizable SL.
- Specify a level (%) for the Trailing SL to become active.
- When the activation level is reached, the system moves the trailing stop by a given Offset (%).
Additionally, you can enable exit at break-even, where the system places an exit order when the trail activation level is reached, accounting for fees and slippage.
Alert Messages : Define the fields for alert messages based on specific conditions. You can set up alerts to receive email, SMS, and in-app notifications. If you use webhooks for alerts, exercise caution, as these alerts can potentially execute trades without human supervision.
Backtesting : Default backtesting parameters are set to provide realistic backtesting performance:
- 0.04% Commission per trade (for both entries and exits)
- 3 ticks Slippage (highly dependent on exchange)
- Initial capital of $1000
- Order size of $1000
While the order size is equal to the initial capital, the script employs a 2% stop-loss order to limit losses and attempts to prevent risky trades from creating big losses. The order size is a set dollar value, so that the backtesting performance is linear, instead of using % of capital which may result in unrealistic backtesting performance.
Risk Disclaimer
Please be aware that backtesting results, while valuable for statistical overview, do not guarantee future performance in any way. Cryptocurrency markets are inherently volatile and risky. Always trade responsibly and do not risk more than you can afford to lose.

Kviatek - Multi Hour VWAPThis is an experimental script, that plots 24 VWAPs, each starting at a new hour and lasting for 24hours.
After using session anchored VWAPs i kept wondering if the price reacts to VWAPs that begin at periods lower than sessions.
Color of each VWAP changes upon crossovers of the following VWAP, giving us an understanding of trends and whether we're trading with the trend or against it.
By the nature of the script I recommend using it on low timeframes, 5 and 15-minute ones ideally.

Kviatek - Multi Day VWAPThis indicator plots VWAPs anchored to each day of the week.
VWAPs are considered "fair price" for both sellers and buyers and it's often times where the liquidity is found.
From my trading I noticed how often times price likes to come back to the daily VWAP from the previous week, especially at the beginning and end of each week.
For example, if we enter a long on Friday, last Friday's VWAP tends to act as a target for the price.
Another use for it is to get an understanding of how the trend develops throughout the week.
If the following day's VWAP is above the previous day's VWAP - we have a trend continuation.
SOFEX High-End Indicators + BacktestingBINANCE:BTCUSDT.P BINANCE:ETHUSDT.P
Introducing the first publicly available suite of indicators for Bitcoin and Ethereum by Sofex - the High-End Indicators & Backtesting System.
🔬 Trading Philosophy
The High-End Indicators & Backtesting system offers both trend-following and mean-reversal algorithms to provide traders with a deep insight into the highly volatile cryptocurrency markets, known for their market noise and vulnerability to manipulation.
With these factors in mind, our indicators are designed to sidestep most potentially false signals. This is facilitated further by the "middle-ground" time frame (1 Hour) we use. Our focus is on the two largest cryptocurrencies: Bitcoin and Ethereum , which provide high liquidity, necessary for reliable trading.
Therefore, we recommend using our suite on these markets.
The backtesting version of the Sofex High-End Indicators includes mainly trend-following indicators. This is because our trading vision is that volatility in cryptocurrency markets is a tool that should be used carefully, and many times avoided. Furthermore, mean-reversal trading can lead to short-term profits, but we have found it less than ideal for long-term trading.
The script does not aim to make a lot of trades, or to always remain in a position and switch from long to short. Many times there is no direction and the market is in "random walk mode", and chasing trades is futile.
Based on our experience, it is preferable if traders remain neutral the majority of the time and only enter trades that can be exited in the foreseeable future. Trading just for the sake of it ultimately leads to loss in the long-run.
Expectations of performance should be realistic.
We also focus on a balanced take-profit to stop-loss ratio. In the default set-up of the script, that is a 2% : 2% (1:1) ratio. A relatively low stop loss and take profit build onto our idea that positions should be exited promptly. There are many options to edit these values, including enabling trailing take profit and stop loss. Traders can also completely turn off TP and SL levels, and rely on opposing signals to exit and enter new trades.
Extreme scenarios can happen on the cryptocurrency markets, and disabling stop-loss levels completely is not recommended. The position size should be monitored since all of it is at risk with no stop-loss.
We take pride in presenting this comprehensive suite of trading indicators, designed for both manual and automated use. Although automated use leads to increased efficiency, traders are free to incorporate any of our indicators into their own manual trading strategy.
⚙️ Indicators
By default, all indicators are enabled for both Long and Short trades.
Extreme Trend Breakouts
The Extreme Trend Breakouts indicator seeks to follow breakouts of support and resistance levels, while also accounting for the unfortunate fact that false signals can be generated on these levels. The indicator combines trend-breakout strategies with various other volatility and direction measurements. It works best in the beginning of trends.
Underpinning this indicator are renowned Perry Kaufman's Adaptive Moving Averages (PKAMA) alongside our proprietary adaptive moving averages. These dynamic indicators adjust their parameters based on recent price movements, attempting to catch trends while maintaining consistent performance in the long run.
In addition, our modification of the TTM Squeeze indicator further enhances the Extreme Trend Breakouts indicator, making it more responsive, especially during the initial stages of trends and filtering of "flat" markets.
High-Volatility Trend Follower
The High-Volatility Trend Follower indicator is based around the logic of evading market conditions where volatility is low (choppy markets) and aggressively following confirmed trends. The indicator works best during strong trends, however, it has the downside of entering trades at trend tops or bottoms.
This indicator also leverages our proprietary adaptive moving averages to identify and follow high-volatility trends effectively. Furthermore, it uses the Average Directional Index, Aroon Oscillator, ATR and a modified version of VWAP, to categorize trends into weak or strong ones. The VWAP indicator is used to identify the monetary (volume) inflow into a given trend, further helping to avoid short-term manipulations.
Low-Volatility Reversal
The Low-Volatility Reversal aims at plugging the holes that trend-following indicators ignore. It specifically looks for choppy markets. Using proven concepts such as Relative Strength Index and volume measurements, among others, this indicator finds local tops and bottoms with good accuracy. It works best in choppy markets with low to medium volatility. It has a downside that all reversals have, losing trades at the end of choppy markets and in the beginning of big trends.
This indicator, like the others, employs PKAMA in conjunction with our proprietary adaptive moving averages, and an Average PSAR indicator to seek out "sideways" markets. Furthermore, Bollinger Bands with an adaptive basis line is used, with the idea of trading against the short-term trends by looking at big deviations in price movement. The above mentioned indicators attempt to catch local tops and bottoms in markets.
Adaptive Trend Convergence
The Adaptive Trend Convergence aims at following trends while avoiding entering positions at local bottoms and tops. It does so by comparing a number of adaptive moving averages and looking for convergence among them. Adaptive filtering techniques for avoiding choppy markets are also used.
This indicator utilizes our proprietary adaptive moving averages, and an Average Price Range indicator to identify trend convergence and divergence effectively, preventing false signals during volatile market phases. It also makes use of Bollinger Bands with an adaptive moving average basis line and price-action adjusted deviation. Contrasting to the Low-Volatility Reversal condition described above, the Bollinger Bands used here attempt to follow breakouts outside of the lower and upper bands.
Double-Filtered Channel Breakouts
The Double-Filtered Channel Breakouts indicator is made out of adaptive channel-identifying indicators. The indicator then follows trends that significantly diverge from the established channels. This aims at following extreme trends, where rapid, continuous movements in either direction occur. This indicator works best in very strong trends and follows them relentlessly. However, these strong trends can end in strong reversals, and the indicator can be stopped out on the last trade.
Our Double-Filtered Channel Breakouts indicator is built on a foundation of adaptive channel indicators. We've harnessed the power of Keltner Channels and Bollinger Band Channels, with a similar approach used in the Adaptive Trend Convergence indicator. The basis and upper/lower bands of the channels do not rely on fixed deviation parameters, rather on adaptive ones, based on price action and volatility. This combination seeks to identify and follows extreme trends.
Direction Tracker
The Direction Tracker indicator is made out of a central slower, adaptive moving average that clearly recognizes global, long-term trends. Combined with direction and range indicators, among others, this indicator excels at finding the long-term trend and ignoring temporary pullbacks in the opposite direction. It works best at the beginning and middle of long and strong trends. It can fail at the end of trends and on very strong historical resistance lines (where sharp reversals are common).
Our Direction Tracker indicator integrates an adaptive SuperTrend indicator into its core, alongside our proprietary adaptive moving averages, to accurately identify and track long-term trends while mitigating temporary pullbacks. Furthermore, it uses Average True Range, ADX and other volatility indicators to attempt to catch unusual moves on the market early-on.
📟 Parameters Menu
To offer traders flexibility, our system comes with a comprehensive parameter menu:
Preset Selection : Choose between Bitcoin or Ethereum presets to tailor the indicators to your preferred cryptocurrency market.
Global Signal Direction: Set the global signal direction as Long, Short, or Both, depending on your trading strategy.
Global Sensitivity Parameter : Adjust the system's sensitivity to adapt to different trend-following conditions, particularly beneficial during higher-strength trends.
Source of Signals : Toggle individual indicators on or off according to your preference. By default, all indicators are enabled. Customize the indicators to trade Long, Short, or Both, aligning them with your desired market exposure.
Confirmation of Signals : Set the minimum number of confirmed signals on the same bar, ensuring signals are generated only when specific confirmation criteria are met. The default value is one, and it can be adjusted for both Long and Short signals.
Exit of Signals : You have options regarding Take-Profit (TP) and Stop-Loss (SL) levels. Enable TP/SL levels to exit trades at predetermined levels, or disable them to rely on direction changes for exits. Be aware that removing stop losses can introduce additional risk, and position sizing should be carefully monitored.
By enabling Trailing TP/SL, the system switches to a trailing approach, allowing you to:
- Place an initial customizable SL.
- Specify a level (%) for the Trailing SL to become active.
- When the activation level is reached, the system moves the trailing stop by a given Offset (%).
Additionally, you can enable exit at break-even, where the system places an exit order when the trail activation level is reached, accounting for fees and slippage.
Alert Messages : Define the fields for alert messages based on specific conditions. You can set up alerts to receive email, SMS, and in-app notifications. If you use webhooks for alerts, exercise caution, as these alerts can potentially execute trades without human supervision.
Backtesting : Default backtesting parameters are set to provide realistic backtesting performance:
- 0.04% Commission per trade (for both entries and exits)
- 3 ticks Slippage (highly dependent on exchange)
- Initial capital of $1000
- Order size of $1000
While the order size is equal to the initial capital, the script employs a 2% stop-loss order to limit losses and attempts to prevent risky trades from creating big losses. The order size is a set dollar value, so that the backtesting performance is linear, instead of using % of capital which may result in unrealistic backtesting performance.
Risk Disclaimer
Please be aware that backtesting results, while valuable for statistical overview, do not guarantee future performance in any way. Cryptocurrency markets are inherently volatile and risky. Always trade responsibly and do not risk more than you can afford to lose.

VWAP Divergence | Flux ChartsThe VWAP Divergence indicator aims to find divergences between price action and the VWAP indicator. It uses filters to filter out many of the false divergences and alert high quality, accurate signals.
Red dots above the candle represent bearish divergences, while green dots below the candle represent bullish divergences.
The main filter for divergences focuses on ATR and the price movement in the past candles up to the lookback period. Divergences are determined when a price movement over the lookback period is sharp enough to be greater/less than the ATR multiplier multiplied by the ATR.
Settings
Under "Divergence Settings", both the lookback period and ATR multiplier can be adjusted.
Due to the nature of the calculations, the ATR multiplier and the lookback period should be set lower on higher time frames. As price movements become more averaged, for example on the 15 minute chart, sharp price movements happen less frequently and are often contained in fewer candles as they happen on lower time frames. Less volatile stocks such as KO, CL, or BAC should also use lower ATR multipliers and lower lookback periods.
Under "Visual Settings", you can change the color of the VWAP line, show alternating VWAP colors, adjust divergence signal size, and show the VWAP line.

TTP VWAP BandThis indicator offers 20 VWAP bands and on-chart statistic data about the bands.
Features
- Longs and shorts
- Cherry-pick up to 5 bands for backtesting
- Plots 20 bands
- Step scale to increase deviation percentage on each band
- Period and timeframe selectors
- Band crosses: how many times a band was crossed (also percentage)
- Band bounces: how many times each band was pinched and bounced back (also percentage)
How to use:
1) Set the chart to 15 or 5 minute timeframe for higher backtesting accuracy
2) Select the first band deviation % (MIN Long VWAP % and MIN Short VWAP %), use a small number like 0.3 or 1.0 since the rest of the 20 bands will increase that amount later.
3) Select a step scale or leave it in 1 if you prefer same distance between all bands. Notice that if you use a value below 1 the bands will get closer to each other.
4) Observe the statistics and pay attention to how many times each of the bands are being crossed in percentage. This will later help you make decisions on when to enter and where to potentially put an SL.
Connect with your preferred backtester:
You can backtest a single or multiple bands at once. For example you could use the 7th band to enter a base order and later use crosses of the 4th band to enter safety orders. Any combination is possible!
Let's assume you decide that you will be backtesting only 1 band at the time as your single entry condition for your backtester.
Let's also assume that you want to use the 2nd band for long entries then do follow these steps:
- Set "Band 1 backtesting" to 2 so that it prints 1 every time the price crosses below the 2nd band.
- Leave the other Band backtesting band settings with a 0 so they stay disabled
- Add your backtester to the same chart and select "band 1 long signal"
- This signal will contain 1 every time your conditions are met

Colored VWAP and BarcolorThis indicator plots the Volume Weighted Average Price (VWAP) as well as changes the bar color if the current price is above or below VWAP, for quick visual reference.
Background Information
Straight from TradingView, "Volume Weighted Average Price (VWAP) is a technical analysis tool used to measure the average price weighted by volume. VWAP is typically used with intraday charts as a way to determine the general direction of intraday prices. It's similar to a moving average in that when price is above VWAP, prices are rising and when price is below VWAP, prices are falling. VWAP is primarily used by technical analysts to identify market trend."
About the Indicator
This indicator changes the VWAP line color and bar color based on the current price.
Bar Color
Bullish Up Candle Color = Current price is above VWAP and the close of the candle was greater than the open.
Bullish Down Candle Color = Current price is above VWAP and the close of the candle was less than the open.
Bearish Up Candle Color = Current price is below VWAP and the close of the candle was greater than the open.
Bearish Down Candle Color = Current price is below VWAP and the close of the candle was less than the open.

Intraday Direction Finder For Indices (Based On VWAP) Happy Independence Day..!!
------------------------------------------------------------------------
This indicator is based on the concept shared by "learntotrade365" to Find Intraday Direction for Index.
To decide the direction of Index we check whether the constituent Stocks are trading above VWAP or below VWAP.
Lets Consider Banknifty Example.
Banknifty Constituents are:
HDFC Bank
ICICI Bank
KOTAK Bank
SBI
AXIS Bank
IndusInd Bank
Based on concept, where above stocks are trading decides the direction as follows
Ratio Concept (Color)
6:0 Super Bullish (Lime)
5:1 Bullish(Green)
4:2 Mild Bullish (Aqua)
3:3 Sideways(Blue)
2:4 Mild Bearish ( Orange)
1:5 Bearish (Fuchsia)
0:6 Super Bearish (Red)
-------------------------------------------------------------------------
Features :-
1) Screener
In this Screener, we can clearly see which stock is trading above VWAP
& which is trading below VWAP along with ratio.
2) Chart Candle Colors
One can able to project candle colors according to Ratio colors.
3)Chart Background Color
One can set background color of chart if he is required.
------------------------------------------------------------------------
Same this can be used with other indices also like Nifty, Finnifty etc.
-------------------------------------------------------------------------
Thanks For Reading Till here...!!
------------------------------------------------------------------------
Kindly share your feedback or any suggestions.
------------------------------------------------------------------------

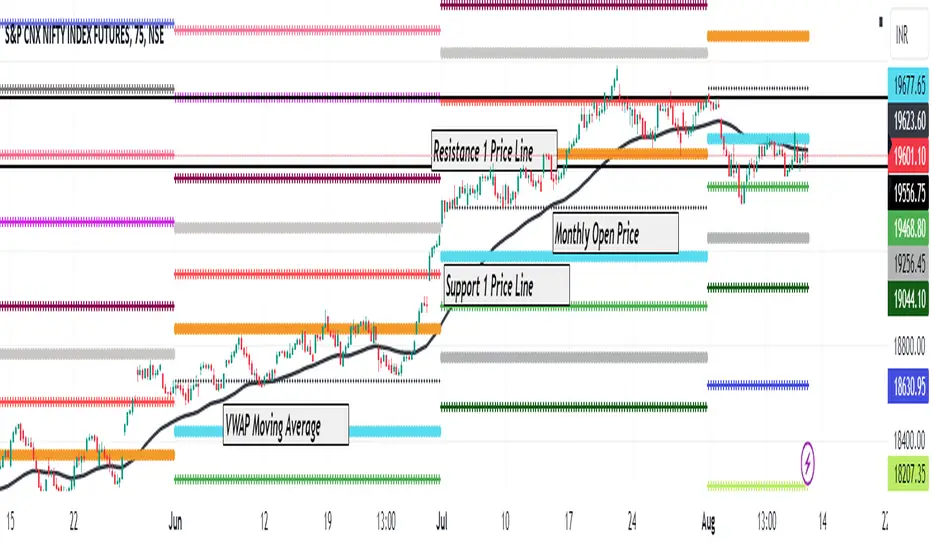
ODSR - Open Driven Support and Resistance LevelsODSR is a support and resistance levels generator indicator which uses Open of the Day, Week or Month (basis time frame selection by user) to calculate support and resistance levels and plot it on chart.
Background:
I have been using various indicators which could generate support and resistance levels using different data points available on chart. After analyzing multiple indicators I felt there is a need of an indicator which uses Open of the day, week or month as base data and then do further calculations and generate support and resistance levels.
Logic
This indicator takes open of day, week or month candle and then compare how far was the high and low from open. It then calculate the range and add it for analysis, it does same for all the candles declared in look back period of the indicator. Once it have all the data it calculates average difference of high and low from open price. It then compare how many times that average range has been exceeded by high or low made on specific day. If high or low has exceeded the average range it then calculate how by how many point new high or low has exceeded the average range. It then use that difference to predict next level of Support and Resistance. It then check if high or low has still exceeded the support or resistance range indicator predicted using points difference it found from when price exceeded initial average range. Indicator repeat the process till 7 levels of support and resistance has been generated by indicator.
Usage
As indicator use Open price data to generate support and resistance levels therefore once it has open price of the Day, Week or Month candle it will plot the levels on charts. Open price is plotted in thin black dot line, anything above it would be considered as resistance levels. Anything below dotted line would be considered as support levels. The far the level from open less possibility it will be tested by the price. Therefore if price breaks one level it may try to test next level or can return back to Open price as well.
Along with support and resistance indicator also calculate VWAP moving average which smoothen the normal VWAP line and allow use to identify long term trend on chart. Points table display the average difference between levels price has exceeded in past.
Please do share comments, feedback or questions if you have any. If you liked the indictor please do share it with others too.
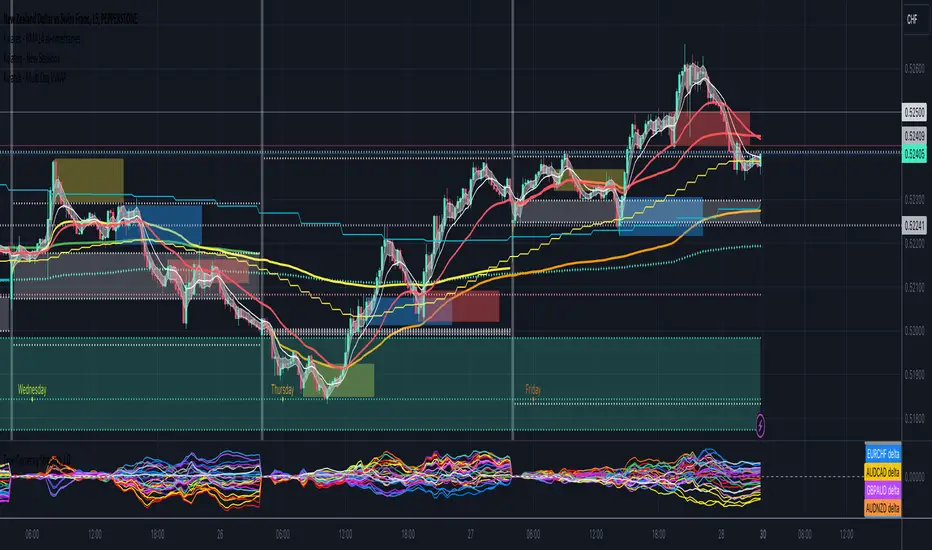
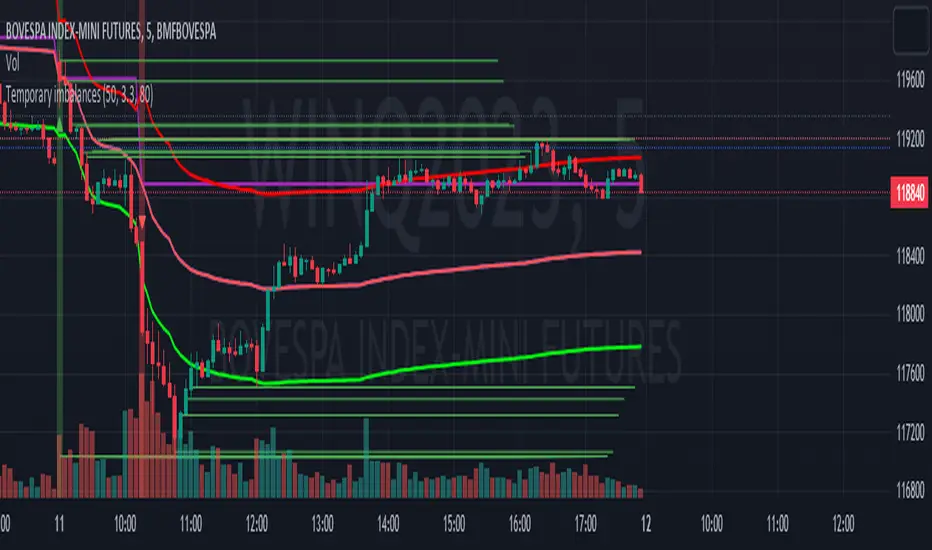
Temporary imbalancesThis indicator is designed to identify imbalances in order flow and market liquidity, It highlights candles with significant imbalances and draws reference lines
The indicator calculates imbalance based on changes in closing prices and volume. It uses the standard deviation to determine the significant imbalance threshold. Candles with bullish imbalances are highlighted in green, while candles with bearish imbalances are highlighted in red.
Furthermore, the indicator includes features of latency arbitrage and liquidity analysis. Latency arbitrage looks for price differences between the anchored VWAP and bid/ask quotes, targeting trading opportunities based on these differences. The liquidity analysis verifies the liquidity imbalance and calculates the VWAP anchored on this value in total using 4 VWAP.
This indicator can be adjusted according to the preferences and characteristics of the specific asset or market. It provides clear visual information and can be used as a complementary tool for technical analysis in trading strategies.
Interesting Segment Length 20,50,80,200
and Interesting lookback period 20,50,80,200
Interesting imbalance threshold 1.5, 2.4, 3.3 ,4.2
Este indicador é projetado para identificar desequilíbrios no fluxo de ordens e na liquidez do mercado, Ele destaca velas com desequilíbrios significativos e traça linhas de referência
O indicador calcula o desequilíbrio com base nas mudanças nos preços de fechamento e no volume. Ele usa o desvio padrão para determinar o limiar de desequilíbrio significativo. As velas com desequilíbrios de alta são destacadas em verde, enquanto as velas com desequilíbrios de baixa são destacadas em vermelho.
Além disso, o indicador inclui recursos de arbitragem de latência e análise de liquidez. A arbitragem de latência procura diferenças de preços entre a VWAP ancorada e as cotações de compra/venda, visando oportunidades de negociação com base nessas diferenças. A análise de liquidez verifica o desequilíbrio de liquidez e calcula a VWAP ancorada nesse valor ao total utiliza 4 VWAP.
Este indicador pode ser ajustado de acordo com as preferências e características do ativo ou mercado específico. Ele fornece informações visuais claras e pode ser usado como uma ferramenta complementar para análise técnica em estratégias de negociação.
Comprimento do Segmento interessante para usa 20,50,80,200
e Período de lookback interessante para usa 20,50,80,200
Limiar de desequilíbrio interessante para usa 1.5 ,2.4, 3.3 ,4.2
Fixed Range Anchored VWAPFixed Range Anchored VWAP
Description:
This indicator expands upon the popular Anchored VWAP concept by introducing user-defined start and end dates, allowing traders to select and analyze specific zones of interest. The VWAP is a widely recognized benchmark utilized by traders to assess the average price paid for a security, factoring in both volume and price. By incorporating volume data, the VWAP offers a comprehensive view of market sentiment and provides significant insights into intraday price action.
The Fixed Range Anchored VWAP takes the VWAP concept a step further by enabling traders to define a custom start and end date. This feature allows them to zoom in on specific periods of interest, such as earnings announcements, major news events, or significant price swings. By narrowing the focus to a specific time range, traders can gain a more detailed understanding of how the VWAP interacts with price movements within that specific zone.
How to Use:
1. Set the Start and End Dates: Define the desired start and end dates for the analysis period.
2. Analyze Price Movements: Observe how the VWAP interacts with price action within the defined range.

Premium VWAP Trendfollow Strategy [wbburgin]This is a strongly-revised version of my VWAP Trendfollow Strategy, which follows a substantial reworking to address various structural inefficiencies with the script, such as the narrowing of the standard deviation band upon anchor reset. I will continue updating the original script with planned adjustments, this is a different proof-of-concept that builds off of the original script thesis with a different calculation method and execution.
This strategy is not built for any specific asset or timeframe, and has been backtested on crypto and equities from 1 min-1 day. The previous experimental strategy was heavily-correlated with the actual movement of the asset, which added unpalatable risk to the strategy and increased drawdown. This revised form has a more stable backtesting curve, but I want to heavily emphasize that I cannot guarantee that the strategy will be profitable for your circumstances. Backtesting only goes so far and every exchange has a different fee schedule, which can substantially eat into your profits. At the bottom I will explain the parameters behind the strategy results.
**********
The VWAP Trendfollow Strategy begins with a simple premise: to enter long when the price breaks above the upper standard deviation of a VWAP, and to close the position when the price breaks below the lower standard deviation of the VWAP. This is more effective than initiating the same strategy for a VWMA because the VWAP resets its anchor depending on your chosen anchor period, and the act of resetting its anchor also resets its standard deviation value. As a consequence, in sustained uptrends, the standard deviation is pulled upward to meet the price when the anchor resets, instead of requiring the price to fall all the way back down, as in the lower standard deviation band of the VWMA. This essentially acts as the VWAP itself raising the stop loss at each anchor period, which works well for the overall trend-following strategy.
However, this narrowing can still have consequences for a simple breakout strategy; as the price gradually oscillates towards above or below its standard deviation band, it may cross over the other and produce false signals. This oscillation is worrisome especially when fees are taken into account.
Thus, the premium VWAP Trendfollow strategy has a variable width which detects abnormal narrowing of the band, and adjusts it until it is reasonable to close the variability period. Additionally, a filter is added to the open/close signals to soften the frequency of signals without impacting performance significantly.
This script contains an ATR stop loss and an ATR take profit (which is also a difference between it and the original experimental script), with customizable inputs. The strategy results shown below are with initial capital of $1000, qty entry of 10%, and commissions of 0.06%. It works best on 24/7 instruments, like crypto, but I have found it also works with FAANG stocks or other high volatility / high volume assets. The issue with stocks, however, is that the price can jump/plummet because of abnormal events after-hours, which the strategy cannot pick up on until pre-trading begins the next morning. For that reason I suggest it be used on crypto and, because of its low % profitable (but high average winning trade in relation to its average losing trade), be used on an exchange that has minimal fees or volume-based discounts. In the unfortunate case that you cannot find a minimal fee or volume-discounted fee exchange (such as fellow Americans following the liquidity-retreat on Binance.US), I encourage you to test out the higher anchor periods for the higher timeframes, which will reduce the number of trades and increase the average % per trade.
Additionally, this is a long-term strategy used best for accumulation. It is currently long-only; that may change based off of user input.
**********
Disclaimer
Copyright by wbburgin.
The information contained in my Scripts/Indicators/Algorithms does not constitute financial advice or a solicitation to buy or sell any securities of any type. I will not accept liability for any loss or damage, including without limitation any loss of profit, which may arise directly or indirectly from the use of or reliance on such information.
All investments involve risk, and the past performance of a security, industry, sector, market, financial product, trading strategy, backtest, or individual's trading does not guarantee future results or returns. Investors are fully responsible for any investment decisions they make. Such decisions should be based solely on an evaluation of their financial circumstances, investment objectives, risk tolerance, and liquidity needs.

Bank Nifty ScalpingThis indicator is designed for scalping purposes.
Users have the option to input the desired source and enable or disable the following indicators:
Multiple EMA (Exponential moving average)
Simultaneously displays multiple moving averages to quickly identify shifts in momentum and obtain confirmation from slower-moving averages.
By default, the EMA display settings are configured to show the 20-day EMA and the 200-day EMA. However, users have the flexibility to modify the display settings according to their preferences. This means that users can customize the indicator to show the EMA values of their choice, such as EMA 50 and EMA 100.
VWAP ( Volume weighted average price )
Default value is set to ‘hl2’
A bullish trend is indicated when the price is above the Volume Weighted Average Price (VWAP), while a bearish trend is indicated when the price is below the VWAP.
VWMA ( Volume weighted moving average )
In the VWMA (Volume Weighted Moving Average) indicator, a default value of 20 is used. If the price is higher than the VWMA, it typically indicates a bullish trend. Conversely, if the price is lower than the VWMA, it suggests a bearish trend. The VWMA takes into account both price and volume, providing a weighted average that can help identify shifts in market sentiment.
Multiple SuperTrends
Default value is 10 and 2 / 10 and 3
A bullish trend is identified when the price is above the SuperTrend indicator, whereas a bearish trend is observed when the price is below the SuperTrend indicator.
Camarilla Pivot Points (Level 3 and 4 only)
Levels 3 and 4 serve as crucial support and resistance levels, acting as the final line of defense against strong trends. These levels are expected to generate reversals, where price often changes direction.
CPR ( Central Pivot Points)
The Daily Central Pivot Point Indicator is a popular tool used in technical analysis. It calculates several levels based on the previous day's high, low, and closing prices.
Strong Volume
The user has the ability to set the average volume for Nifty and BankNifty indices to calculate strong volume.
Elder Impulse System
The Impulse System, developed by Alexander Elder and discussed in his book "New Trading for a Living," is a censorship trading system designed to determine whether a trade should be allowed or prohibited. Additionally, it can be used to identify when a trend is starting to weaken. The Impulse System relies on the following factors:
1. Slope of a Fast Exponential Moving Average (EMA): The fast EMA's slope reflects the price's inertia or momentum.
2. Slope of the Moving Average Convergence Divergence (MACD): The MACD's slope indicates the strength or power of the price movement.
Based on these factors, the Impulse System categorizes candles or price bars into three colors:
* Green Candle: When both the fast EMA and MACD are rising, indicating upward momentum.
* Red Candle: When both the fast EMA and MACD are declining, suggesting downward momentum.
* Blue Candle: In all other cases where the conditions for green or red candles are not met, representing a neutral or uncertain market condition.
By applying the Impulse System, traders can gain insights into the market trend, its strength, and potential shifts in momentum, helping them make informed trading decisions.
Happy Trading

VWAP angle TrendThe VWAP Angle Trend is an indicator built with the aim of providing valuable insights into the reversal points of the #VWAP using Angle
This is achieved by calculating the angle between the current VWAP and its previous value over a customizable lookback period and normalizing it with ATR
By analyzing the angle, we can gain an understanding of the strength and direction of the VWAP, which can help them identify potential trend reversals or continuations.
After observing the market over a lengthy period, I have come to realize that as the angle increases above 65 or decreases under -65 , it confirms a higher likelihood of a trend reversal.
the indicator highlights these zones where a trend reversal is more likely to occur.
The indicator can help you to assess the strength and direction of VWAP, enabling you to make more informed trading decisions.
By identifying periods of strong momentum or potential exhaustion, you can seek opportunities for entering or exiting positions, and potentially capitalize on trend movements in the market.

Anchored VWAP+This indicator is an enhanced version of the Anchored VWAP indicator with additional functions:
1. Anchored AP (average price). It removes the volume weighting step in Anchored VWAP, and can display the average price over a period of time. For example, if the price of the stock in the last 3 days is 100, 200, 300, then AP is their average value of 200
2. Anchored AC (average cost). The average cost over time can be displayed. For example, if the price of the stock in the last 2 days is 100,300, then AC is (1+1)/(1/100+1/300)=150
When using the indicator, you need to choose a starting point, then the indicator will start to calculate the subsequent VWAP, AP and AC from this starting point, and draw 3 lines in the graph
These three lines can be regarded as the average cost line of the market, with potential support and resistance effects
We have filled the shadow between VWAP and AP, which can be regarded as a potential support resistance band
===========================中文版本===========================
该指标为增强版本的Anchored VWAP指标。在Anchored VWAP基础上增加了额外功能:
1. Anchored AP。其去掉了Anchored VWAP中成交量加权的步骤,可以显示一段时间的平均价格。举个例子,假如股票最近3天的价格为100,200,300,那么AP为他们的平均值200
2. Anchored AC。可以显示一段时间的平均成本。举个例子,假如股票最近2天的价格为100,300,那么AC为(1+1)/(1/100+1/300)=150
使用指标时你需要先选择一个起点,随后指标将会以该起点开始计算后续的VWAP、AP和AC,并且在图中绘制3根线
这3根线均可以视作是市场的平均成本线,具有潜在的支撑和阻力效果
我们让VWAP和AP之间填充了阴影,该阴影可以视作潜在的支撑阻力带

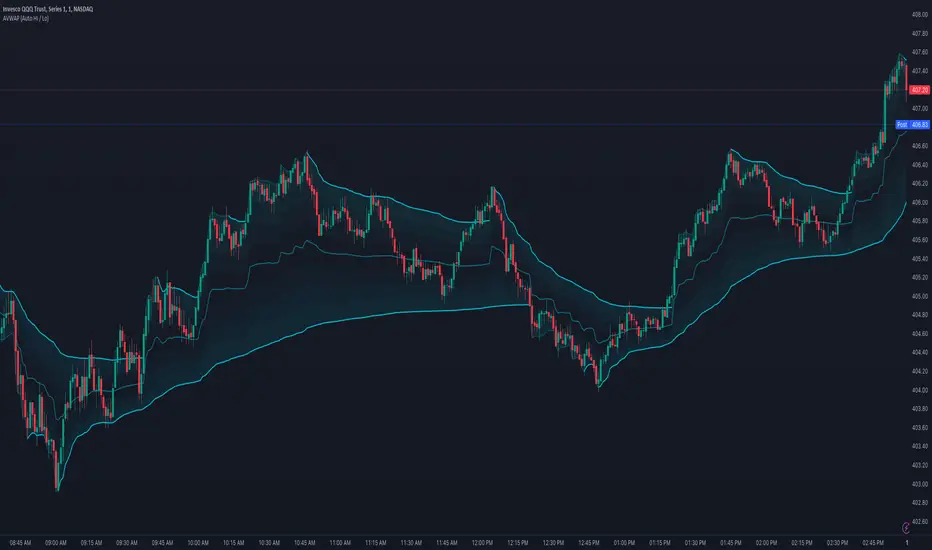
Anchored VWAP (Auto High & Low)OVERVIEW
This script plots, and auto-updates, 3 separate VWAPs: a traditional VWAP, a VWAP anchored to a trends high, and another anchored to a trends low.
VWAP and Anchored VWAPs are commonly used by institutions responsible for the majority of market volume on a given day. Citadel Trading, for example, accounts for approximately 35% of all U.S. listed retail volume , largely executed through program trades over the course of a day, week, or month.
Because VWAP is a prominent market maker tool for executing large trades, day traders can use it to better anticipate trends, mean reversion, and breakouts.
This is most useful on charts with intraday time frames (1 minute, 5 minute etc.) commonly used for day trading. This is not ideal for larger time frames (1 hour or greater) commonly used for swing trading or identifying larger trends.
INPUTS
You can configure:
The size, color, and visibility of 6 different plots (VWAP, High Anchor, Low Anchor, Average of Anchors, Quarter Values, Interim Bands)
How smooth the average displays
INSPIRATION
1. "How To Measure Anything" by Douglas W. Hubbard
2. "Maximum Trading Gains With Anchored VWAP" by Brian Shannon
Better understanding probability and how to analyze risk (first book), as well as the tools market makers use (second book), has completely reframed how I approach day trading.
VWAP Reset Zones
With this indicator, the VWAP is displayed based on two adjustable sources. Close and Open are recommended by default.
The zone between the Open and Close VWAP is carried over to the next day as the zone at the end of the period.
The zones can be considered as support and resistance zones.
The chart illustrates the idea behind it.
In addition, the anchor function has been added so that anchor points can be set for session, week and month.
Depending on the set anchor and the selected time unit of the chart, an adjustment of the indicator to the time unit can be made.
Recommended time unit of the indicator: Session = 15 min / Weekly = 1H / Month = 4H
In addition, the zones between VWAP close and vwap open have been colored.
Bullish when the close is above the open price and bearish when the close is below the open price.
The principle is simple. If the average closing price is below the average opening price, a downtrend is to be assumed and vice versa an uptrend.