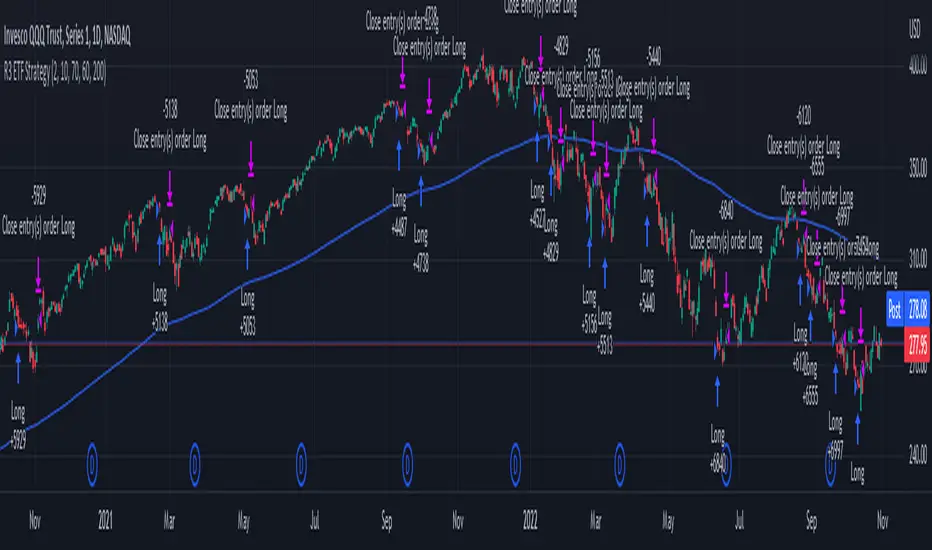
4-Hour Stochastic EMA TrendThis trading strategy relies heavily on catching the trend. You
may have success using this strategy on as low as the one hour
chart or as high as the daily chart; however, I’ve had most
success trading it on the four hour chart. This strategy consists
of four indicators, which are:
1. 5 Period Exponential Moving Average (closed)
2. 15 Period Exponential Moving Average (closed)
3. 50 Period Exponential Moving Average (closed)
4. Stochastic indicator K=13 D=5 Smooth=5 (13,5,5) 80/20
Levels
Refer
Análise de Tendência
Bear & Bull Zone Signal StrategySince I love to mix and match, here is something fresh and that actually works on the breakout of Ethereum without losing your ass on lagging indicators.
It blends some of the nice parts of my previous scripts while moving to big boy pants with a twist on the Fibonacci retracement using SMA and EMA at multiple levels to do a sanity check.
Is it too good to be true? Nope, just what happens when a Solution Architect starts messing around with crypto and applies engineering and mathematics to the mix. You get a strategy that really doesn't have high profit losses when you tweak it just the right way.
What's the right tweak you ask?
1. Start with a 30 minute timeframe and set your window start date to the date the market began the bear or bull run
2. Make sure you can see your strategy performance window (not the graph one)
3. Set Stop Loss and Target Profit to 50%
4. Use your mouse wheel or up and down arrows and mess around with the RSI, go down one at a time but no lower than 7. Whichever value displayed the highest long or short gain is the one to pick.
5. Now select long or short only based on whichever one shows the highest gain.
6. Now go to K and D, leave K as 3 and check what happens when D is 4 or 5. Leave D at the value that gives you the highest gain.
7. Now go to EMA Fast and Slow Lengths. Leave Fast at 5 and check what happens when the Slow is moved up to 11 or 12, do the gains go up. If not, check what happens when Slow is moved down to 9, 8, or 7. Whichever gives you the highest gain, leave it there. Now go mess with the fast length, keep in mind that fast must always be less than slow. So check values down to 3 and up to 6. Same concept, mo money...leave it be.
8. Now go mess with the Target Profit, I start at 5, hit enter, then go to 7, hit enter, then 9...up by 2 until I get to 21 to make sure I don't hastily pick a low one and always keep in mind between which values the gain switched from high to low. For example, in this example I published at 11 it was $5k and at 13 it was $3700 for the gains. So after I got up to 21 I went back to 11 and started going up by 0.01 steps until the value dropped, which was at 11.19 so I set it at 11.18.
9. Now stop loss is trickier, you've maximized the gains, which means if you set the stop loss at a low value you will sacrifice gains. Typically by this point your loss is less than 10% with this script. So, my approach is to find the value where the stop loss doesn't change what I've tweaked already. In this example, I did the same start at 5 and go up by 2 and saw that when I went to 17 it stopped changing. So I started going back down by 0.5 and saw at 15.5 the gains went lower again. Now I started going back up in steps of 0.01 and at 15.98 it went back to the high gain I already tweaked for. I kept stop loss there and unleashed the strategy on ETH.
So far so good, no bad trades and it's been behaving pretty well.
A Strategy for LeledecThis strategy used Leldec Script from
Then tests what would have happened if one longed or shorted on the major exhaustion.
I used 10% of the initial capital 10,000USD as an example
This is only for educational and entertainment purpose. I do not suggest anyone to use this strategy.
EMA & SupertrendStrategy has been built based on the crossover of 21 EMA (EMA 1) and 55 EMA (EMA 2). Along with with strategy, user can alter the period of EMA 1 & EMA 2 based on their suitability.
When EMA 1 crossover EMA2 or when prices closes above EMA 1 and EMA 1 is greater than EMA 2, strategy will generate Buy signal.
Position gets closed when price closes below EMA 2.
200 EMA, 233 EMA and Supertrend has been added for study purpose.
72s Strat: Backtesting Adaptive HMA+ pt.1This is a follow up to my previous publication of Adaptive HMA+ few months ago, as a mean to provide some kind of initial backtesting tools. Which can be use to explore many possible strategies, optimise its settings to better conform user's pair/tf, and hopefully able to help tweaking your general strategy.
If you haven't read the study or use the indicator, kindly go here first to get the overall idea.
The first strategy introduce in this backtest is one most basic already described in the study; buy/sell is when movement is there and everything is on the right side; When RSI has turned to other side, we can use it as exit point (if in profit of course, else just let it hit our TP/SL, why would we exit before profit). Also, base on RSI when we make entry, we can further differentiate type of signals. --Please check all comments in code directly where the signals , entries , and exits section are.
Second additional strategy to check; is when we also use second faster Adaptive HMA+ for exit. So this is like a double orders on a signal but with different exit-rule (/more on this on snapshots below). Alternatively, you can also work the code so to only use this type of exit.
There's also an additional feature which you can enable its visuals, the Distance Zone , is to help measuring price distance to our xHMA+. It's just a simple atr based envelope really, I already put the sample code in study's comment section, but better gonna update it there directly for non-coder too, after this.
In this sample I use Lot for order quantity size just because that's what I use on my broker. Also what few friends use while we forward-testing it since the study is published, so we also checked/compared each profit/loss report by real number. To use default or other unit of measurement, change the entry code accordingly.
If you change your order size, you should also change the commission in Properties Tab. My broker commission is 5 USD per order/lot, so in there with example order size 0.1 lot I put commission 0.5$ per order (I'll put 2.5$ for 0.5 lot, 10$ for 2 lot, and so on). Crypto usually has higher charge. --It is important that you should fill it base on your broker.
SETTINGS
I'm trying to keep it short. Please explore it further again. (Beginner should also first get acquaintance with terms use here.)
ORDERS:
Base Minimum Profit Before Exit:
The number is multiplier of ongoing ATR. Means that when basic exit condition is met, algo will check whether you're already in minimum profit or not, if not, let it still run to TP or SL, or until it meets subsequent exit condition, then it will check again.
Default Target Profit:
Multiplier of ATR at signal. If reached before any eligible exit condition is met, exit TP.
Base StopLoss Point:
You can change directly in code to use other like ATR Trailing SL, fix percent SL, or whatever. In the sample, 4 options provided.
Maximum StopLoss:
This is like a safety-net, that if at some point your chosen SL point from input above happens to be exceeding this maximum input that you can tolerate, then this max point is the one will be use as SL.
Activate 2nd order...:
The additional doubling of certain buy/sell with different exits as described above. If enable, you should also set pyramiding to at least: 2. If not, it does nothing.
ADAPTIVE HMA+ PERIOD
Many users already have their own settings for these. So in here I only sample the default as first presented in the study. Make it to your adaptive.
MARKET MOVEMENT
(1) Now you can check in realtime how much slope degree is best to define your specific pair/tf is out of congestion (yellow) area. And (2) also able to check directly what ATR lengths are more suitable defining your pair's volatility.
DISTANCE ZONE
Distance Multiplier. Each pair/tf has its own best distance zone (in xHMA+ perspective). The zone also determine whether a signal should appear or not. (Or what type of signal, if you wanna go more detail in constructing your strategy)
USAGE
(Provided you already have your own comfortable settings for minimum-maximum period of Adaptive HMA+. Best if you already have backtested it manually too and/or apply as an add-on to your working strategy)
1. In our experiences, first most important to define is both elements in the Market Movement Settings . These also tend to be persistent for whole season since it's kinda describing that pair/tf overall behaviour. Don't worry if you still get a low Profit Factor here, but by tweaking you should start to see positive changes in one of Max Drawdown and Net Profit, or Percent Profitable.
2. Afterwards, find your pair/tf Distance Zone . When optimising this, what we seek is just a "not to bad" equity curves to start forming. At least Max Drawdown should lessen more. Doesn't have to be great already, but should be better, no red in Net Profit.
3. Then go manage the "Trailing Minimum Profit", TP, SL, and max SL.
4. Repeat 1,2,3. 👻
5. Manage order size, commission, and/or enable double-order (need pyramiding) if you like. Check if your equity can handle max drawdown before margin call.
6. After getting an acceptable backtest result, go to List of Trades tab and find the biggest loss or when many sequencing loss in a row happened. Click on it to go to exact point on chart, observe why the signal failed and get at least general idea how it can be prevented . The rest is yours, you should know your pair/tf more than other.
You can also re-explore your minimum-maximum period for both Major and minor xHMA+.
Keep in mind that all numbers in Setting are conceptually in a form of range . You don't want to get superb equity curves but actually a "fragile" , means one can easily turn it to disaster just by changing only a fraction in one/two of the setting.
---
If you just wanna test the strength of the indicator alone, you can disable "Use StopLoss" temporarily while optimising settings.
Using no SL might be tempting in overall result data in some cases, but NOTE: It is not recommended to not using SL, don't forget that we deliberately enter when it's in high volatility. If want to add flexibility or trading for long-term, just maximise your SL. ie.: chose SL Point>ATR only and set it maximum. (Check your max drawdown after this).
I think this is quite important specially for beginners, so here's an example; Hypothetically in below scenario, because of some settings, the buy order after the loss sell signal didn't appear. Let's say if our initial capital only 1000$ using leverage and order size 0,5 lot (risky position sizing already), moreover if this happens at the beginning of your trading season, that's half of account gone already in one trade . Your max SL should've made you exit after that pumping bar.
The Trailing Minimum Profit is actually look like this. Search in the code if you want to plot it. I just don't like too many lines on chart.
To maximise profit we can try enabling double-order. The only added rule coded is: RSI should rising when buy and falling when sell. 2nd signal will appears above or below default buy/sell signal. (Of course it's also prone to double-loss, re-check your max drawdown after. Profit factor play its part in here for a long run). Snapshot in comparison:
Two default sell signals on left closed at RSI exit, the additional sell signal closed later on when price crossover minor xHMA+. On buy side, price haven't met our minimum profit when first crossunder minor xHMA+. If later on we hit SL on this "+buy" signal, at least we already profited from default buy signal. You can also consider/treat this as multiple TP points.
For longer-term trading, what you need to maximise is the Minimum Profit , so it won't exit whenever an exit condition happened, it can happen several times before reaching minimum profit. Hopefully this snapshot can explain:
Notice in comparison default sell and buy signal now close in average after 3 days. What's best is when we also have confirmation from higher TF. It's like targeting higher TF by entering from smaller TF.
As also mention in the study, we can still experiment via original HMA by putting same value for minimum-maximum period setting. This is experimental EU 1H with Major xHMA+: 144-144, Flat market 13, Distance multiplier 3.6, with 2nd order activated.
Kiwi was a bit surprising for me. It's flat market is effectively below 6, with quite far distance zone of 3.5. Probably because I'm using big numbers in adaptive period.
---
The result you see in strategy tester report below for EURUSD 15m is using just default settings you see in code, as follow:
0,1 lot for each order (which is the smallest allowed by my broker).
No pyramiding. Commission: 0.5 usd per order. Slippage: 3
Opening position is only using basic strategy #1 (RSI exit). Additional exit not activated.
Minimum Profit: 1. TP: 3.
SL use: Half-distance zone. Max SL: 4.5.
Major xHMA+: 172-233. minor xHMA+: 89-121
Distance Zone Multiplier: 2.7
RSI: Standard 14.
(From our forward-testing, the difference we get from net profit is because of the spread, our entry isn't exactly at the close/open price. Not so much though, but not the same. If somebody can direct me to any example where we can code our entry via current bid/ask price, that would be awesome!)
It's already a long post (sorry), think I'm gonna pause here. Check out the code :)
---
DISCLAIMER: Past performance is no guarantee of future results , and so on.. you know the drill ;)
Please read whole description first before using, don't take 1-2 paragraph and claim it's the whole logic, you are responsible of your own actions and understanding.
Jaws Mean Reversion [Strategy]This very simple strategy is an implementation of PJ Sutherlands' Jaws Mean reversion algorithm. It simply buys when a small moving average period (e.g. 2) is below
a longer moving average period (e.g. 5) by a certain percentage and closes when the small period average crosses over the longer moving average.
If you are going to use this, you may wish to apply this to a range of investment assets using a screener for setups, as the amount signals are low. Alternatively, you may wish to tweak the settings to provide more signals.
Context can be found here:
LINK
Wave Trend w/ VWMA overlayThis is a trend-following strategy and indicator which combines the Wave Trend Strategy (Lazy Bear) by thomas.gigure with the cRSI + Waves Strategy with VWMA overlay by Dr_Roboto .
You may update the parameters of the Wave Trend oscillator or the VWMA indicator to match your own preferences. You may also adjust the Base Quantity used for determining trade size (as described below) to suit your account size and risk tolerance.
The strategy identifies potential signals based on the on the Wave Trend oscillator, originally ported to TradingView by LazyBear. When a signal is produced by the Wave Trend oscillator, trade size is determined by the VWMA.
When the VWMA is trending against the direction of the Wave Trend signal, Base Quantity x 1 is used
When the VWMA is trending neutral, Base Quantity x 2 is used
When the VWMA is trending with the direction of the Wave Trend signal, Base Quantity x 4 is used
The strategy includes the ability to limit trade signals to certain defined periods of time ("Sessions") during the trading day and, optionally, to close any open position at the end of either or both "Sessions." This may be enabled/disabled via the Limit Signals to Trading Sessions? option on the "Inputs" tab of the strategy's "Settings" window.
If you are trading on a daily chart (or longer) you must disable the Limit Signals to Trading Sessions? in order for the strategy to produce signals.
DRSI DMA Scalping Strategy No RepaintThis strategy compares the slope of a Moving Average (of your choosing) to the slope of a Momentum Indicator (of your choosing). Zero is the center line because 0 slope means sideways movement. When both lines cross your buy threshold, it buys. When both lines cross your Sell threshold, it sells. The lines may look choppy, but that is probably because it is referencing a different timeframe than what the chart is set to. I left as many settings adjustable by the user as possible so you can tune this strategy to the relative behavior of whatever you are trading.
This also includes a No Repaint function so the backtest should be as close to live trading as possible.
Momentum StrategyThis strategy uses momentum to determine when to enter and exit positions. The default settings are set to look for a new 63 day high (~1 trading quarter) and a new 40 day relative high. If the stock is trending above the 50 day moving average it is a candidate to be bought. Stops are triggered when price closes below the 20 day or 50 day EMAs depending on how well the stock is trending. A stop could also be triggered even if price continues to move up, but is breaking down on a relative basis to a benchmark either SPX or BTCUSD . The goal is to hold on to our winners for as long as possible and cut the losers as soon as possible. This will alow us to capture the majority of major trends while avoiding many large drawdown and relative losers.
Combo Backtest 123 Reversal & Psychological line This is combo strategies for get a cumulative signal.
First strategy
This System was created from the Book "How I Tripled My Money In The
Futures Market" by Ulf Jensen, Page 183. This is reverse type of strategies.
The strategy buys at market, if close price is higher than the previous close
during 2 days and the meaning of 9-days Stochastic Slow Oscillator is lower than 50.
The strategy sells at market, if close price is lower than the previous close price
during 2 days and the meaning of 9-days Stochastic Fast Oscillator is higher than 50.
Second strategy
Psychological line (PSY), as an indicator, is the ratio of the number of
rising periods over the total number of periods. It reflects the buying
power in relation to the selling power.
If PSY is above 50%, it indicates that buyers are in control. Likewise,
if it is below 50%, it indicates the sellers are in control. If the PSY
moves along the 50% area, it indicates balance between the buyers and
sellers and therefore there is no direction movement for the market.
WARNING:
- For purpose educate only
BTC Rapid fire strategy 1M ScalpingRapid Fire strategy is known for scalping strategy for 1 min EURUSD
I change 15 pip stop loss for eurusd and 1.5% for BTC
for Take profit 10 pip foreurusd and 1% for BTC
MA Emperor insiliconot StrategyConverted EmperorBTC's EMA crossover indicator for easy backtesting and added ability to:
Specify time period for backtesting
Specify order quantity
Toggle original indicators (default off)
Quoting EmperorBTC:
Entry is to be made when the
1. Cross over gives a P(Positive Sign) and the candle completely closes above the cross-over
2. When the Heikin Ashi turns green and the next green HA candle goes above the previous green HA candle.
3. The price should be at-least above the 0.236 Level from the Swing high.
Kindly note that the strategy only attempts to do check number 1, where it ensures the entry opens above the cross-over.
Donchian Channel StrategyRide the trend with full potential. Filter out false signals using long period ema. Lower bands take care of the stop loss.
Use this strategy for banknifty futures for consistent quarterly returns.
Combo Backtest 123 Reversal & Prime Number Oscillator This is combo strategies for get a cumulative signal.
First strategy
This System was created from the Book "How I Tripled My Money In The
Futures Market" by Ulf Jensen, Page 183. This is reverse type of strategies.
The strategy buys at market, if close price is higher than the previous close
during 2 days and the meaning of 9-days Stochastic Slow Oscillator is lower than 50.
The strategy sells at market, if close price is lower than the previous close price
during 2 days and the meaning of 9-days Stochastic Fast Oscillator is higher than 50.
Second strategy
Determining market trends has become a science even though a high number or people
still believe it’s a gambling game. Mathematicians, technicians, brokers and investors
have worked together in developing quite several indicators to help them better understand
and forecast market movements.
Developed by Modulus Financial Engineering Inc., the prime number oscillator indicates the
nearest prime number, be it at the top or the bottom of the series, and outlines the
difference between that prime number and the respective series.
WARNING:
- For purpose educate only
- This script to change bars colors.
Hammers & Stars StrategyOverview
This script trades basic hammer and shooting star candlestick patterns.
It's an extremely simple strategy with minimal filters, and according to my personal manual backtesting and automated trading results, performs best on the Daily chart on certain forex pairs.
It is intended to be traded on the forex markets but theoretically should work on all markets (especially if you optimize the settings).
The script also comes with complete AutoView automation for Oanda.
Make sure you've connected AutoView to TradingView and Oanda, then simply set an alert using the "alert() function calls only" condition and it will automatically execute trades based on whatever settings you've selected (only recommended for experienced traders - use at your own risk!)
If you're not sure how to set up AutoView, search "The Art of Trading AutoView Guide" on YouTube to find my detailed video guide.
Check out my website and YouTube channel for more information, scripts, resources and free Pine Script & trading lessons (link in my profile).
Best of luck with your trading!
- Matt / The Art of Trading
Settings Menu
Tooltips are included explaining what the various settings do, but here's a quick summary:
Strategy Settings
>= ATR Filter: Minimum size of entry candle compared to ATR
<= ATR Filter: Maximum size of entry candle compared to ATR
Stop Loss ATR: Stop loss multiplier (x ATR)
R:R: Risk:Reward profile
Fib Level: Used to calculate upper/lower third of candle. (For example, setting it to 0.5 will mean hammers must close >= 50% mark of the total candle size)
Start Date Filter: Date & time to begin trading from
End Date Filter: Date & time to stop trading
AutoView Oanda Settings
Use Oanda Demo: If turned on then oandapractice broker prefix will be used for AutoView alerts (demo account). If turned off then live account will be used
Use Limit Order: If turned on then AutoView will use limit orders. If turned off then market orders will be used (recommended to use limit order to mitigate spread issues)
Days To Leave Limit Order: This is your GTD setting (good til day)
Account Balance: Your account balance (used for calculating position size)
Account Currency: Your account balance currency (used for calculating position size)
Risk Per Trade %: Your risk per trade as a % of your account balance
VixFixLinReg-StrategyThis idea came up while discussing about strategies with one of the trading enthusiast from tradingview community.
Strategy basically uses existing script of Vix Fix by Chris Moody:
VixFix is a great indicator for finding the market bottoms. But, sometimes it generates signal too early. But, we can apply linear regression on vix fix to find vix fix top to make timing much better.
Entry condition:
Wait for Vix fix bar to turn lime.
Once vix fix is turned lime, then wait for linear regression (shown below 0) to turn lime from green. This indicates VIX-Fix has started declining.
Go long once above two conditions are satisfied
Exit Condition:
ATR Based Stop
Applied only if linear regression is green - which means VixFix rising.
Note: This is ideal for identifying market bottom. May not yield good results on individual stocks.
Combo Backtest 123 Reversal & Prime Number Bands This is combo strategies for get a cumulative signal.
First strategy
This System was created from the Book "How I Tripled My Money In The
Futures Market" by Ulf Jensen, Page 183. This is reverse type of strategies.
The strategy buys at market, if close price is higher than the previous close
during 2 days and the meaning of 9-days Stochastic Slow Oscillator is lower than 50.
The strategy sells at market, if close price is lower than the previous close price
during 2 days and the meaning of 9-days Stochastic Fast Oscillator is higher than 50.
Second strategy
Determining market trends has become a science even though a high number
or people still believe it’s a gambling game. Mathematicians, technicians,
brokers and investors have worked together in developing quite several
indicators to help them better understand and forecast market movements.
The Prime Number Bands indicator was developed by Modulus Financial Engineering
Inc. This indicator is charted by indentifying the highest and lowest prime number
in the neighborhood and plotting the two series as a band.
WARNING:
- For purpose educate only
- This script to change bars colors.
Combo Backtest 123 Reversal & Positive Volume Index This is combo strategies for get a cumulative signal.
First strategy
This System was created from the Book "How I Tripled My Money In The
Futures Market" by Ulf Jensen, Page 183. This is reverse type of strategies.
The strategy buys at market, if close price is higher than the previous close
during 2 days and the meaning of 9-days Stochastic Slow Oscillator is lower than 50.
The strategy sells at market, if close price is lower than the previous close price
during 2 days and the meaning of 9-days Stochastic Fast Oscillator is higher than 50.
Second strategy
The theory behind the indexes is as follows: On days of increasing volume,
you can expect prices to increase, and on days of decreasing volume, you can
expect prices to decrease. This goes with the idea of the market being in-gear
and out-of-gear. Both PVI and NVI work in similar fashions: Both are a running
cumulative of values, which means you either keep adding or subtracting price
rate of change each day to the previous day`s sum. In the case of PVI, if today`s
volume is less than yesterday`s, don`t add anything; if today`s volume is greater,
then add today`s price rate of change. For NVI, add today`s price rate of change
only if today`s volume is less than yesterday`s.
WARNING:
- For purpose educate only
- This script to change bars colors.
Backtesting 3commas DCA Bot v2Updating previously published simulated 3commas DCA logic with a sexier insert and more meaningful default parameters.
Combo Backtest 123 Reversal & Pivot Point V2 This is combo strategies for get a cumulative signal.
First strategy
This System was created from the Book "How I Tripled My Money In The
Futures Market" by Ulf Jensen, Page 183. This is reverse type of strategies.
The strategy buys at market, if close price is higher than the previous close
during 2 days and the meaning of 9-days Stochastic Slow Oscillator is lower than 50.
The strategy sells at market, if close price is lower than the previous close price
during 2 days and the meaning of 9-days Stochastic Fast Oscillator is higher than 50.
Second strategy
Pivot points simply took the high, low, and closing price from the previous period and
divided by 3 to find the pivot. From this pivot, traders would then base their
calculations for three support, and three resistance levels. The calculation for the most
basic flavor of pivot points, known as ‘floor-trader pivots’, along with their support and
resistance levels.
WARNING:
- For purpose educate only
- This script to change bars colors.
Combo Backtest 123 Reversal & Pivot Detector Oscillator Copyright by HPotter v1.0 20/04/2021
This is combo strategies for get a cumulative signal.
First strategy
This System was created from the Book "How I Tripled My Money In The
Futures Market" by Ulf Jensen, Page 183. This is reverse type of strategies.
The strategy buys at market, if close price is higher than the previous close
during 2 days and the meaning of 9-days Stochastic Slow Oscillator is lower than 50.
The strategy sells at market, if close price is lower than the previous close price
during 2 days and the meaning of 9-days Stochastic Fast Oscillator is higher than 50.
Second strategy
The Pivot Detector Oscillator, by Giorgos E. Siligardos
The related article is copyrighted material from Stocks & Commodities 2009 Sep
WARNING:
- For purpose educate only
- This script to change bars colors.