Time Intervals [signBTC]This script is designed to visualize 6 auxiliary time intervals on the chart near the time axis. Each of these intervals can be configured by the user with the following options:
Interval duration: Any duration can be set (for example, 1 hour, 2 hours, 4 hours, etc.).
Interval color: Each time block can have its own color for better visual distinction.
Label: Users can add a custom label for each of the 6 intervals to indicate its purpose or highlight important features.
In the default configuration, the script automatically draws 6 equal four-hour intervals for each trading day, dividing each daily trading session into six parts—two for each of the three standard market sessions, or three per each of two major sessions (if considering only regular daytime and extended overnight trading).
This tool is particularly useful for traders who want to quickly navigate different time areas of the trading day, monitor individual parts of a session, or highlight specific time windows for strategy analysis. All script parameters (interval, color, and label for each block) are easily adjustable in the indicator's settings.
Timeframe

CHoCH + BOS + LQ Sweep v6.3.8 PRO+The CHoCH + BOS + LQ Sweep PRO indicator is a comprehensive Smart Money Concepts (SMC) tool designed to identify market structure shifts, liquidity sweeps, and key supply-demand zones across multiple timeframes. It helps traders visualize crucial price action patterns like Change of Character (CHoCH), Break of Structure (BOS), and liquidity grabs that often precede significant market reversals or continuations.
This tool is especially suited for traders applying multi-timeframe analysis and liquidity-based trading strategies on Forex, crypto, indices, or commodities.
1. Liquidity Sweeps (LQ Sweeps)
Identifies when price sweeps previous highs/lows (stop hunts/liquidity grabs).
Configurable strength setting to filter minor vs. major sweeps.
Optional stop at wick or stop at close logic for more precise entries.
Old sweeps can be displayed or hidden, with user-defined limits for historical sweeps.
2. Multi-Timeframe (HTF) Sweeps
Displays liquidity sweeps from higher timeframes (M15, H1, H4, D1, W1).
Individual checkboxes allow flexible combinations (e.g., show only H1 & H4 sweeps).
Unique colors for each timeframe to differentiate visually on the chart.
3. Supply/Demand Zones
Automatically plots zones around swing highs and lows.
Zones are dynamically updated and locked once price interacts with them.
Configurable view: Show both bullish/bearish zones or filter for one side only.
Option to display/hide old zones and limit the number of zones shown.
4. Historical Sweep Management
Stores up to 5000 sweeps internally, while adhering to TradingView’s rendering limits (max 500 drawn).
Ensures chart clarity by prioritizing the most recent sweeps.

Multi-Timeframe Resonance v2.0📌 Multi-Timeframe Resonance System — Identify trend, range, and turning points at a glance
✨ Core Advantages:
🔹 Multi-timeframe resonance analysis: Detects trend direction and range across timeframes. Helps identify M tops, W bottoms, consolidation turning points, and trend switches.
🔹 Clear phase visualization: Highlights trend momentum (green) and consolidation zones (red).
🔹 Universally compatible: Works on stocks/ETFs, futures/commodities, forex, gold, crypto — parameter tuning is the only requirement.
🎯 Target Users:
✅ Traders needing fast structure analysis
✅ Trend-followers, swing traders, or range-arbitrageurs
✅ Multi-timeframe analysts & volume researchers
✅ Quant teams seeking stable signal output
📈 Market Structure Evolution Sequence:
**Same-Bear → Small Box Bull → Medium Box Bull → Large Box Bull → Same-Bull → Small Box Bear → Medium Box Bear → Large Box Bear → Same-Bear**
- “Same-Bear”/“Same-Bull”: full agreement among timeframes,strongest trend stages.
- “Small/Medium/Large Box”: represent increasing-level consolidations indicating trend emergence or turn.
🔍 By identifying the current structure phase, traders can determine if:
- The market is in the **early trend stage** (Same-Bull/Same-Bear)
- Or in a **trend shift period** (Bear→Bull or Bull→Bear)
- Or still **oscillating** (structures switching)
⚠️ **Practical Note:**
Although structure usually follows the sequence above, in strong or volatile moves it may:
- **Skip steps** (e.g., Same-Bear → Large Box Bull)
- **Switch rapidly** within a few candles
Traders should use volume, candle patterns, and higher-timeframe trends to confirm valid structure changes or avoid false breakouts.
📌 Execution Logic:
This indicator applies **multi-timeframe resonance** to capture **trend pullbacks**:
- Identifies trend direction via higher timeframes
- Uses pullback in shorter timeframe to signal entry
- Executes trend-following trades at pullback points
- Protects with structured stop-loss based on higher timeframe structure
🔒 This is a protected script. For access details, please see the Author’s Instructions.
📌 多周期共振识别系统 — 趋势、震荡与拐点,一目了然
✨ 核心优势:
🔹 多周期共振分析:同时检测多个周期的趋势方向与震荡结构,辅助识别 M 顶 / W 底 / 震荡拐点 / 趋势转换等关键信号。
🔹 趋势与震荡清晰可视:自动高亮趋势推进(绿色)与震荡盘整(红色)区域,一眼看清市场节奏。
🔹 全品种通用:适配股票 / ETF、期货 / 商品、外汇 / 黄金、加密货币等市场,仅需轻微参数微调。
🎯 适用人群:
✅ 需要快速识别图表结构的交易者
✅ 趋势跟随者、波段捕捉者、震荡套利者
✅ 热衷于多周期分析与量能行为研究的交易者
✅ 追求稳定信号输出的量化策略团队
📈 市场结构演变路径:
同空 → 小箱多 → 中箱多 → 大箱多 → 同多 → 小箱空 → 中箱空 → 大箱空 → 同空
“同空” / “同多”:表示多周期趋势完全一致,代表趋势最强阶段
“小箱 / 中箱 / 大箱”:代表不同级别的震荡结构,结构逐步递进,表示趋势正在酝酿或转向
🔍 通过识别当前所处的结构阶段,交易者可以判断:
当前是否处于趋势初期阶段(如同空 / 同多)
是否处于趋势转换区间(如由空转多或由多转空)
或仍处于震荡反复区间(结构频繁切换)
⚠️ 实战提醒:
虽然市场结构通常遵循上述顺序演化,但在强趋势或剧烈波动行情下,可能出现以下情况:
跳跃演化(如从“同空”直接进入“大箱多”阶段)
快速切换(几根K线内连续跳过多个结构)
因此,交易者应结合量能、K线形态及更高周期趋势,判断结构变化是否“有效”或为“假突破”。
📌 执行逻辑:
本指标通过多周期趋势共振确认,捕捉趋势中的回踩机会:
利用高阶周期判断趋势方向
在低阶周期的回踩位置作为进场信号
顺势交易,捕捉主趋势中的低吸 / 高抛机会
止损位置依据上位周期结构确认,明确清晰
🔒 本脚本为受控授权版本,如需获取使用权限,请参阅“作者说明”。

Candle Ghosts: MTF 3 Candle Viewer by Chaitu50cCandle Ghosts: MTF 3 Candle Viewer helps you see candles from other timeframes directly on your chart. It shows the last 3 candles from a selected timeframe as semi-transparent boxes, so you can compare different timeframes without switching charts.
You can choose to view candles from 30-minute, 1-hour, 4-hour, daily, or weekly timeframes. The candles are drawn with their full open, high, low, and close values, including the wicks, so you get a clear view of their actual shape and size.
The indicator lets you adjust the position of the candles using horizontal and vertical offset settings. You can also control the spacing between the candles for better visibility.
An optional EMA (Exponential Moving Average) from the selected timeframe is also included to help you understand the overall trend direction.
This tool is useful for:
Intraday traders who want to see higher timeframe candles for better decisions
Swing traders checking lower timeframe setups
Anyone doing top-down analysis using multiple timeframes on a single chart
This is a simple and visual way to study how candles from different timeframes behave together in one place.

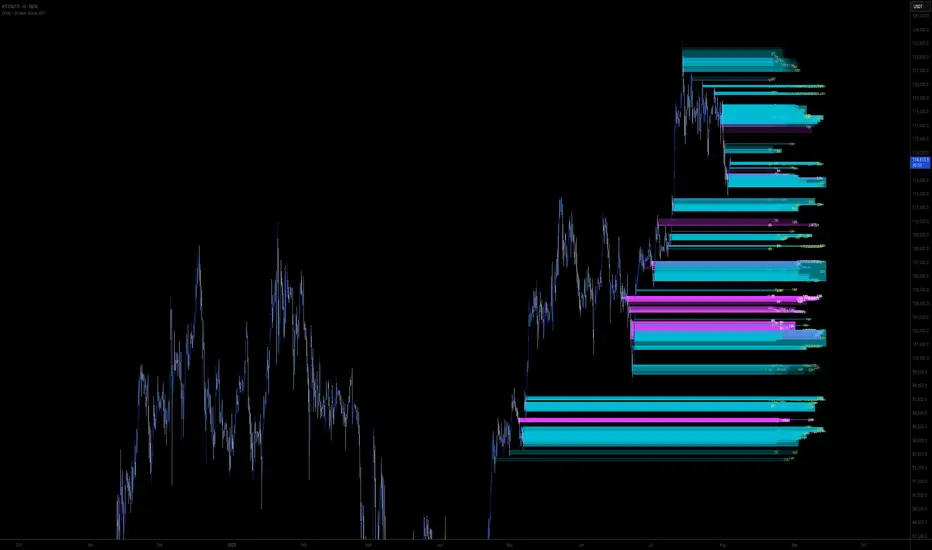
Multi Ranges Volume Distribution [LuxAlgo]The Multi Ranges Volume Distribution tool allows traders to see the volume distribution by price for three different timeframes simultaneously. Each distribution can report the total amount of accumulated volume or the accumulated buy/sell volume separately.
Levels are displayed at the top and bottom of each timeframe's range, as well as the POC or level with the most volume.
🔶 USAGE
By default, the tool displays daily, weekly, and monthly volume distributions, highlighting the accumulated volume within each row.
Each distribution shows the volume at each price, as well as three lines: the top and bottom prices, and the price at which the most volume was traded.
The reported accumulated volume can be useful for highlighting which price areas are of the most interest to traders, with the specific timeframe specifying whether this interest is long-term or short-term.
🔹 Timeframes & Rows
Traders can adjust the timeframe and the number of rows for each volume distribution.
This is useful for multi-timeframe analysis of volume at the same price levels, or for obtaining detailed data within the same timeframe.
The chart above shows three volume distributions with the same monthly timeframe but a different number of rows; each is more detailed than the previous one.
🔹 Total vs Buy & Sell Volume
Traders can choose to display either the total volume or the buy and sell volumes.
As we can see on the above chart, the background of each row uses a gradient that is a function of the delta between the buy and sell volumes.
This is useful to determine which areas attract buyers and sellers.
🔶 SETTINGS
Volume Display: Select between total volume and buy and sell volume.
Distance between each box: Adjust the spacing of the volume distributions.
Period A: Select a timeframe and the number of rows.
Period B: Select a timeframe and the number of rows.
Period C: Select a timeframe and the number of rows.

Adaptive Squeeze Momentum +Adaptive Squeeze Momentum+ (Auto-Timeframe Version)
Overview
Adaptive Squeeze Momentum+ is an enhanced volatility and momentum indicator designed to identify compression and expansion phases in price action. It is inspired by the classic Squeeze Momentum Indicator by LazyBear but introduces automatic parameter adaptation to any timeframe, making it simpler to use across different markets without manual configuration.
Concepts and Methodology
The script combines Bollinger Bands (BB) and Keltner Channels (KC) to detect periods when volatility contracts (squeeze) or expands (release).
A squeeze occurs when BB are inside KC, suggesting low volatility and potential breakout scenarios.
A squeeze release is detected when BB expand outside KC.
Momentum is derived using a linear regression applied to the difference between price and a midrange reference level.
Original Improvements
Compared to the original Squeeze Momentum Indicator, this version offers several enhancements:
Automatic Adaptation: BB and KC lengths and multipliers are dynamically adjusted based on the chart’s timeframe (from 1 minute up to 1 month), removing the need for manual tuning.
Simplified Visualization: A clean, minimalist histogram and clear squeeze state cross markers allow for faster interpretation.
Flexible Application: Designed to work consistently on intraday, daily, and higher timeframes across crypto, forex, stocks, and indices.
Features
Dynamic Squeeze Detection:
Gray Cross: Neutral (no squeeze detected)
Blue Cross: Active squeeze
Yellow Cross: Squeeze released
Momentum Histogram:
Positive/negative momentum shown with slope-based coloring.
Timeframe-Aware Parameters:
Automatically sets optimal BB/KC configurations.
Usage
Watch for blue crosses indicating an active squeeze phase that may precede a directional move.
Use the histogram color and slope to gauge momentum strength and direction.
Combine squeeze release signals with momentum confirmation for potential entries or exits.
Credits and Licensing
This script was inspired by LazyBear’s OLD “Squeeze Momentum Indicator” (). The implementation here significantly expands upon the original by introducing auto-adaptive parameters, restructured logic, and a new visualization approach. Published under the Mozilla Public License 2.0.
Disclaimer
This indicator is for educational purposes only and does not constitute financial advice. Use at your own risk.

Candle close on high time frameOVERVIEW
This indicator plots persistent closing levels of higher time frame candles (H1, H4, and Daily) on the active intraday chart in real time. Unlike similar tools, it offers granular control over line projection length, fully independent toggles per timeframe, and a built-in mechanism that automatically limits the total number of historical levels to avoid chart clutter and performance issues.
CONCEPTS
Key levels from higher time frames often act as areas where price reacts or consolidates. By projecting each candle's exact closing price forward as a horizontal reference, traders can quickly identify dynamic support and resistance zones relevant to the current price action. This indicator enables seamless multi-timeframe analysis without the need to manually switch chart intervals or re-draw lines.
FEATURES
Independent Time Frame Selection: Enable or disable H1, H4, and Daily levels individually to tailor the analysis.
Custom Extension Length: Each timeframe's closing level can be projected forward for a user-defined number of bars.
Performance Optimization: The script maintains an internal limit (default: 100) on the number of active lines. When this threshold is exceeded, the oldest lines are removed automatically.
Visual Differentiation: Colors for each timeframe are fully customizable, enabling immediate recognition of level origin.
Immediate Update: New levels appear as soon as a higher timeframe candle closes, ensuring real-time reference.
USAGE
From the indicator inputs, select which timeframes you want to track.
Adjust the extension lengths to fit your trading style and time horizon.
Customize the line colors for clarity and personal preference.
Use these projected levels as part of your confluence criteria for entries, exits, or stop placement.
Combine with trend indicators or price action tools to enhance your multi-timeframe strategy.
ORIGINALITY AND ADDED VALUE
While similar scripts exist that plot higher timeframe levels, this implementation differs in:
Its efficient automatic cleanup of old lines to preserve chart performance.
The independent extension and color settings per timeframe.
Immediate reaction to new candle closes without repainting.
Simplicity of use combined with precise customization.
This combination makes it a practical and flexible tool for traders who rely on clear HTF level visualization without manual drawing or the limitations of built-in TradingView tools.
LICENSE
This script is published open-source under the Mozilla Public License 2.0.

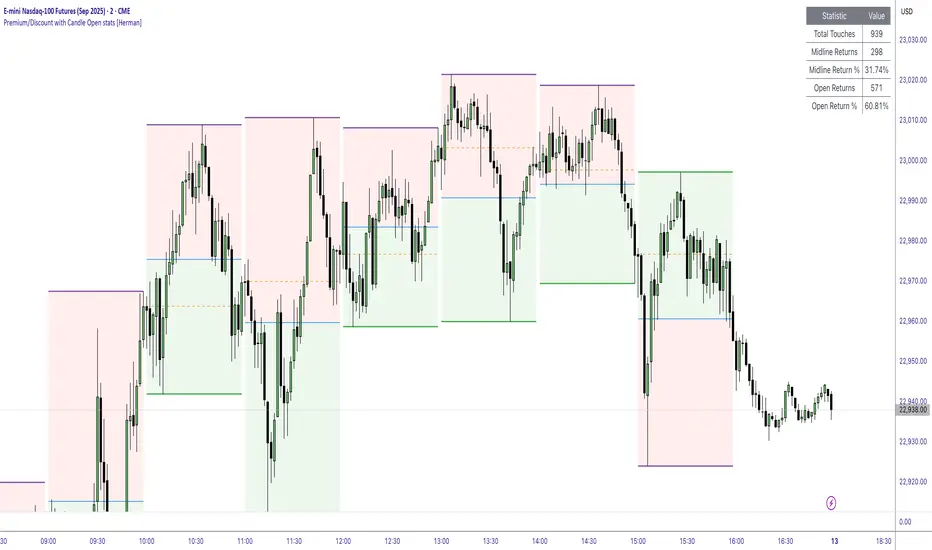
Premium/Discount with Candle Open stats [Herman]Premium/Discount with Stats
This indicator is designed to help traders identify and analyze premium/discount zones on any timeframe while automatically tracking statistics on price behavior relative to these zones. It is especially valuable for traders looking to structure entries, manage targets, and quantify market reactions to prior session ranges.
What it draws on the chart
✅ Range High and Low Lines
For each selected timeframe period (15min, 30min 1H, 4H, Daily), the indicator plots the high and low of the completed previous period.
These lines are color-coded dynamically based on sweep detection:
If the high was swept (price broke the previous high), the high line is marked as Premium.
If the low was swept, the low line is marked as Discount.
If both were swept or neither, it uses the default color settings.
✅ Midline
An optional midline at the 50% level of the previous period’s high-low range.
Helpful for mean-reversion traders or anyone watching for retests of equilibrium.
✅ Quartile Lines (25%–75%)
Optional additional lines at 25% and 75% of the previous range, helping traders visualize inner range subdivisions.
✅ Open Price Line
Marks the open price of the previous period as a horizontal reference.
✅ Background Fills
The region between low and midline is shaded with the Discount color.
The region between high and midline is shaded with the Premium color.
These optional fills help highlight the premium and discount zones visually.
✅ Current Incomplete Period Lines (optional)
You can choose to display provisional high, low, midline, quartiles, and open for the current forming period.
These update in real-time until the period closes.
Sweep Detection Logic
The indicator automatically tracks if the current period price sweeps above the previous period’s high or below the low.
A "sweep" is simply defined as price exceeding the previous high/low while tracking is active.
The sweep status affects the colors of the premium/discount lines, helping traders see potential liquidity grabs or stop hunts.
What it counts and tracks (Statistics)
The script automatically compiles statistics over time:
✅ Total Touches
Counts how many times the price in a new period touches either the previous period’s high or low.
A “touch” is registered once per side per period.
✅ Midline Returns
Counts how often, after touching the previous high/low, price returns to the previous period’s midline.
Gives you a measure of mean-reversion success.
✅ Open Returns
Similarly, tracks how often price returns to the previous period’s open after touching the previous high/low.
✅ Return Percentages
Displays the percentage of touches that result in a return to midline or open.
These percentages are calculated live on your chart and updated after each period closes.
✅ Stats Table
A customizable on-chart table summarizing all of these stats in real-time.
Helps traders evaluate the effectiveness of range-based trading setups over time.
How it Works (Technical details)
On each new bar, the script checks if a new period (as defined by your timeframe selection) has begun.
When a new period starts, the previous period’s high, low, open, midline, quartiles are recorded and drawn on the chart.
The script then “watches” the current period:
Updates provisional high and low.
Detects sweeps of previous highs/lows.
Tracks if price returns to the previous period’s midline or open after those sweeps.
Increments statistical counters if conditions are met.
Background fills and lines update dynamically based on real-time data.
Intended Use Cases
This indicator is ideal for:
✅ Identifying premium/discount zones for swing or intraday trades.
✅ Spotting liquidity sweeps and possible manipulation zones.
✅ Structuring trades with logical, data-driven target zones (midline, open).
✅ Quantifying the probability of mean-reversion moves after liquidity events.
✅ Developing and backtesting range-based trading models with live stats.
Highly Customizable
Choose any timeframe for defining the premium/discount range.
Toggle visibility of midline, quartiles, open line, current period preview.
Full control over colors, line styles, line widths, and background shading.
Optional real-time statistical table with total counts and return percentages.
Internal Candle Strength [LuxAlgo]The Internal Candle Strength tool allows traders to divide each chart bar into multiple rows of custom size and inspect the strength of the lower timeframes trends located within each row.
This tool effectively helps traders in identifying the power dynamic between bulls and bears within multiple areas within each bar, providing the ability to conduct LTF analysis.
🔶 USAGE
The strength displayed within each row ranges from 0% to 100%, with 0% being the most bearish and 100% being the most bullish.
Traders should be aware of the extreme probabilities located at the higher/lower end of the bars, as this can signal a change in strength and price direction.
Traders can select the lower timeframe to pull the data from or the row size in the scale of the chart. Selecting a lower timeframe will provide more data to evaluate an area's strength.
Do note that only a timeframe lower than the chart timeframe should be selected.
🔹 Row Size
Selecting a smaller row size will increase the number of rows per bar, allowing for a more detailed analysis. A lower value will also generally mean that less data will be considered when calculating the strength of a specific area.
As we can see on the chart above (all BTCUSD 30m), by selecting a different row size, traders can control how many rows are displayed per bar.
🔶 SETTINGS
Timeframe: Lower timeframe used to calculate the candle strength.
Row Size: Size of each row on the chart scale, expressed as a fraction of the candle range.

SMA Crossing Background Color (Multi-Timeframe)When day trading or scalping on lower timeframes, it’s often difficult to determine whether the broader market trend is moving upward or downward. To address this, I usually check higher timeframes. However, splitting the layout makes the charts too small and hard to read.
To solve this issue, I created an indicator that uses the background color to show whether the current price is above or below a moving average from a higher timeframe.
For example, if you set the SMA Length to 200 and the MT Timeframe to 5 minutes, the indicator will display a red background on the 1-minute chart when the price drops below the 200 SMA on the 5-minute chart. This helps you quickly recognize that the trend on the higher timeframe has turned bearish—without having to open a separate chart.
デイトレード、スキャルピングで短いタイムフレームでトレードをするときに、大きな動きは上に向いているのか下に向いているのかトレンドがわからなくなることがあります。
その時に上位足を確認するのですが、レイアウトをスプリットすると画面が小さくて見えにくくなるので、バックグラウンドの色で上位足の移動平均線では価格が上なのか下なのかを表示させるインジケーターを作りました。
例えば、SMA Length で200を選び、MT Timeframeで5分を選べば、1分足タイムフレームでトレードしていて雲行きが怪しくなってくるとBGが赤になり、5分足では200線以下に突入しているようだと把握することができます。

Two Poles Trend Finder MTF [BigBeluga]🔵 OVERVIEW
Two Poles Trend Finder MTF is a refined trend-following overlay that blends a two-pole Gaussian filter with a multi-timeframe dashboard. It provides a smooth view of price dynamics along with a clear summary of trend directions across multiple timeframes—perfect for traders seeking alignment between short and long-term momentum.
🔵 CONCEPTS
Two-Pole Filter: A smoothing algorithm that responds faster than traditional moving averages but avoids the noise of short-term fluctuations.
var float f = na
var float f_prev1 = na
var float f_prev2 = na
// Apply two-pole Gaussian filter
if bar_index >= 2
f := math.pow(alpha, 2) * source + 2 * (1 - alpha) * f_prev1 - math.pow(1 - alpha, 2) * f_prev2
else
f := source // Warm-up for first bars
// Shift state
f_prev2 := f_prev1
f_prev1 := f
Trend Detection Logic: Trend direction is determined by comparing the current filtered value with its value n bars ago (shifted comparison).
MTF Alignment Dashboard: Trends from 5 configurable timeframes are monitored and visualized as colored boxes:
• Green = Uptrend
• Magenta = Downtrend
Summary Arrow: An average trend score from all timeframes is used to plot an overall arrow next to the asset name.
🔵 FEATURES
Two-Pole Gaussian Filter offers ultra-smooth trend curves while maintaining responsiveness.
Multi-Timeframe Trend Detection:
• Default: 1H, 2H, 4H, 12H, 1D (fully customizable)
• Each timeframe is assessed independently using the same trend logic.
Visual Trend Dashboard positioned at the bottom-right of the chart with color-coded trend blocks.
Dynamic Summary Arrow shows overall market bias (🢁 / 🢃) based on majority of uptrends/downtrends.
Bold + wide trail plot for the filter value with gradient coloring based on directional bias.
🔵 HOW TO USE
Use the multi-timeframe dashboard to identify aligned trends across your preferred trading horizons.
Confirm trend strength or weakness by observing filter slope direction .
Look for dashboard consensus (e.g., 4 or more timeframes green] ) as confirmation for breakout, continuation, or trend reentry strategies.
Combine with volume or price structure to enhance entry timing.
🔵 CONCLUSION
Two Poles Trend Finder MTF delivers a clean and intuitive trend-following solution with built-in multi-timeframe awareness. Whether you’re trading intra-day or positioning for swing setups, this tool helps filter out market noise and keeps you focused on directional consensus.

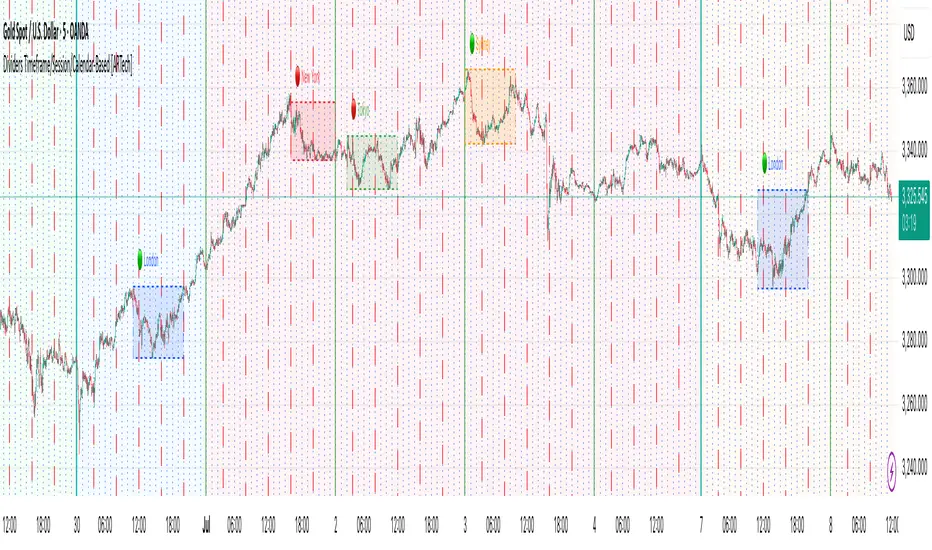
Dividers Timeframe/Session/Calendar-Based [ARTech]Dividers Timeframe/Session/Calendar-Based
This indicator provides customizable visual dividers for multiple timeframes, trading sessions, and calendar-based periods (daily, weekly, monthly). It helps traders visually separate chart areas by key time boundaries without cluttering the chart with price lines.
Key Features:
Multi-Timeframe Dividers: Select up to 4 timeframes (e.g., 60 min, 4 hours, daily, weekly) to display customizable lines marking the start of each timeframe’s candle.
Session Dividers: Define up to 4 trading sessions with user-defined time zones, colors, and active weekdays. The indicator highlights the session’s highest and lowest price range using a box, and compares the session’s opening and closing prices. Based on this comparison, it displays a green or red emoji to indicate bullish or bearish sessions, making it easy to identify session momentum visually.
Calendar-Based Dividers: Enable daily, weekly, or monthly background color zones, with individual toggles and color settings for each day, week, or month. Perfect for visually distinguishing trading periods.
Why use this indicator?
Divider Indicator helps keep your chart organized by visually segmenting timeframes, sessions, and calendar periods, aiding in better analysis of price action relative to important time boundaries.
How to Use
███████ Timezone ███████
A valid timezone name exactly as it appears in the chart’s lower-right corner (e.g. New York, London).
A valid UTC offset in ±H:MM or ±HH:MM format. Hours: 0–14 (zero-padded or not, e.g. +1:30, +01:30, -0:00). Minutes: Must be 00, 15, 30, or 45.
Examples;
UTC → ✅ Valid
Exchange → ✅ Valid
New York → ✅ Valid
London → ✅ Valid
Berlin → ✅ Valid
America/New York → ❌ Invalid. (Use "New York" instead)
+1:30 → ✅ Valid offset with single-digit hour
+01:30 → ✅ Valid offset with zero-padded hour
-05:00 → ✅ Valid negative offset
-0:00 → ✅ Valid zero offset
+1:1 → ❌ Invalid (minute must be 00, 15, 30, or 45)
+2:50 → ❌ Invalid (minute must be 00, 15, 30, or 45)
+15:00 → ❌ Invalid (hour must be 14 or below)
███████ Timeframe ███████
Use this section to display vertical divider lines at the opening of higher timeframe candles (e.g., 1H, 4H, Daily, Weekly). This helps visually separate price action according to larger market structures.
1. Enable a Timeframe:
Turn on one or more timeframes (e.g., 60, 240, D, W) by checking their respective toggle boxes.
2. Lines Mark Candle Opens:
Each active timeframe will draw a vertical line at the start of its candle , making it easier to align intraday moves with larger timeframe shifts.
3. Customize Line Style:
For each timeframe, you can individually set:
Line Style: Solid, dashed, or dotted.
Line Width: From 1 to 10 pixels.
Line Color: Pick any color to match your chart theme.
Opacity: Use transparent colors to avoid overwhelming the chart.
4. Use Multiple Timeframes Together:
You can enable multiple timeframe dividers simultaneously. To maintain clarity:
Use distinct colors for each timeframe.
Use thinner or dotted lines for lower timeframes and bolder lines for higher ones.
Match line style and color intensity to reflect timeframe importance. (e.g., a thick green solid line for Weekly, a thin gray dotted line for 1H)
5. Visual Tip:
These dividers are especially useful for identifying higher timeframe candle opens during intraday trading, spotting breaks above/below previous candle ranges, or aligning session-based strategies with higher timeframe trends.
███████ Session ███████
Use this section to visually highlight specific trading sessions (e.g., London, New York, Tokyo, Sydney) on your chart using time zones, session ranges, and optional weekday filters. This helps focus your analysis on active market hours.
1. Enable a Session:
Activate up to 4 separate trading sessions. Each session can be named (e.g., "London") and customized independently.
2. Set Session Time and Days:
Define session time using the hhmm-hhmm format. (e.g., 0800-1700)
Select which days of the week the session applies to (Sunday through Saturday)
Set your preferred time zone (UTC, Exchange, etc.) from the global settings.
3. Session Box Drawing:
For each active session, the indicator will:
Draw a background-colored box from the session’s start to end time.
Stretch the box to fit the highest and lowest price within that time window.
Draw an outline using customizable border style and width.
4. Session Labels and Directional Hints:
Optionally display the session’s name as a label.
The indicator compares the session’s opening and closing prices . Based on the result:
📈 Green emoji shows a bullish session (close >= open)
📉 Red emoji shows a bearish session (close < open)
5. Display Options:
Show all sessions, only the last session, or a specific number of previous sessions.
Customize label size, location (top/bottom), and whether it appears inside or outside the box.
Adjust background opacity to blend the sessions neatly into your chart.
6. Visual Tip:
Session boxes are particularly useful for:
Spotting repeated highs/lows during active trading hours.
Recognizing session-based breakouts or consolidations.
Comparing performance across different markets and time zones.
███████ Calendar-Based ███████
This section helps you visually segment your chart based on calendar periods: daily, weekly, and monthly. You can enable background color highlighting for individual days, weeks, or months to better track price movements within these time frames.
1. Enable Daily, Weekly, or Monthly Highlighting:
Toggle on the options for Daily, Weekly, and/or Monthly highlighting according to your needs.
2. Select Specific Days, Weeks, or Months:
For Daily, enable any combination of days (up to 7) to color-code.
For Weekly, enable up to 5 weeks per month to cover partial weeks.
For Monthly, enable up to 12 months with individual toggles and colors.
3. Customize Colors for Each Period:
Assign distinct colors to each day, week, or month for easy differentiation. Choose hues that stand out but avoid colors that are too close in tone for adjacent periods.
4. Background Opacity:
Adjust the opacity level of the background coloring to ensure it complements your chart without obscuring price data.
5. Handling Partial Weeks and Overlaps:
The weekly highlighting accounts for months that span 4 to 6 weeks by allowing toggles up to 5 weeks, including weeks that may partially overlap with previous or next months.
6. Visual Tip:
Calendar-based backgrounds are excellent for:
Quickly identifying price behavior within specific calendar units.
Comparing price action across days, weeks, or months.
Spotting seasonal trends or recurring patterns tied to calendar cycles.
Order + Breaker Blocks MTF - Vees Hidden LiquidityThis indicator is a Hidden Liquidity Script, being a much more refined and precise version of "Order Blocks" also known as "Supply and Demand" zones.
This script is more refined and precise as this script is the only script that displays the exact body part of blocks on multiple timeframes, showing potentially powerful price reversal zones for taking a long or short.
This is a PRICE ACTION indicator, demonstrating price action that can result in potential good support/resistance levels for taking a long or short trade.
This indicator only displays the body part of order blocks, instead of including wicks that all other indicators do. That makes this script a much more refined version of all other scripts out there.
Not only that, this script can collate multiple timeframes into one indicator, again something other scripts cannot do.
This script is also unique compared to other Hidden Liquidity style scripts in that you have full control over each Order Block so you can see each individual block on a chart, whilst other charts combine them into a zone instead. This refined version gives you precise potential entries and much further refinement as well as more thorough backtesting capabilities.
This script also can highlight order blocks that pass THROUGH a Fair Value Gap. These are known as 'Breaker Blocks'. These powerful blocks can be places of interest as support or resistance for a long or short trade. Note: This script shows the body part of a block only and not the wick.
Breaker Blocks, where significant displacement has occurred in price past a block can be more powerful. This script does not highlight Fair Value Gaps themselves, only order blocks (supply and demand) and breaker blocks through displacement in price (through an FVG). FVGs on their own can be weaker without order blocks behind them hence they are not highlighted.
The BODY of the order block, and the 0.5 of the order block are key regions for considering a trade, treating that level as either resistance or support.
Important: PLEASE NOTE: This indicator will only show timeframes that are higher than or the same as the current chart timeframe.
For Example, only blocks 3 Days or higher will show on a 3D chart. It will not show 12h blocks on a 3D chart. You would need to go to a 12 hour chart with the 12h blocks showing to see all Blocks that are 12h or higher drawn.
SETTINGS:
There is options to change the colours of the boxes and to differentiate between Order Blocks and stronger Breaker Blocks if desired.
If this is NOT desired, make all color options the same color,.
Shown below is blue Order Blocks (Supply and Demand
Shown below there is Pink Breaker Blocks.
There is options to weaken the colour of blocks that have been tapped by a wick and thus partially used up, also called partially "mitigated".These blocks can be considered weaker support/resistance.
Once a block has had a wick or body close over it entirely, the block can be considered fully "mitigated" and will disappear from the indicator once that candle has closed. This block level can now be considered too weak. You can also choose to not show these partially mitigated blocks at all.
The charts above shows pale Violet blocks as partially mitigated or "tapped" blocks.
The blocks in HOT BRIGHT Violet are untapped and potentially stronger levels for a Long or Short trade. See below the 7h.
Additional SETTINGS:
Further options include, if selected: Counting the number of fair value gaps an order block may pass through. More FVGs an order block (now a breaker block) passes through can strengthen the support of that block level, making a reversal more likely.
There is an option of showing old mitigated order blocks and changing the color of these on the chart. This can aid in backtesting of levels.
Further Settings include:
- an option to remove very thin blocks that may not be strong points.
- an option to denote with a character such as a * blocks that have their EQ 0.5 region wicked - these can be considered weaker.
- an option to denote with an additional * or another character blocks that are barely tapped by a small percent so you know they are still considered quite strong.
- an option to show how many candles form the order block.
Additional Options include:
- an option to show blocks only within a specific price range or percent range of the current price.
- an option to only look X number of bars back.
There is Options regarding labelling, and Border widths on boxes.
It is ESSENTIAL to do your own research and backtesting!
It is recommended to combine these levels with other concepts for added confluence.
Other indicators are NOT included in this script. This is purely a refined order block script for the BODY of a block only.
You can combine Order Blocks and stronger versions known as Breaker Blocks in this script with other indicators or concepts to form a Full Trading Strategy.
Other potential concepts to combine, not shown in this script can include Smart Money Concepts, Market Structure, Fibonnaccis, SMAs, EMAs or any other concept to give added confluence to the support / resistance levels identified in this script that may indicate that the level is stronger.
This indicator is not a trading strategy on its own. It is best used in combination with other concepts to improve the success.
Backtesting this indicator is highly recommended and incorporated into a full trading system of your own design. This only identifies possible key regions based on Price Action Strategies.
This indicator simply makes the identification of these hot levels easier and simpler to find, especially across multiple timeframes.
A strong bright zone on the indicator can be a stronger level than a weak partial block that is in light colours.
Again -Please do your own research and backtesting.
These indicators make finding these levels much much simpler and easier when combined with a full trading strategy.
Any feedback is welcome.
Multi-Timeframe OHLC Levels█ OVERVIEW
A fully customizable multi-timeframe indicator that independently plots levels based on the open, previous close, previous high, previous low, and previous mid-price.
This tool is ideal for traders who require a high level of tailoring and usability.
█ FEATURES
Multi-timeframe
Select the timeframe for each level separately. The indicator shows higher timeframe levels down to the 1-second chart.
Multi-source
Choose the source for each level individually from the current open, previous close, previous high, previous low, and previous mid-price.
Past levels
Manage the number of relevant levels displayed on historical bars for trading or backtesting.
Projections
Extend the levels to the current price action with clear and clean options.
Styling
Adjust the appearance according to your preferences and screen size using options for color, line style, line thickness, custom name, and text size.
█ NOTES
This is a PREMIUM indicator.
You may also find my free Daily Weekly Monthly Yearly Opens and Previous Day Week Highs & Lows indicators helpful.

Baseline TrendBaseline Trend Strategy Overview
Baseline Trend is a crypto-only trading strategy built on straightforward price-based logic: market direction is determined solely by the price’s position relative to a selected baseline open price. No technical indicators like RSI, MACD, or volume are used—this approach is purely focused on price action and position size manipulation.
This strategy is a genuine concept, developed from my own market analysis and logical theory, refined through extensive observation of crypto market behaviour.
While the strategy offers structure and adaptability, it’s important to recognise that no single trading system or indicator fits all market conditions. This tool is meant to support decision-making, not replace it—encouraging traders to stay flexible, informed, and in control of their risk.
Important Usage Note:
This system is intended for crypto markets only.
– When used as an indicator guide, it can be applied to both spot and futures markets.
– However, when used with web-hook automation, it is designed only for futures contracts.
Ensure compatibility with your trading setup before using automation features.
Core Logic: The Baseline
The strategy revolves around the concept of a “Baseline”, with three types available:
Main Baseline: Defines the primary trend direction. If the price is above, go long; if below, go short.
Second Baseline and Third Baseline: Used to measure buying/selling pressure and are key to certain take-profit logic options.
Baselines are customisable to different timeframes—Year, Month, Week, and more—based on available input settings. Structurally, the Main Baseline is the highest-level trend reference, followed by the Second, then Third.
Users can mix and match these baselines across timeframes to backtest crypto symbols and understand behaviour patterns, particularly when used with standard candlestick charts.
Entry & Exit Logic
Entry Signal: Triggered when price crosses over/under a defined distance (percentage) from the Main Baseline. This distance is the Trade Line, calculated based on the close price.
Exit Signal / Stop Loss: If price moves un-favorable and crosses over/under the Stop Loss Line (a defined distance from the Main Baseline), the open position will be force-closed according to user-defined settings.
LiqC (Liquidation Cut)
LiqC is a secondary stop-loss that activates when a leveraged position’s loss equals or exceeds the user-defined liquidation threshold. It forcefully closes the position to help prevent full liquidation before stop-loss, providing an extra layer of protection.
This LiqC is directly tied to the leverage level set by the user. Please ensure you understand how leverage affects liquidation risk, as different broker exchanges may use different liquidation ratio models. Using incorrect assumptions or mismatched leverage values may result in unexpected behaviour.
Position Sizing & Block Units
This strategy features a block-based position sizing system designed for flexibility and precision in trade management:
Block Range: Customisable from 1 to 10 blocks
Risk Allocation: Controlled through a user-defined ROE (Risk of Equity) value
For example, setting an ROE of 0.1% with 10 blocks allocates a total of 1% of account equity to the position. This structure supports both conservative and aggressive risk approaches, depending on user preference.
Block sizes are automatically calculated in alignment with exchange requirements, using Minimum Notional Value (MNV) and Minimum Trade Amount (MTA). These values are dynamically calculated based on the live market price, and scaled relative to the trader’s balance and selected risk percentage. This ensures accurate sizing with built-in adaptability for any account level and current market conditions.
Scalping Meets Trend Holding
This system blends short-term scalping with longer-term trend holding, offering a flexible and adaptive trading style.
Example:
Enter 10 blocks → take quick profits on 5 blocks → let the remaining 5 ride the trend.
This dual-layered approach allows traders to secure early gains while staying positioned for larger market moves. Think of it as:
5 Blocks to Protect: Capture quick wins and manage exposure.
5 Blocks to Pursue: Let profits run by following the broader trend.
By combining both protection and pursuit, the strategy supports risk control without sacrificing the potential for extended returns.
Flexible Take-Profit Logic
The strategy supports multiple, customisable take-profit mechanisms:
TP1–4 (Profit Percentage)
Triggers take profit of 1 block unit when unrealised gains reach defined percentage thresholds (TP1, TP2, TP3, TP4).
Buying/Selling Pressure-Based Take Profit
D1 – Pressure 1
Measures pressure between Second and Third Baselines.
If the distance between them exceeds a user-defined DPT (Decrease Post Threshold) and the price moves far enough from the Third Baseline, D1 activates to take profit or scale out one block.
D2 – Pressure 2
Measures pressure between the Main and Second Baselines.
Works similarly to D1, using a separate distance and pressure trigger.
Note: Both D1 and D2 deactivate in reversal or even trend conditions.
D3–5: High-High / Low-Low Logic
Based on bar index tracking after position entry:
For Long Positions: If after D3 bars the price doesn't exceed the previous bar's high, the system executes a take profit or scale-out.
For Short Positions: If the price doesn't drop below the previous low, the same logic applies.
This approach adds time-based and momentum-aware exit flexibility.
Leverage & Liquidation Risk
When backtesting with leverage enabled, the system checks whether historical candles exceed the liquidation range, calculated based on the average entry price and the leverage input. If the Liquidation Risk Count exceeds 1, profit and loss accuracy may be affected. Traders are encouraged to monitor this count closely to ensure realistic backtesting results.
Since the system cannot directly control or sync with your broker exchange’s actual leverage setting, it’s important to manually match the system’s leverage input with your broker’s configured leverage.
For example: If the system leverage input is set to 10, your exchange leverage setting must also be set to 10. Any mismatch will lead to inaccurate liquidation risk and PnL calculations.
Backtesting and Customisation
All TP1–4 and D1–5 functions are fully optional and customisable. Users are encouraged to backtest different crypto symbols to observe how price behaviour aligns with baseline structures and pressure metrics.
Each of the TP1–4 and D1–5 triggers is designed to execute only once per open position, ensuring controlled and predictable behaviour within each trade cycle.
Since backtesting is based on available historical bar data, please note that data availability varies depending on your TradingView subscription plan. For more reliable insights, it’s recommended to backtest across multiple time ranges, not just the full dataset, to assess the stability and consistency of the strategy’s performance over time.
Additionally, the time frame resolution interval in TradingView is customisable. For best results, use commonly supported time frames such as 30 minutes, 1 hour, 4 hours, 1 day, or 1 week. While the system is designed to support a broad range of intervals, non-standard resolutions may still cause calculation errors.
Currently, the system supports the following resolution ranges:
Intraday: from 1 minute to 720 minutes
(e.g., 60 minutes = 1 hour, 240 minutes = 4 hours, 720 minutes = 12 hours)
Daily: from 1 day to 6 days
Weekly: from 1 week to 3 weeks
Monthly: from 1 month to 4 months
Although the script is built to adapt to various resolutions, users should still monitor output behaviour closely, especially when testing less common or edge-case time frames.
System Usage Notice:
This system can be used as a standalone trading indicator or integrated with an exchange that supports web-hook signal execution. If you choose to automate trades via web-hook, please ensure you fully understand how to configure the setup properly. Web-hook integration methods vary between exchanges, and incorrect setup may lead to unintended trades. Users are responsible for ensuring proper configuration and monitoring of their automation.
Note on Lower Time Frame Usage
When using lower time frames (e.g., 1-minute charts) as the trading time frame, please be aware that available historical data may be limited depending on your subscription plan. This can affect the depth and reliability of backtesting, making it harder to establish a trustworthy probability model for a symbol’s behaviour over time.
Additionally, when pairing a high-level Main Baseline (MBL) time line (such as "1 Month") with low time frame resolutions (like 1-minute), you may encounter order execution limits or calculation overloads during backtesting. This is due to the large number of historical bars required, which can strain the system's capacity.
That said, if a user intentionally chooses to work with lower time frames, that decision is fully respected—but it should be done with awareness and at the user’s own risk.
Things to Be Aware Of (Web-hook Usage Only)
The following points apply if you're using web-hook automation to send signals from the system to an exchange:
Alert Signal Reliability
During extreme market volatility, some broker exchanges may fail to respond to web-hook signals due to traffic overload. While rare, this has occurred in the past and should be considered when relying on automation.
Alert Expiration (TradingView)
If you're on a Basic plan, TradingView alerts are only active for a limited time—typically around 1.5 months. Once expired, signals will no longer be sent out.
To keep your system active, reset the alert before expiration. For uninterrupted alerts, consider upgrading to a Premium plan, which supports permanent alert activation.
TradingView Alert Maintenance
TradingView may occasionally perform system maintenance, during which alerts may temporarily stop functioning. It’s recommended to monitor TradingView’s status if you’re relying on real-time automation.
Repainting
As of the current version, no repainting behaviour has been observed. Signal stability and consistency have been maintained across real-time and historical bars.
Order Execution Type and Fill Logic
All signals use Limit orders by default, except for MBL Exit and Fallback execution, which use Market orders.
Since Limit orders are not guaranteed to fill, the system includes logic to cancel unfilled orders and resend them. If necessary, a Fallback Market order is used to avoid conflict with new incoming trades.
This has only happened once, and is considered rare, but users should always monitor execution status to ensure accuracy and alignment with system behaviour.
Feedback
If you encounter any errors, bugs, or unexpected behaviour while using the system, please don’t hesitate to let me know. Your input is invaluable for helping improve the strategy in future updates.
Likewise, if you have any suggestions or ideas for enhancing the system—whether it’s a new feature, adjustment, or usability improvement—please feel free to share. Together, we can continue refining the tool to make it more robust and beneficial for everyone.
Disclaimer
All trading involves risk, particularly in the crypto market where conditions can be highly volatile. Past performance does not guarantee future outcomes, and market behaviour may evolve over time. This strategy is offered as a tool to support trading decisions and should not be considered financial or investment advice. Each user is responsible for their own actions and accepts full responsibility for any results that may arise from using this system.

HTF Box Range Overlay - FIXEDThis script overlays higher timeframe candles (e.g. 4H) onto lower timeframe charts (e.g. 5min), showing both the body and wick ranges of the last N HTF candles.
Features:
✔ Displays both candle body and wick as separate shaded boxes
✔ Fully customizable for bullish/bearish colors and wick appearance
✔ Supports any higher timeframe (15m, 1H, 4H, 1D, etc.)
✔ Clean overlay with no performance lag
✔ Automatically adjusts in real-time as new candles form
Great for traders using HTF zones, supply/demand, or structure-based confluence. Works best when used on intraday charts.

Aqua MTF Trend Oscillator——————————————————————————————————————————————————————————
The Aqua Multi-Timeframe (MTF) Trend Oscillator is a comprehensive momentum and trend analysis tool designed to synthesize
complex market dynamics into a single, intuitive oscillator. It moves beyond single-timeframe analysis by aggregating
trend information from up to five distinct, user-configurable sources—spanning different timeframes, symbols, and
moving average types.
--- CORE CONCEPT ---
The strength and direction of a trend are rarely uniform across all market perspectives. This indicator's core
principle is to quantify and weigh the trend's character from multiple angles simultaneously. By blending these
perspectives, it generates a composite score that reflects the overall "consensus" of trend momentum, providing
a more robust view than any single moving average could offer alone.
--- METHODOLOGY ---
The indicator's power lies in its sophisticated, multi-step normalization process for each analysis slot:
1. **MA Calculation:** A standard moving average (e.g., EMA, SMA) is calculated for the specified source, symbol, and timeframe.
2. **Volatility-Normalized Distance:** It first measures the deviation of price from its moving average in terms
of Average True Range (ATR) units. This volatility-normalization step is crucial for comparing trend strength
across different timeframes or instruments, as it measures distance in a context-aware manner.
3. **Magnitude Squashing:** This ATR-based distance is then passed through a hyperbolic tangent (`tanh`) squashing
function. This elegantly transforms the potentially unbounded measurement into a standardized score oscillating
between -1 (maximum bearish magnitude) and +1 (maximum bullish magnitude). This prevents extreme outliers in one
timeframe from disproportionately skewing the final result.
4. **Weighted Aggregation:** Each of these normalized (-1 to +1) scores is then combined based on a user-defined
weight. The weighted average of all enabled slots produces the final composite score.
5. **Final Scaling & Smoothing:** The composite score is scaled to oscillate between -100 and +100. An optional
final smoothing pass can be applied to this master line to reduce noise and clarify the overall trend.
All higher-timeframe calculations are performed correctly within their native context to ensure the indicator is
non-repainting and provides a stable, reliable output on the chart.
--- KEY FEATURES ---
• **Five Independent Analysis Slots:** Fully customize up to five sources, each with its own symbol, timeframe, MA type, period, and weight.
• **Advanced Normalization:** Utilizes ATR and the hyperbolic tangent function for robust, comparable trend magnitude scores.
• **Correct MTF Calculation:** Employs best practices for non-repainting data requests, ensuring historical and real-time results are consistent.
• **Weighted Composite Score:** Assign importance to different timeframes to tailor the oscillator to your specific analytical needs.
• **Optional Master Smoothing:** Apply a final MA to the composite score line for enhanced clarity and signal filtering.
• **Clear Visualization:** A simple, color-coded oscillator line shows the final trend score, while individual component trends can also be plotted.
--- HOW TO INTERPRET ---
• **Zero Line Cross:** A cross above 0 indicates that the weighted balance of trend components has shifted to bullish. A cross below 0 signals a shift to bearish.
• **Oscillator Magnitude:** Values approaching +100 suggest a strong, broad-based uptrend consensus. Values nearing -100 indicate a strong downtrend consensus.
• **Slope:** The slope of the oscillator line indicates the accelerating or decelerating nature of the aggregate trend momentum.
• **Divergence:** As with any oscillator, watch for divergences between price action and the oscillator, which can signal a potential exhaustion of the prevailing trend.
Author: Aquaritek
——————————————————————————————————————————————————————————

Aqua MTF Stochastic Oscillator——————————————————————————————————————————————————————————
The Aqua Multi-Timeframe (MTF) Stochastic Oscillator is a comprehensive momentum analysis tool that synthesizes
stochastic data from up to five distinct, user-configurable sources and timeframes into a single, unified view.
--- CORE CONCEPT ---
Traditional oscillators provide insight into one specific timeframe. This indicator overcomes that limitation by
aggregating momentum readings from multiple timeframes. The core principle is to gauge the confluence of momentum
across different market cycles. A strong trend is often characterized by aligned momentum across short-term,
medium-term, and long-term perspectives. This tool visualizes that alignment in a clear, intuitive oscillator.
--- METHODOLOGY ---
For each of the five analysis slots, the script calculates the Stochastic %K line and its corresponding %D signal line.
To allow for direct comparison and weighting, each of these standard 0-100 oscillator values is then normalized
to a bipolar scale of -100 to +100, where 0 represents the neutral midline.
These normalized scores are then blended, according to user-defined weights, into two master composite lines:
1. A master "Score Line" representing the weighted average of the raw %K momentum values.
2. A master "Signal Line" representing the weighted average of the smoothed %D signal values.
--- KEY FEATURES ---
• Multi-Timeframe & Multi-Symbol Analysis: Configure up to five slots, each with its own symbol, timeframe, price source, and stochastic settings.
• Normalized Momentum Scale: All stochastic values are re-scaled to a -100 to +100 range, providing a standardized measure of momentum. Values above 0 indicate bullish momentum, while values below 0 indicate bearish momentum.
• Weighted Composite Score: User-defined weights allow for prioritizing certain timeframes, creating a custom-tailored final momentum reading.
• Dynamic Color-Coding: The color of the master Score Line and each individual timeframe's line instantly changes based on its position relative to its signal line (%K vs. %D). This provides immediate visual feedback on momentum acceleration (bullish) or deceleration (bearish).
--- HOW TO INTERPRET ---
• Crossovers: The interaction between the master Score Line and the Signal Line can be used to identify potential shifts in momentum, similar to a traditional MACD.
• Line Color: The color of the master Score Line itself serves as a primary signal. A bullish color indicates that overall raw momentum is leading smoothed momentum, and vice-versa.
• Overbought/Oversold Levels: Extreme readings near the +100 or -100 levels suggest that the aggregated momentum may be overextended and due for a reversion.
• Zero Line Crosses: When the oscillator crosses above the zero line, it signals that the balance of momentum has shifted to positive territory. A cross below zero signals a shift to negative territory.
• Divergence: Look for divergences where price makes a new high or low, but the oscillator fails to confirm it. This can often signal a pending reversal.
Author: Aquaritek
——————————————————————————————————————————————————————————

Multi-Timeframe 20 EMA Horizontal LinesOverview
This Multi-Timeframe 20 EMA indicator provides intelligent trend analysis by displaying your current timeframe EMA alongside relevant higher timeframe EMA levels as horizontal support/resistance lines. On lower timeframes, you see all higher EMA levels for comprehensive multi-timeframe confluence, while on higher timeframes, it filters out lower timeframe noise to maintain focus on macro trends. This allows traders to align short-term entries with long-term market structure, identifying high-probability setups where multiple timeframe EMAs converge while using the current timeframe EMA for precise timing.
Feature
Multi-Timeframe Horizontal EMA Lines
The indicator fetches and displays 20 EMAs from five higher timeframes:
Daily (D): Daily 20 EMA
Weekly (W): Weekly 20 EMA
Monthly (M): Monthly 20 EMA
Quarterly (Q): 3-Month 20 EMA
Half-Yearly (HY): 6-Month 20 EMA
Intelligent Timeframe Filtering
Smart Display Logic: Only shows EMAs from timeframes higher than your current chart timeframe
Prevents Redundancy: Automatically filters out lower timeframe EMAs to avoid clutter
Example: On a 4-hour chart, you'll see Daily, Weekly, Monthly, Quarterly, and Half-Yearly EMAs, but on a Weekly chart, you'll only see Weekly and higher timeframes
Half-Yearly (HY): 6-Month 20 EMA
Shows only current timeframe EMA with half-yearly horizontal line, filtering out all lower timeframes.
Quarterly (Q): 3-Month 20 EMA
Displays current timeframe EMA with quarterly and higher horizontal lines, hiding monthly, weekly, and daily EMAs.
Monthly (M): Monthly 20 EMA
Shows current timeframe EMA with monthly and higher horizontal EMAs, excluding weekly and daily timeframes.
Weekly (W): Weekly 20 EMA
Displays current timeframe EMA with weekly and higher horizontal EMA lines, filtering out daily timeframe.
Daily (D):
Shows current timeframe EMA with all higher timeframe horizontal EMAs (daily, weekly, monthly, quarterly, half-yearly).
Note: Make sure to enable Price-Line in Style Settings after Importing Script.

Gann Swing PointsIndicator Logic
This is a GANN-style swing indicator that classifies bars based on their high/low structure relative to the previous bar.
I strongly encourage you to replay bars on Tradingview using this indicator to get a sense of how it creates pivot (or swing) points
Bar Classification:
Up-Bar (direction: 'up'): Higher High and Higher Low (HH/HL)
Down-Bar (direction: 'down'): Lower High and Lower Low (LH/LL)
Outside-Bar (generates 2 directions):
Green: 'down' then 'up'
Red: 'up' then 'down'
Inside-Bar: No direction generated (HL/LH)
Swing Line Logic
The swing line continues in the current direction until n opposite directions are detected.
n is the "n-direction" parameter (commonly set to 2, so 2 consecutive opposite direction is needed to turn the swing)
When n opposing directions occur, the swing turns, creating a pivot point
Inside bar is ignored, so e.g up-bar -> inside-bar -> up-bar generates "up", "up" direction
A top pivot is formed when the swing turns down
A bottom pivot is formed when it turns up
Note: This swing logic is inherently lagging — it only confirms tops/bottoms after the fact
This swing structure gives the system a clear and noise-resistant way to identify pivot points (swing-points)

HTF High/Low Targets This script plots the previous Highs and Lows of the 1HR, 4HR, Daily, and Weekly timeframes.
Each level is color-coded, extends across the chart, and includes labels to help you spot key areas of past support and resistance.
Use this tool to:
- Confirm intraday price reactions at HTF zones
- Identify high-probability reversal or breakout areas
- Get notified with built-in alerts when price crosses a level
You can toggle each timeframe level on/off in the settings panel.
Great for:
- Day traders and scalpers who trade off 1-minute or 5-minute charts
-Swing traders looking for confluence with HTF zones
- Anyone using a multi-timeframe analysis approach
Created by @mychaellesliemedia.

Triple cloud📘 Tripple Cloud – Explanation and Functionality
Tripple Cloud is an advanced visualization of moving averages (EMA and MA) across the current timeframe and up to two higher timeframes (HTF1 and HTF2). It provides a fast visual overview of both local and overall trend direction.
✅ Features
🔹 1. Local Cloud (current timeframe)
EMA 13, 25, and 32 form the "cloud".
The background is automatically colored:
Green tones: Uptrend (faster EMA above slower)
Red tones: Downtrend (faster EMA below slower)
🔹 2. HTF Cloud (first higher timeframe)
Displays the same EMA cloud (13/25/32) for a higher timeframe (e.g., Daily when you're on 4H).
The background is shown in subtle green/red shades.
Optional display of EMA 50, 200 and MA 100, 300 in grayscale.
🔹 3. HTF2 Cloud (second higher timeframe)
Same principle as HTF1 – even higher level (e.g., Weekly when you're on 4H).
Visualized in gray tones, helping you spot long-term trends.
⚙️ Settings
Automatic HTF selection: The script automatically chooses suitable higher timeframes based on the current one (e.g., 1m → 5m and 1h).
Manual HTF 1 & 2: You can also manually select the higher timeframes.
Show/hide HTF clouds and EMAs: Enable or disable HTF1 and HTF2 individually.
Everything updates automatically when switching chart timeframes.
💡 Use Cases
Use Tripple Cloud to:
Spot confluence between local and higher timeframe trends
Avoid trading against major market direction
Detect early trend reversals on higher timeframes
Analyze both intraday and swing setups with clarity
