Institutional Activity AnalysisThe Institutional Activity Analysis (IAA) indicator is a powerful tool designed to help traders identify potential institutional buying and selling activity in the market. By analyzing volume, price movement, and accumulation/distribution trends, this indicator provides insights into market dynamics that may signal significant activity.
This indicator is not a buy or sell recommendation but rather a tool to assist traders in understanding market behavior. It should be used in conjunction with other technical analysis tools and strategies for a comprehensive trading approach.
Key Features:
Smart Money Flow Index (SMFI):
1). Tracks the flow of "smart money" by analyzing price action relative to volume.
2). Helps identify whether institutional activity is bullish or bearish.
Accumulation/Distribution (Acc/Dist):
1). Measures buying and selling pressure in the market.
2). Indicates whether the market is in an accumulation (buying) or distribution (selling) phase.
Volume Spike Detection:
1. Identifies unusual volume spikes that may signal institutional activity.
2. Highlights these spikes with a yellow circle on the chart.
Significant Price Movement:
1. Detects strong price movements accompanied by high volume.
2. Marks these movements with a green triangle on the chart.
Customizable Dashboard:
1. Displays key metrics such as volume flow, smart money flow, accumulation/distribution, and volatility.
2. Includes visual signals for volume spikes and significant moves.
3. The dashboard can be positioned anywhere on the chart or turned off.
Heatmap for Activity Intensity:
1. Visualizes the intensity of market activity by combining volume and price volatility.
How to Read the Indicator:
Smart Money Flow (SMFI):
1. A positive SMFI value indicates bullish institutional activity.
2. A negative SMFI value suggests bearish institutional activity.
3. The blue line on the indicator represents the smoothed SMFI.
Accumulation/Distribution (Acc/Dist):
1. A positive slope indicates accumulation (buying pressure).
2. A negative slope indicates distribution (selling pressure).
3. The purple line on the indicator shows the smoothed Acc/Dist slope.
Volume Spikes:
1. Yellow circles on the chart indicate unusual volume spikes.
2. These spikes may signal institutional interest or significant market activity.
Significant Price Movements:
1. Green triangles on the chart highlight strong price movements with high volume.
2. These movements may indicate potential breakouts or reversals.
Dashboard:
The dashboard provides a quick summary of key metrics:
1. Volume Flow: Indicates whether volume is above or below the average.
2. Smart Money: Shows whether institutional activity is bullish or bearish.
3. Acc/Dist: Displays whether the market is in accumulation or distribution.
4. Volatility: Provides the current volatility level.
5. Signals: Highlights whether there are volume spikes or significant moves.
How to Use the Indicator:
Identify Institutional Activity:
1. Look for confluences between volume spikes, significant price movements, and the direction of the SMFI and Acc/Dist slope.
2. For example, a volume spike combined with a positive SMFI and accumulation may indicate bullish institutional activity.
Confirm Market Trends:
1. Use the indicator to confirm trends by analyzing the direction of the SMFI and Acc/Dist slope.
2. A rising SMFI and positive Acc/Dist slope suggest a strong uptrend, while the opposite indicates a downtrend.
Monitor Volatility:
1. High volatility combined with volume spikes may signal potential breakouts or reversals.
2. Use the volatility metric on the dashboard to gauge market conditions.
Set Alerts:
1. Use the built-in alert conditions to get notified of volume spikes and significant price movements.
2. Alerts can help you stay informed about potential market opportunities.
Important Notes:
1. This is not a buy or sell recommendation. The IAA indicator is a technical analysis tool designed to provide insights into market activity. Always use it in conjunction with other tools and strategies.
2. The indicator works best when combined with other forms of analysis, such as support/resistance levels, trendlines, and candlestick patterns.
3. Past performance is not indicative of future results. Always practice proper risk management and trade responsibly.
Customization:
The indicator includes several customizable settings:
1. Volume Spike Threshold: Adjust the sensitivity for detecting volume spikes.
2. Smoothing Period: Change the period for calculating SMFI and Acc/Dist.
3. Price Movement Threshold: Modify the sensitivity for detecting significant price movements.
4. Dashboard Position: Move the dashboard to any corner of the chart or turn it off.
5. Visual Settings: Customize the colors and transparency of the dashboard and signals.
Example Use Case:
Imagine you're analyzing a stock that has been consolidating for several days. Suddenly, the IAA indicator detects:
1. A volume spike (yellow circle),
2. A significant price movement (green triangle),
3. A positive SMFI (bullish smart money flow),
4. And an accumulation phase (positive Acc/Dist slope).
This confluence of signals may indicate that institutional buyers are entering the market, potentially leading to a breakout. You can then use this information to plan your trade, such as setting alerts or monitoring for confirmation from other indicators.
Disclaimer:
The Institutional Activity Analysis (IAA) indicator is for educational and informational purposes only. It is not financial advice or a recommendation to buy or sell any security. Always conduct your own research and consult with a financial advisor before making trading decisions. Use this tool responsibly and at your own risk.
Suporte e Resistência

Smarter Money Concepts - FVGs [PhenLabs]📊 Smarter Money Concepts - FVGs
Version: PineScript™ v6
📌 Description
Smarter Money Concepts - FVGs is a sophisticated indicator designed to identify and track Fair Value Gaps (FVGs) in price action. These gaps represent market inefficiencies where price moves quickly, creating imbalances that often attract subsequent price action for mitigation. By highlighting these key areas, traders can identify potential zones for reversals, continuations, and price targets.
The indicator employs volume filtering ideology to highlight only the most significant FVGs, reducing noise and focusing on gaps formed during periods of higher relative volume. This combination of price structure analysis and volume confirmation provides traders with high-probability areas of interest that institutional smart money may target during future price movements.
🚀 Points of Innovation
Volume-Filtered Gap Detection : Eliminates low-significance FVGs by requiring a minimum volume threshold, focusing only on gaps formed with institutional participation
Equilibrium Line Visualization : Displays the midpoint of each gap as a potential precision target for trades
Automated Gap Mitigation Tracking : Monitors when price revisits and mitigates gaps, automatically managing visual elements
Time-Based Gap Management : Intelligently filters gaps based on a configurable timeframe, maintaining chart clarity
Dual Direction Analysis : Simultaneously tracks both bullish and bearish gaps, providing a complete market structure view
Memory-Optimized Design : Implements efficient memory management for smooth chart performance even with numerous FVGs
🔧 Core Components
Fair Value Gap Detection : Identifies price inefficiencies where the current candle’s low is higher than the previous candle’s high (bearish FVG) or where the current candle’s high is lower than the previous candle’s low (bullish FVG).
Volume Filtering Mechanism : Calculates relative volume compared to a moving average to qualify only gaps formed during significant market activity.
Mitigation Tracking : Continuously monitors price action to detect when gaps get filled, with options to either hide or maintain visual representation of mitigated gaps.
🔥 Key Features
Customizable Gap Display : Toggle visibility of bullish and bearish gaps independently to focus on your preferred market direction
Volume Threshold Control : Adjust the minimum volume ratio required for gap qualification, allowing fine-tuning between sensitivity and significance
Flexible Mitigation Methods : Choose between “Wick” or “Close” methods for determining when a gap has been mitigated, adapting to different trading styles
Visual Customization : Full control over colors, transparency, and style of gap boxes and equilibrium lines
🎨 Visualization
Gap Boxes : Rectangular highlights showing the exact price range of each Fair Value Gap. Bullish gaps indicate potential upward price targets, while bearish gaps show potential downward targets.
Equilibrium Lines : Dotted lines running through the center of each gap, representing the mathematical midpoint that often serves as a precision target for price movement.
📖 Usage Guidelines
General Settings
Days to Analyze : Default: 15, Range: 1-100. Controls how many days of historical gaps to display, balancing between comprehensive analysis and chart clarity
Visual Settings
Bull Color : Default:(#596fd33f). Color for bullish Fair Value Gaps, typically using high transparency for clear chart visibility
Bear Color : Default:(#d3454575). Color for bearish Fair Value Gaps, typically using high transparency for clear chart visibility
Equilibrium Line : Default: Enabled. Toggles visibility of the center equilibrium line for each FVG
Eq. Line Color : Default: Black with 99% transparency. Sets the color of equilibrium lines, usually kept subtle to avoid chart clutter
Eq. Line Style : Default: Dotted, Options: Dotted, Solid, Dashed. Determines the line style for equilibrium lines
Mitigation Settings
Mitigation Method : Default: Wick, Options: Wick, Close. Determines how gap mitigation is calculated - “Wick” uses high/low values while “Close” uses open/close values for more conservative mitigation criteria
Hide Mitigated : Default: Enabled. When enabled, gaps become transparent once mitigated, reducing visual clutter while maintaining historical context
Volume Filter
Volume Filter : Default: Enabled. When enabled, only shows gaps formed with significant volume relative to recent average
Min Ratio : Default: 1.5, Range: 0.1-10.0. Minimum volume ratio compared to average required to display an FVG; higher values filter out more gaps
Periods : Default: 15, Range: 5-50. Number of periods used to calculate the average volume baseline
✅ Best Use Cases
Identifying potential reversal zones where price may react after extended moves
Finding precise targets for take-profit placement in trend-following strategies
Detecting institutional interest areas for potential breakout or breakdown confirmations
Plotting significant support and resistance zones based on structural imbalances
Developing fade strategies at key market structure points
Confirming trade entries when price approaches significant unfilled gaps
⚠️ Limitations
Works best on higher timeframes where gaps reflect more significant market inefficiencies
Very choppy or ranging markets may produce small gaps with limited predictive value
Volume filtering depends on accurate volume data, which may be less reliable for some symbols
Performance may be affected when displaying a very large number of historical gaps
Some gaps may never be fully mitigated, particularly in strongly trending markets
💡 What Makes This Unique
Volume Intelligence : Unlike basic FVG indicators, this script incorporates volume analysis to identify the most significant structural imbalances, focusing on quality over quantity.
Visual Clarity Management : Automatic handling of mitigated gaps and memory management ensures your chart remains clean and informative even over extended analysis periods.
Dual-Direction Comprehensive Analysis : Simultaneously tracks both bullish and bearish gaps, providing a complete market structure picture rather than forcing a directional bias.
🔬 How It Works
1. Gap Detection Process :
The indicator examines each candle in relation to previous candles, identifying when a gap forms between the low of candle and high of candle (bearish FVG) or between the high of candle and low of candle (bullish FVG). This specific candle relationship identifies true structural imbalances.
2. Volume Qualification :
For each potential gap, the algorithm calculates the relative volume compared to the configured period average. Only gaps formed with volume exceeding the minimum ratio threshold are displayed, ensuring focus on institutionally significant imbalances.
3. Equilibrium Calculation :
For each qualified gap, the script calculates the precise mathematical midpoint, which becomes the equilibrium line - a key target that price often gravitates toward during mitigation attempts.
4. Mitigation Tracking :
The indicator continuously monitors price action against existing gaps, determining mitigation based on the selected method (wick or close). When price reaches the equilibrium point, the gap is considered mitigated and can be visually updated accordingly.
💡 Note:
Fair Value Gaps represent market inefficiencies that often, but not always, get filled. Use this indicator as part of a complete trading strategy rather than as a standalone system. The most valuable signals typically come from combining FVG analysis with other confirmatory indicators and overall market context. For optimal results, start with the default settings and gradually adjust parameters to match your specific trading timeframe and style.

Opal Title: Opal Lines
Short Title: Opal Lines
Description:
Opal Lines is a dynamic overlay indicator that plots horizontal price levels at the open of key market sessions throughout the trading day, based on Eastern Time (ET). Designed for traders who rely on session-based price action, it marks significant intraday events such as the European Open (3:00 AM ET), Gold Open (8:20 AM ET), Regular Market Open (9:30 AM ET), and Globex Open (6:00 PM ET), among others. Each line is color-coded and toggleable via inputs, allowing users to customize which sessions they want to track.
Unlike generic time-based tools, Opal Lines captures the opening price at precise minute intervals and extends these levels across the chart until the daily reset at 5:00 PM ET (except for the Globex line, which persists into the next day). This makes it ideal for identifying support/resistance zones, breakout levels, or reference points tied to major market openings. Traders can use it across forex, futures, equities, or commodities to align their strategies with global session dynamics.
Key Features:
Seven toggleable session lines with distinct colors for easy identification.
Time-specific logic using ET, adaptable to any chart timeframe.
Persistent lines that reset daily, with Globex extending overnight.
Lightweight and overlay-friendly, preserving chart clarity.
How to Use:
Add the indicator to your chart and enable the sessions relevant to your trading style. Watch for price interactions with these levels—e.g., bounces, breaks, or retests—especially during high-volume periods. Combine with other tools like volume or oscillators for confirmation.
Note: Ensure your chart’s timezone is set to “America/New_York” (ET) for accurate alignment.

Linear Regression Volume Profile [ChartPrime]LR VolumeProfile
This indicator combines a Linear Regression channel with a dynamic volume profile, giving traders a powerful way to visualize both directional price movement and volume concentration along the trend.
⯁ KEY FEATURES
Linear Regression Channel: Draws a statistically fitted channel to track the market trend over a defined period.
Volume Profile Overlay: Splits the channel into multiple horizontal levels and calculates volume traded within each level.
Percentage-Based Labels: Displays each level's share of total volume as a percentage, offering a clean way to see high and low volume zones.
Gradient Bars: Profile bars are colored using a gradient scale from yellow (low volume) to red (high volume), making it easy to identify key interest areas.
Adjustable Profile Width and Resolution: Users can change the width of profile bars and spacing between levels.
Channel Direction Indicator: An arrow inside a floating label shows the direction (up or down) of the current linear regression slope.
Level Style Customization: Choose from solid, dashed, or dotted lines for visual preference.
⯁ HOW TO USE
Use the Linear Regression channel to determine the dominant price trend direction.
Analyze the volume bars to spot key levels where the majority of volume was traded—these act as potential support/resistance zones.
Pay attention to the largest profile bars—these often mark zones of institutional interest or price consolidation.
The arrow label helps quickly assess whether the trend is upward or downward.
Combine this tool with price action or momentum indicators to build high-confidence trading setups.
⯁ CONCLUSION
LR Volume Profile is a precision tool for traders who want to merge trend analysis with volume insight. By integrating linear regression trendlines with a clean and readable volume distribution, this indicator helps traders find price levels that matter the most—backed by volume, trend, and structure. Whether you're spotting high-volume nodes or gauging directional flow, this toolkit elevates your decision-making process with clarity and depth.

Psych Level ScreenerThis Script is intended for Pine Screener and is not designed as a indicator!!!
Pine Screener is something TradingView has recently added and is still only a Beta version.
Pine Screener itself is currently only available to members that are Premium and above.
What it does:
This screener will actively look for tickers that are close to Pysch level in your watchlist.
Psych level here refers to price levels that are round numbers such as 50,100,1000.
Users can specify the offset from a psych level (in %) and scanner will scan for tickers that are within the offset. For example if offset is set at 5% then it will scan for tickers that are within +/-5% of a ticker. (for $100 psych level it will scan for ticker in $95-105 range)
Once scan is completed you will be able to see:
- Current price of ticker
- Closest psych level for that ticker
- % and $ move required for it to hit that psych level
- Ticker's day range and Average range (with % of average range completed for the day)
- Ticker volume and average volume
Setting up:
www.tradingview.com
Above link will help you guide how to setup Pine screener.
Use steps below to guide you the setup for this specific screener:
1. Open Pine Screener (open new tab, select screener the "Pine")
2. At the top, click on "Choose Indicator" and select "Psych Level Screener"
3. At the top again, click "Indicator Psych Level Screener" and select settings.
4. Change setting to your needs. Hit Apply when done.
a)"% offset from Psych Level" will scan for any stocks in your watchlist which are +/- from the offset you chose for any given psych level. Default is 5. (e.g. If offset is 5%, it will scan for stocks that are between $95-$105 vs $100 psych level, $190-$210 for $200 psych level and so on)
b) ATR length is number of previous trading days you want to include in your calculation. Moving Average Type is calculation method.
c) Rvol length is number of previous trading days you want to include in your calculation.
5. On top left, click "Price within specified offset of Psych. Level" and select true. Then select "Scan" which is located at the top next to "Indicator Psych Level Screener". This will filter out all the stock that meets the condition.
6. At the end of the column on the right there is a "+" symbol. From there you can add/remove columns. 30min/1hr/4hr/1D Trend are disabled by default so if this is needed please enable them.
7. You can change the order of ticker by ascending and descending order of each column label if needed. Just click on the arrow that comes up when you move the cursor to any of the column items.
8. You can specify advanced filter settings based on the variables in the column. (e.g., set price range of stock to filter out further) To do so, click on the column variable name in interest, located above the screener table (or right below "scan") and select "manual setup".
How to read the column:
Current Price: Shows current price of the ticker when scan was done. Currently Pine Screener does NOT support pre/post-hours data so no PM and AH price.
Psych Level: Psych level the current price is near to.
% to Psych Level: Price movement in % necessary to get to the Psych level.
$ to Psych Level: Price movement in $ necessary to get to the Psych level.
DTR: Daily True Range of the stock. i.e. High - Low of the ticker on the day.
ATR: Average True Range of stock in the last x days, where x is a value selected in the setting. (See step 3 in Previous section)
DTR vs ATR: Amount of DTR a ticker has done in % with respect to ATR. (e.g., 90% means DTR is 90% of ATR)
Vol.: Volume of a ticker for the day. Currently Pine Screener does NOT support pre/post-hours data so no PM and AH volume.
Avg. Vol: Average volume of a ticker in the last x days, where x is a value selected in the setting. (See step 3 in Previous section)
Rvol: Relative volume in percentage, measured by the ratio of day's volume and average volume.
30min/1hr/4hr/1D Trend: Trend status to see if the chart is Bullish or Bearish on each of the time frame. Bullishness or Bearishness is defined by the price being over or under the 34/50 cloud on each of the time frame. Output of 1 is Bullish, -1 is Bearish. 0 means price is sitting inside the 34/50 cloud. Currently Pine Screener does NOT support pre/post-hours data so 34/50 cloud is based on regular trading hours data ONLY.
Some things user should be aware of:
- Pine Screener itself is currently only available to TradingView members with Premium Subscription and above. (I can't to anything about this as this is NOT set by me, I have no control) For more info: www.tradingview.com
- The Pine Screener itself is a Beta version and this screener can stop working anytime depending on changes made by TradingView themselves. (Again I cannot control this)
- Pine Screener can only run on Watchlists for now. (as of 03/31/2025) You will have to prepare your own watchlists. In a Watchlist no more than 1000 tickers may be added. (This is TradingView rules)
- Psych level included are currently 50 to 1500 in steps of 50. If you need a specific number please let me know. Will add accordingly.
- Unfortunately this screener does not update automatically, so please hit "scan" to get latest screener result.
- I cannot add 10min trend to the column as Pine Screener does NOT support 10min timeframe as of now. (03/31/2025)
- This code is only meant for Pine Screener. I do NOT recommend using this as an indicator.
- Currently Pine Screener does NOT support pre/post-hours data. So data such as Price, Volume and EMA values are based on market hours data ONLY! (If I'm wrong about this please correct me / let me know and will make look into and make changes to the code)
Other useful links about Pine Screener:
Quick overview of the Screener’s functionality: www.tradingview.com
what do you need to know before you start working? : www.tradingview.com
These links will go over the setting up with GIFs so is easier to understand.
-----------------------------------------------------------------------------------------------------------------
If there are other column variables that you think is worth adding please let me know! Will try add it to the screener!
If you have any questions let me know as well, will reply soon as I can!
Have a good trading day and hope it helps!

Auto TrendLines [TradingFinder] Support Resistance Signal Alerts🔵 Introduction
The trendline is one of the most essential tools in technical analysis, widely used in financial markets such as Forex, cryptocurrency, and stocks. A trendline is a straight line that connects swing highs or swing lows and visually indicates the market’s trend direction.
Traders use trendlines to identify price structure, the strength of buyers and sellers, dynamic support and resistance zones, and optimal entry and exit points.
In technical analysis, trendlines are typically classified into three categories: uptrend lines (drawn by connecting higher lows), downtrend lines (formed by connecting lower highs), and sideways trends (moving horizontally). A valid trendline usually requires at least three confirmed touchpoints to be considered reliable for trading decisions.
Trendlines can serve as the foundation for a variety of trading strategies, such as the trendline bounce strategy, valid breakout setups, and confluence-based analysis with other tools like candlestick patterns, divergences, moving averages, and Fibonacci levels.
Additionally, trendlines are categorized into internal and external, and further into major and minor levels, each serving unique roles in market structure analysis.
🔵 How to Use
Trendlines are a key component in technical analysis, used to identify market direction, define dynamic support and resistance zones, highlight strategic entry and exit points, and manage risk. For a trendline to be reliable, it must be drawn based on structural principles—not by simply connecting two arbitrary points.
🟣 Selecting Pivot Types Based on Trend Direction
The first step is to determine the market trend: uptrend, downtrend, or sideways.
Then, choose pivot points that match the trend type :
In an uptrend, trendlines are drawn by connecting low pivots, especially higher lows.
In a downtrend, trendlines are formed by connecting high pivots, specifically lower highs.
It is crucial to connect pivots of the same type and structure to ensure the trendline is valid and analytically sound.
🟣 Pivot Classification
This indicator automatically classifies pivot points into two categories :
Major Pivots :
MLL : Major Lower Low
MHL : Major Higher Low
MHH : Major Higher High
MLH : Major Lower High
These define the primary structure of the market and are typically used in broader structural analysis.
Minor Pivots :
mLL: minor Lower Low
mHL: minor Higher Low
mHH: minor Higher High
mLH: minor Lower High
These are used for drawing more precise trendlines within corrective waves or internal price movements.
Example : In a downtrend, drawing a trendline from an MHH to an mHH creates structural inconsistency and introduces noise. Instead, connect points like MHL to MHL or mLH to mLH for a valid trendline.
🟣 Drawing High-Precision Trendlines
To ensure a reliable trendline :
Use pivots of the same classification (Major with Major or Minor with Minor).
Ensure at least three valid contact points (three touches = structural confirmation).
Draw through candles with the least deviation (choose wicks or bodies based on confluence).
Preferably draw from right to left for better alignment with current market behavior.
Use parallel lines to turn a single trendline into a trendline zone, if needed.
🟣 Using Trendlines for Trade Entries
Bounce Entry: When price approaches the trendline and shows signs of reversal (e.g., a reversal candle, divergence, or support/resistance), enter in the direction of the trend with a logical stop-loss.
Breakout Entry: When price breaks through the trendline with strong momentum and a confirmation (such as a retest or break of structure), consider trading in the direction of the breakout.
🟣 Trendline-Based Risk Management
For bounce entries, the stop-loss is placed below the trendline or the last pivot low (in an uptrend).
For breakout entries, the stop-loss is set behind the breakout candle or the last structural level.
A broken trendline can also act as an exit signal from a trade.
🟣 Combining Trendlines with Other Tools (Confluence)
Trendlines gain much more strength when used alongside other analytical tools :
Horizontal support and resistance levels
Moving averages (such as EMA 50 or EMA 200)
Fibonacci retracement zones
Candlestick patterns (e.g., Engulfing, Pin Bar)
RSI or MACD divergences
Market structure breaks (BoS / ChoCH)
🔵 Settings
Pivot Period : This defines how sensitive the pivot detection is. A higher number means the algorithm will identify more significant pivot points, resulting in longer-term trendlines.
Alerts
Alert :
Enable or disable the entire alert system
Set a custom alert name
Choose how often alerts trigger (every time, once per bar, or on bar close)
Select the time zone for alert timestamps (e.g., UTC)
Each trendline type supports two alert types :
Break Alert : Triggered when price breaks the trendline
React Alert : Triggered when price reacts or bounces off the trendline
These alerts can be independently enabled or disabled for all trendline categories (Major/Minor, Internal/External, Up/Down).
Display :
For each of the eight trendline types, you can control :
Whether to show or hide the line
Whether to delete the previous line when a new one is drawn
Color, line style (solid, dashed, dotted), extension direction (e.g., right only), and width
Major lines are typically thicker and more opaque, while minor lines appear thinner and more transparent.
All settings are designed to give the user full control over the appearance, behavior, and alert system of the indicator, without requiring manual drawing or adjustments.
🔵 Conclusion
A trendline is more than just a line on the chart—it is a structural, strategic, and flexible tool in technical analysis that can serve as the foundation for understanding price behavior and making trading decisions. Whether in trending markets or during corrections, trendlines help traders identify market direction, key zones, and high-potential entry and exit points with precision.
The accuracy and effectiveness of a trendline depend on using structurally valid pivot points and adhering to proper market logic, rather than relying on guesswork or personal bias.
This indicator is built to solve that exact problem. It automatically detects and draws multiple types of trendlines based on actual price structure, separating them into Major/Minor and Internal/External categories, and respecting professional analytical principles such as pivot type, trend direction, and structural location.

Daily ProtractorDaily Protractor Indicator
Overview
The Daily Protractor is a visually intuitive tool designed for traders who want to analyze price action through angular measurements on a 5-minute chart. By overlaying a protractor on the chart, this indicator helps identify potential support, resistance, and trend directions based on angular relationships from the first 5-minute candle of each day. It’s particularly useful for intraday traders looking to incorporate geometric analysis into their strategies for spot or strike charts.
Key Features
Dynamic Protractor Overlay: Draws a protractor centered on the low of the first 5-minute candle of each day, with customizable radius in both bars (horizontal) and price units (vertical).
Angular Measurements: Displays angles in 5-degree increments, covering a full 360° circle or a 105° to -105° (91° to 269°) half-circle, depending on user preference.
Customizable Display:
Adjust the number of days to display protractors (up to 5 days).
Customize line colors for different angle ranges (0° to 180°, 180° to 360°, and 0° specifically).
Modify line thickness, label size, and label colors for better visibility.
Center Point Highlight: Marks the center of each protractor with a labeled point for easy reference.
Efficient Design:
Optimized with max_lines_count, max_labels_count, and max_bars_back to ensure smooth performance on TradingView.
How It Works
The indicator identifies the first 5-minute candle of each day and uses its low price as the center point for a protractor. It then draws lines at 5-degree intervals, radiating from the center, with each line representing an angle from 0° to 360°. Labels at the end of each line display the angle in degrees, with negative values shown for angles between 195° and 345° (e.g., 270° is displayed as -90°). The protractor’s radius can be adjusted in both time (bars) and price units, allowing traders to scale the tool to their chart’s characteristics.
Usage Instructions
Add to Chart:
Apply the indicator to a 5-minute chart of your chosen instrument (e.g., spot or strike charts).
Interpret the Protractor:
Use the angular lines to identify potential price levels or trend directions.
The 0° line (horizontal) can act as a reference for horizontal support/resistance.
Angles between 0° and 180° (upper half) and 180° and 360° (lower half) are color-coded for quick identification.
Customize Settings:
Toggle the Show 105° to -105° option to display a half-circle (91° to 269°) instead of a full 360° protractor.
Adjust the Radius in Bars and Radius in Price Units to scale the protractor to your chart.
Set the Maximum Days to Display to control how many daily protractors are shown.
Modify line thickness, colors, and label settings to suit your visual preferences.
Customization Options
Protractor Settings:
Show 105° to -105° (91° to 269°): Toggle between a full circle or a half-circle protractor.
Radius in Bars: Set the horizontal span of the protractor (default: 75 bars).
Radius in Price Units: Set the vertical span in price units (default: 1000.0).
Maximum Days to Display: Limit the number of protractors shown (default: 5 days).
Line Settings:
Line Thickness: Adjust the thickness of the protractor lines (1 or 2).
Line Color (0° to 180°): Color for the upper half (default: light blue).
Line Color (180° to 360°): Color for the lower half (default: light red).
Line Color (0°): Color for the 0° line (default: black).
Label Settings:
Label Size: Choose between small, normal, or large labels.
Label Color (0° to 180°): Color for labels in the upper half (default: red).
Label Color (180° to 360°): Color for labels in the lower half (default: green).
Notes
The indicator was designed with the help of Grok3 for use on 5-minute charts only, as it relies on the first 5-minute candle of the day to set the protractor’s center.
For best results, adjust the radius settings to match the volatility and price scale of your instrument. However, where the price is in single digits it is advised to switch off the labels or I would suggest not to use the same.
The protractor can be used alongside other technical tools to confirm trends, reversals, or key price levels.
Limitations: This cannot be used on instruments that trade for more than 75 candles with a timeframe of 5 minutes as the angles would not cover the entire trading window. I am working coming up with a script to address this limitation.
Feedback
I’d love to hear your thoughts! If you find the Daily Protractor helpful or have suggestions for improvements, please leave a comment or reach out. Happy trading!

Custom Gold Pivot LevelsThis indicator plots custom resistance and support levels based on a central Ziro Pivot Level. The levels are adjusted dynamically based on whether you're preparing for a Buy or Sell trade. The script allows you to set percentage-based levels for both resistance and support, making it a versatile tool for traders.
Features:
Pivot Level: Set the central pivot level (Ziro Pivot) around which resistance and support levels are calculated.
Dynamic Resistance & Support Levels: Input your preferred percentages for Resistance 1, Resistance 2, Support 1 , and Support 2 .
For Buy: Resistance levels are higher, and support levels are lower.
For Sell: Resistance levels are adjusted lower, and support levels are adjusted higher.
Label Display: The indicator will display a Buy label in green above the pivot level or a Sell label in red below the pivot level, depending on the trade type you select.
Adjustable Parameters:
Ziro Pivot Level: Set the central pivot level.
Resistance & Support Levels: Adjust resistance and support levels using percentages.
Trade Type: Choose between "Buy" and "Sell" to dynamically adjust resistance and support levels.
Inputs:
1- Trade Type: Select between Buy or Sell to set the relevant resistance and support levels.
Ziro Pivot Level: Set the main pivot level around which all other levels are calculated.
Resistance Level 1 & 2: Input percentages for Resistance 1 and Resistance 2.
Support Level 1 & 2: Input percentages for Support 1 and Support 2.
How to Use:
1- Select "Buy" or "Sell" from the input options.
For Buy: The indicator will plot higher resistance levels and lower support levels.
For Sell: The indicator will plot lower resistance levels and higher support levels.
2- Adjust the Pivot Level: Set the central pivot level for the levels to be calculated around.
3- Adjust the Resistance & Support Percentages: Modify the resistance and support levels to fit your trading strategy.
4- Visual Feedback: The indicator will show a Buy label in green above the pivot level or a Sell label in red below the pivot level, making it easy to identify the trade direction at a glance.
Use Cases:
Gold & Commodity Trading: This tool is particularly useful for traders working with commodities like gold, where pivot levels can help determine potential price action points.
Swing & Day Trading: The dynamic nature of this indicator makes it great for both swing and day traders who want to monitor short-term market movements.
Support and Resistance Strategy: Traders who rely on support and resistance levels to make buy/sell decisions can use this indicator to automate and visualize these levels more effectively.

Low Liquidity Zones [PhenLabs]📊 Low Liquidity Zones
Version: PineScript™ v6
📌 Description
Low Liquidity Zones identifies and highlights periods of unusually low trading volume on your chart, marking areas where price movement occurred with minimal participation. These zones often represent potential support and resistance levels that may be more susceptible to price breakouts or reversals when revisited with higher volume.
Unlike traditional volume analysis tools that focus on high volume spikes, this indicator specializes in detecting low liquidity areas where price moved with minimal resistance. Each zone displays its volume delta, providing insight into buying vs. selling pressure during these thin liquidity periods. This combination of low volume detection and delta analysis helps traders identify potential price inefficiencies and weak structures in the market.
🚀 Points of Innovation
• Identifies low liquidity zones that most volume indicators overlook but which often become significant technical levels
• Displays volume delta within each zone, showing net buying/selling pressure during low liquidity periods
• Dynamically adjusts to different timeframes, allowing analysis across multiple time horizons
• Filters zones by maximum size percentage to focus only on precise price levels
• Maintains historical zones until they expire based on your lookback settings, creating a cumulative map of potential support/resistance areas
🔧 Core Components
• Low Volume Detection: Identifies candles where volume falls below a specified threshold relative to recent average volume, highlighting potential liquidity gaps.
• Volume Delta Analysis: Calculates and displays the net buying/selling pressure within each low liquidity zone, providing insight into the directional bias during low participation periods.
• Dynamic Timeframe Adjustment: Automatically scales analysis periods to match your selected timeframe preference, ensuring consistent identification of low liquidity zones regardless of chart settings.
• Zone Management System: Creates, tracks, and expires low liquidity zones based on your configured settings, maintaining visual clarity on the chart.
🔥 Key Features
• Low Volume Identification: Automatically detects and highlights candles where volume falls below your specified threshold compared to the moving average.
• Volume Delta Visualization: Shows the net volume delta within each zone, providing insight into whether buyers or sellers were dominant despite the low overall volume.
• Flexible Timeframe Analysis: Analyze low liquidity zones across multiple predefined timeframes or use a custom lookback period specific to your trading style.
• Zone Size Filtering: Filters out excessively large zones to focus only on precise price levels, improving signal quality.
• Automatic Zone Expiration: Older zones are automatically removed after your specified lookback period to maintain a clean, relevant chart display.
🎨 Visualization
• Volume Delta Labels: Each zone displays its volume delta with “+” or “-” prefix and K/M suffix for easy interpretation, showing the strength and direction of pressure during the low volume period.
• Persistent Historical Mapping: Zones remain visible for your specified lookback period, creating a cumulative map of potential support and resistance levels forming under low liquidity conditions.
📖 Usage Guidelines
Analysis Timeframe
Default: 1D
Range/Options: 15M, 1HR, 3HR, 4HR, 8HR, 16HR, 1D, 3D, 5D, 1W, Custom
Description: Determines the historical period to analyze for low liquidity zones. Shorter timeframes provide more recent data while longer timeframes offer a more comprehensive view of significant zones. Use Custom option with the setting below for precise control.
Custom Period (Bars)
Default: 1000
Range: 1+
Description: Number of bars to analyze when using Custom timeframe option. Higher values show more historical zones but may impact performance.
Volume Analysis
Volume Threshold Divisor
Default: 0.5
Range: 0.1-1.0
Description: Maximum volume relative to average to identify low volume zones. Example: 0.5 means volume must be below 50% of the average to qualify as low volume. Lower values create more selective zones while higher values identify more zones.
Volume MA Length
Default: 15
Range: 1+
Description: Period length for volume moving average calculation. Shorter periods make the indicator more responsive to recent volume changes, while longer periods provide a more stable baseline.
Zone Settings
Zone Fill Color
Default: #2196F3 (80% transparency)
Description: Color and transparency of the low liquidity zones. Choose colors that stand out against your chart background without obscuring price action.
Maximum Zone Size %
Default: 0.5
Range: 0.1+
Description: Maximum allowed height of a zone as percentage of price. Larger zones are filtered out. Lower values create more precise zones focusing on tight price ranges.
Display Options
Show Volume Delta
Default: true
Description: Toggles the display of volume delta within each zone. Enabling this provides additional insight into buying vs. selling pressure during low volume periods.
Delta Text Position
Default: Right
Options: Left, Center, Right
Description: Controls the horizontal alignment of the delta text within zones. Adjust based on your chart layout for optimal readability.
✅ Best Use Cases
• Identifying potential support and resistance levels that formed during periods of thin liquidity
• Spotting price inefficiencies where larger players may have moved price with minimal volume
• Finding low-volume consolidation areas that may serve as breakout or reversal zones when revisited
• Locating potential stop-hunting zones where price moved on minimal participation
• Complementing traditional support/resistance analysis with volume context
⚠️ Limitations
• Requires volume data to function; will not work on symbols where the data provider doesn’t supply volume information
• Low volume zones don’t guarantee future support/resistance - they simply highlight potential areas of interest
• Works best on liquid instruments where volume data has meaningful fluctuations
• Historical analysis is limited by the maximum allowed box count (500) in TradingView
• Volume delta in some markets may not perfectly reflect buying vs. selling pressure due to data limitations
💡 What Makes This Unique
• Focus on Low Volume: Unlike some indicators that highlight high volume events particularly like our very own TLZ indicator, this tool specifically identifies potentially significant price zones that formed with minimal participation.
• Delta + Low Volume Integration: Combines volume delta analysis with low volume detection to reveal directional bias during thin liquidity periods.
• Flexible Lookback System: The dynamic timeframe system allows analysis across any timeframe while maintaining consistent zone identification criteria.
• Support/Resistance Zone Generation: Automatically builds a visual map of potential technical levels based on volume behavior rather than just price patterns.
🔬 How It Works
1. Volume Baseline Calculation:
The indicator calculates a moving average of volume over your specified period to establish a baseline for normal market participation. This adaptive baseline accounts for natural volume fluctuations across different market conditions.
2. Low Volume Detection:
Each candle’s volume is compared to the moving average and flagged when it falls below your threshold divisor. The indicator also filters zones by maximum size to ensure only precise price levels are highlighted.
3. Volume Delta Integration:
For each identified low volume candle, the indicator retrieves the volume delta from a lower timeframe. This delta value is formatted with appropriate scaling (K/M) and displayed within the zone.
4. Zone Management:
New zones are created and tracked in a dynamic array, with each zone extending rightward until it expires. The system automatically removes expired zones based on your lookback period to maintain a clean chart.
💡 Note:
Low liquidity zones often represent areas where price moved with minimal participation, which can indicate potential market inefficiencies. These zones frequently become important support/resistance levels when revisited, especially if approached with higher volume. Consider using this indicator alongside traditional technical analysis tools for comprehensive market context. For best results, experiment with different volume threshold settings based on the specific instrument’s typical volume patterns.

TR FVG & Swing High Low FinderTR FVG & Swing Level Finder
Overview:
The TR FVG & Swing Level Finder is a powerful Pine Script indicator designed for traders who want to identify Fair Value Gaps (FVGs) and Swing Highs/Lows on their charts. This indicator combines two essential technical analysis tools into one, helping traders spot potential areas of support, resistance, and trend reversals. FVGs are price gaps that often act as areas of interest for price to return to, while swing highs and lows help identify key turning points in the market. The indicator is highly customizable, allowing users to adjust colors, limits, and display options to suit their trading style.
Key Features:
1: Fair Value Gap (FVG) Detection:
- Identifies Bullish FVGs: Occur when the high of two candles ago is lower than the low of the current candle, indicating a potential upward price movement.
- Identifies Bearish FVGs: Occur when the low of two candles ago is higher than the high of the current candle, indicating a potential downward price movement.
- Displays FVGs as colored boxes on the chart, with customizable border and fill colors based on the timeframe.
- Labels each FVG box with the corresponding timeframe (e.g., "1m FVG", "1h FVG", "Daily FVG").
2: Swing High and Swing Low Detection:
- Detects Swing Highs: A 3-candle pattern where the middle candle's high is higher than the highs of the candles on either side.
- Detects Swing Lows: A 3-candle pattern where the middle candle's low is lower than the lows of the candles on either side.
- Draws a solid black line with 50% opacity at each swing high and low, extending 5 bars to the right for better visibility.
- Adds a small Swing High or Swing Low label at the right end of each line, colored according to user-defined settings.
3: Timeframe-Specific FVG Visualization:
- FVGs are color-coded based on the chart's timeframe, making it easy to distinguish between FVGs on different timeframes.
- Each timeframe has its own fill color for bullish and bearish FVGs, with adjustable transparency for better chart clarity.
- A dashed black line is drawn in the middle of each FVG box to highlight the midpoint of the gap.
4: Customizable Display Options:
- FVG Limit: Control the maximum number of FVGs displayed on the chart (from 1 to 20).
- Extend Options for FVG Boxes:
- "None": FVG boxes extend only 2 bars to the right.
- "Limited": FVG boxes extend a user-defined number of candles to the right (1 to 100 candles).
- "Default": FVG boxes extend 3 bars to the right of the current bar.
- Color Customization:
- Set border colors for bullish and bearish FVGs.
- Adjust fill colors for FVGs on different timeframes (1m, 5m, 15m, 30m, 1h, 4h, Daily, Weekly, Monthly).
- Customize the colors of swing high and swing low labels.
5: Performance Optimization:
- The indicator only plots FVGs and swings on the last confirmed bar (barstate.islastconfirmedhistory), ensuring efficient performance and reducing chart clutter.
- Limits the number of displayed FVGs and swings to the user-defined fvgLimit, keeping the chart clean and focused on the most recent price action.
6: Inputs and Customization:
- Number of FVGs to Show (fvgLimit): Set the maximum number of FVGs and swings to display (default: 3, range: 1 to 20).
- Bullish FVG Border Color (bullishColor): Choose the border color for bullish FVGs (default: green).
- Bearish FVG Border Color (bearishColor): Choose the border color for bearish FVGs (default: red).
- Swing High Color (swingHighColor): Set the color for swing high labels (default: blue).
- Swing Low Color (swingLowColor): Set the color for swing low labels (default: purple).
- Extend Options:
- Extend Option (extendOption): Choose how far FVG boxes extend to the right ("None", "Limited", or "Default"; default: "Default").
- Extend Candles (extendCandles): If "Limited" is selected, specify the number of candles to extend FVG boxes (default: 8, range: 1 to 100).
- Timeframe-Specific Fill Colors:
- Customize fill colors for bullish and bearish FVGs on various timeframes (1m, 5m, 15m, 30m, 1h, 4h, Daily, Weekly, Monthly).
- Each fill color has a default transparency (e.g., 93% for most timeframes, 90% for 30m), which can be adjusted as needed.
How to Use:
1: Add the Indicator to Your Chart:
- Open TradingView, go to the Pine Editor, and paste the script.
- Click "Add to Chart" to apply the indicator to your current chart.
2: Adjust Settings:
- Open the indicator settings by clicking the gear icon next to the indicator name on your chart.
- Modify the inputs to suit your preferences:
- Set the number of FVGs and swings to display.
- Choose your preferred colors for FVGs and swings.
- Adjust the extend options for FVG boxes.
3: Interpret the Indicator:
- FVG Boxes: Look for colored boxes on the chart, which represent Fair Value Gaps. Bullish FVGs (green borders by default) suggest potential buying opportunities, while bearish FVGs (red borders by default) suggest potential selling opportunities. The label inside each box indicates the timeframe of the FVG.
- Swing Highs and Lows: Identify key turning points with solid black lines (50% opacity) at swing highs and lows. Each line extends 5 bars to the right, with an "SH" (Swing High) or "SL" (Swing Low) label at the end. Swing highs can act as resistance levels, while swing lows can act as support levels.
4: Combine with Your Strategy:
- Use FVGs to identify areas where price might return to fill the gap, often acting as support or resistance.
- Use swing highs and lows to spot potential trend reversals or to set stop-loss and take-profit levels.
- Combine the indicator with other tools (e.g., trendlines, moving averages) for a more comprehensive trading strategy.
Notes:
- The indicator works on all timeframes, but the appearance of FVGs and swings will vary depending on the chart's timeframe.
- For best results, use the indicator on a clean chart to avoid visual clutter, especially if you increase the fvgLimit.
- The swing high/low lines are drawn with 50% opacity to ensure they don’t overpower other chart elements, but they are still clearly visible.
Author’s Note:
This script was developed to help traders identify key price levels with ease. I hope it adds value to your trading! If you have any feedback or suggestions for improvement, feel free to leave a comment. Happy trading!

Highest High Line with Multi-Timeframe Supertrend and RSIOverview:
This powerful indicator combines three essential elements for traders:
Highest High Line – Tracks the highest price over a customizable lookback period across different timeframes.
Multi-Timeframe Supertrend – Displays Supertrend values and trend directions for multiple timeframes simultaneously.
Relative Strength Index (RSI) – Shows RSI values across different timeframes for momentum analysis.
Features:
✅ Customizable Highest High Line:
Selectable timeframes: Daily, Weekly, Monthly, Quarterly, Yearly
Adjustable lookback period
✅ Multi-Timeframe Supertrend:
Supports 1min, 5min, 10min, 15min, 30min, 1H, Daily, Weekly, Monthly, Quarterly, Yearly
ATR-based calculation with configurable ATR period and multiplier
Identifies bullish (green) & bearish (red) trends
✅ Multi-Timeframe RSI:
Calculates RSI for the same timeframes as Supertrend
Overbought (≥70) and Oversold (≤30) signals with color coding
✅ Comprehensive Table Display:
A clean, structured table in the bottom-right corner
Displays Supertrend direction, value, and RSI for all timeframes
Helps traders quickly assess trend and momentum alignment
How to Use:
Use the Highest High Line to identify key resistance zones.
Confirm trend direction with Multi-Timeframe Supertrend.
Check RSI values to avoid overbought/oversold conditions before entering trades.
Align multiple timeframes for stronger confirmation of trend shifts.
Ideal For:
✅ Scalpers (lower timeframes: 1m–30m)
✅ Swing Traders (higher timeframes: 1H–D)
✅ Position Traders (Weekly, Monthly, Quarterly)
💡 Tip: Look for Supertrend & RSI confluence across multiple timeframes for higher probability setups.

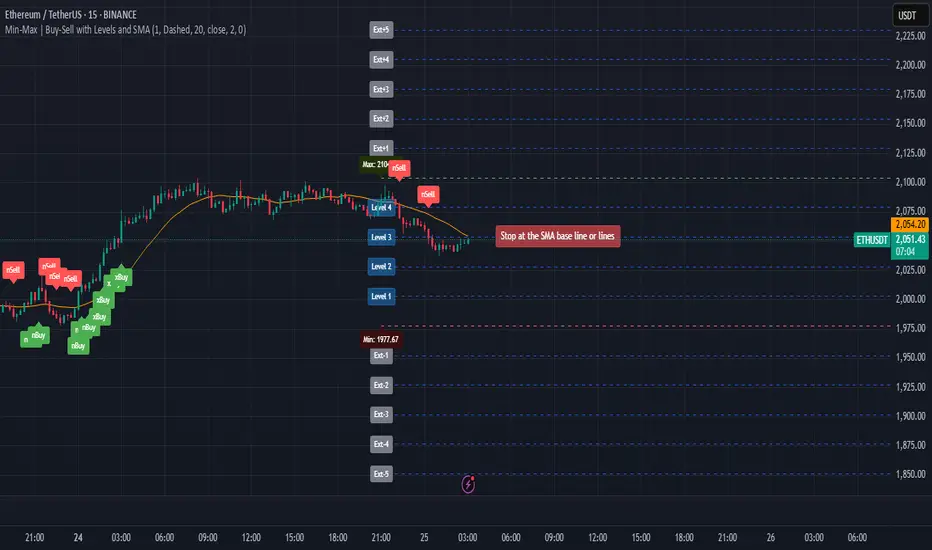
Min-Max | Buy-Sell Alert with LevelsMin-Max | Buy-Sell Alert with Levels
Description:
The Min-Max | Buy-Sell Alert with Levels indicator is a powerful tool designed to help traders identify key levels of support and resistance based on the previous day's high and low prices. It plots horizontal lines for the previous day's minimum (Min) and maximum (Max) prices, along with four intermediate levels (Stop Loss 1 to Stop Loss 4) calculated as equal percentage steps between the Min and Max.
This indicator is perfect for traders who want to:
Identify potential entry points when the price returns within the Min-Max range.
Set stop-loss levels based on the calculated intermediate levels.
Receive alerts for buy, sell, and stop-loss conditions.
Key Features:
Previous Day's Min and Max Lines:
Automatically plots the Min (red line) and Max (green line) of the previous day.
These levels act as dynamic support and resistance zones.
Intermediate Stop Loss Levels:
Calculates and plots four intermediate levels (Stop Loss 1 to Stop Loss 4) between the Min and Max.
Each level is equally spaced, representing potential stop-loss or take-profit zones.
Customizable Alerts:
Buy Alert: Triggered when the price returns within the Min-Max range after breaking below the Min.
Sell Alert: Triggered when the price returns within the Min-Max range after breaking above the Max.
Stop Loss Alerts: Triggered when the price reaches any of the four intermediate levels (Stop Loss 1 to Stop Loss 4).
Customizable Appearance:
Adjust the thickness, color, and style (solid, dashed, dotted) of the lines.
Customize the colors of the Stop Loss labels for better visualization.
Labels on the Chart:
Displays "Buy" and "Sell" labels on the chart when the respective conditions are met.
Labels for Stop Loss levels are also displayed for easy reference.
How to Use:
Add the indicator to your chart.
Customize the settings (line colors, thickness, and alert preferences) in the indicator's settings panel.
Use the Min and Max lines as dynamic support and resistance levels.
Monitor the intermediate levels (Stop Loss 1 to Stop Loss 4) for potential stop-loss or take-profit zones.
Set up alerts for Buy, Sell, and Stop Loss conditions to stay informed about key price movements.
Why Use This Indicator?
Simple and Effective: Focuses on the most important levels from the previous day.
Customizable: Tailor the indicator to match your trading style and preferences.
Alerts: Never miss a trading opportunity with customizable alerts for key conditions.
Settings:
Line Thickness: Adjust the thickness of the Min, Max, and intermediate lines.
Line Colors: Customize the colors of the Min, Max, and intermediate lines.
Line Style: Choose between solid, dashed, or dotted lines.
Stop Loss Label Colors: Customize the colors of the Stop Loss labels.
Alerts: Enable or disable alerts for Buy, Sell, and Stop Loss conditions.
Ideal For:
Day traders and swing traders.
Traders who rely on support and resistance levels.
Anyone looking for a clear and customizable tool to identify key price levels.
Disclaimer:
This indicator is for educational and informational purposes only. It does not constitute financial advice. Always conduct your own analysis and trade responsibly.
Get Started Today!
Add the Min-Max | Buy-Sell Alert with Levels indicator to your chart and take your trading to the next level. Customize it to fit your strategy and never miss a key trading opportunity again!
Psych LevelWhat it shows:
This indicator will show a horizontal line at a psychological value which can be user defined. (Psychological values are round numbers, like 10,50,100,1000 and so on...)
At these Psychological value there are often limit orders placed for both buying and selling and can often act as support and resistances.
Therefore it is useful to pre-draw these levels beforehand and this indicator will speed up the process doing so by adjusting few different settings and draw them automatically.
How to use it:
At these Psychological value there are often limit orders placed for both buying and selling and can often act as support and resistances. This is often the case when you look at limit orders at such levels on bookmap or level 2 data.
At these psychological levels it can be set as a target of your trade or as risk levels when taking a trade in either of direction. Obviously this alone shouldn't dictate the trade you should take but can be a valuable info to supplement your trade.
On the chart it is clear to see these psychological level lines are acting as resistances/supports.
Key settings:
Interval: Interval levels will be drawn for, between the minimum and maximum values inputted by the user. Minimum value allowed is 1.
Min. value: Minimum value of Psychological level that will be drawn. Minimum value allowed is 1.
Max value: Maximum value of Psychological level that will be drawn. Minimum value allowed is 1.
Line colour: Colour of line drawn.
Line width: Width of line drawn.
Line style: Style of line drawn, either solid, dotted or dashed.
Label offset: Offset of where where label will be, measured from current bar. Offset of 0 will be drawn at current bar location, any positive number will move to the right by the set amount.
Text Colour: Colour of label text
Text size: Size of label text
Example: Chart here shows setting for minimum value as 100, maximum value as 140 and interval as 5. In this setting lines will be automatically drawn at: 100,105,110,115,120,125,130,145 and 140.
The flexibility of user defined max/min and interval values allows to be accommodated for price with different price tags, including stocks under $10.
----------------------------------------------------------------------
If anything is not clear please let me know!

MTF Fibonacci Pivots with Mandelbrot FractalsMTF Fibonacci Pivots with Mandelbrot Fractals: Advanced Market Structure Analysis
Overview
The MTF Fibonacci Pivots with Mandelbrot Fractals indicator represents a significant advancement in technical analysis by combining multi-timeframe Fibonacci pivot levels with sophisticated fractal pattern recognition. This powerful tool identifies key support and resistance zones while predicting potential price reversals with remarkable accuracy.
Key Capabilities
This indicator provides traders with three distinct layers of market structure analysis:
Automatic Timeframe Adaptation: The primary pivot set automatically adjusts to your chart's timeframe, ensuring relevant support and resistance levels for your specific trading horizon.
1-Year Fibonacci Pivots: The second layer displays yearly pivots that reveal long-term market cycles and institutional price levels that often act as significant reversal points.
3-Year Fibonacci Pivots: The third layer unveils major market structure zones that typically remain relevant for extended periods, offering strategic context for position trading and long-term investment decisions.
Predictive Technology
What truly distinguishes this indicator is its advanced predictive capability powered by:
Mandelbrot Fractal Pattern Recognition: The indicator implements a sophisticated fractal detection algorithm that identifies recurring price patterns across multiple timeframes. Unlike conventional fractal indicators, it incorporates noise filtering and adaptive sensitivity to market volatility.
Tesla's 3-6-9 Principle Integration: The system incorporates Nikola Tesla's mathematical principle through a cubic Mandelbrot equation (Z_{n+1} = Z_n^3 + C where Z_0 = 0), creating a unique approach to pattern recognition that aligns with natural market rhythms.
Historical Pattern Matching: When a current price pattern exhibits strong similarity to historical formations, the indicator generates predictive targets with confidence ratings. Each prediction undergoes rigorous validation against multiple parameters including trend alignment, volatility context, and mathematical coherence.
Visual Intelligence System
The indicator's visual presentation enhances trading decision-making through:
Confidence-Based Visualization: Predictions display with intuitive star ratings, percentage confidence scores, and contextual information including price movement magnitude and estimated time to target.
Adaptive Color Harmonization: The color system intelligently adjusts to provide optimal visibility while maintaining a professional appearance suitable for any chart setup.
Trend Alignment Indicators: Each prediction includes references to the broader trend context, helping traders avoid counter-trend trades unless the reversal signal carries exceptional strength.
Strategic Applications
This indicator excels in multiple trading scenarios:
Intraday Trading: Identify high-probability reversal zones with precise timing
Swing Trading: Anticipate significant market turns at key structural levels
Position Trading: Recognize major cycle shifts for strategic entry and exit
The automatic 1-year and 3-year Fibonacci pivots provide institutional-grade reference points that typically define major market movements. These longer timeframes reveal critical zones that might be invisible on shorter-term analysis, giving you a significant edge in understanding where price is likely to encounter substantial buying or selling pressure.
This innovative approach to market analysis combines classical Fibonacci mathematics with cutting-edge fractal theory to create a comprehensive market structure visualization system that illuminates both present support/resistance levels and future price targets with exceptional clarity.
Setting Up MTF Fibonacci Pivots with Mandelbrot Fractals
Initial Setup
Adding this indicator to your TradingView charts is straightforward:
Navigate to the "Indicators" button on your chart toolbar
Search for "MTF Fibonacci Pivots with Mandelbrot Fractals"
Select the indicator to add it to your chart
A configuration panel will appear with various setting categories
Recommended Settings
The indicator comes pre-configured with optimal default settings, but you may want to adjust them based on your trading style:
For Day Trading (Timeframes 1-minute to 1-hour)
Pivots Timeframe 1: Auto (automatically adapts to your chart)
Pivots Timeframe 2: Daily
Pivots Timeframe 3: Weekly
Fractal Sensitivity: 2-3
Fractal Lookback Period: 20
Prediction Strength: 2
Color Theme: High Contrast or Dark Mode
For Swing Trading (Timeframes 4-hour to Daily)
Pivots Timeframe 1: Daily
Pivots Timeframe 2: Weekly
Pivots Timeframe 3: Monthly
Fractal Sensitivity: 1-2
Fractal Lookback Period: 30
Prediction Strength: 2-3
Color Theme: Default or Dimmed
For Position Trading (Timeframes Daily to Weekly)
Pivots Timeframe 1: Weekly
Pivots Timeframe 2: Monthly
Pivots Timeframe 3: Quarterly
Fractal Sensitivity: 1
Fractal Lookback Period: 50
Prediction Strength: 1
Color Theme: Monochrome or Pastel
Restoring Default Settings
If you've adjusted settings and wish to return to the defaults:
Right-click on the indicator name on your chart
Select "Settings" from the context menu
In the settings dialog, look for the "Reset All" button at the bottom
Confirm the reset when prompted
Alternatively, you can remove the indicator and add it again for a fresh start with default settings.
Advanced Settings Guidance
Visual Appearance
Use Gradient Colors: Enable for better visual differentiation between pivot levels
Color Transparency: 15% provides an optimal balance between visibility and chart clutter
Line Width: 1-2 for cleaner charts, 3+ for enhanced visibility
Fractal Analysis
Enable Fractal Analysis: Keep enabled for prediction capabilities
Fractal Box Spacing: Higher values (5-10) for cleaner displays, lower values (1-3) for more signals
Maximum Forecast Bars: 20 is optimal for most timeframes, adjust higher for longer predictions
Performance Considerations
Enable Self-Optimization: Keep enabled to maintain smooth chart performance
Resource Priority: Use "Balanced" for most computers, "Performance" for older systems
Force Pivot Display: Enable only when checking specific historical periods
Common Setup Mistakes to Avoid
Setting all timeframes too close together (e.g., Daily, Daily, Weekly) reduces the multi-timeframe advantage
Using high fractal sensitivity (4+) on noisy markets creates excessive signals
Setting fractal box spacing too low causes cluttered prediction boxes
Disabling self-optimization may cause performance issues on complex charts
Using incompatible color themes for your chart background reduces visibility
The indicator's power comes from its default 1-year and 3-year Fibonacci pivot settings, which highlight institutional levels while the auto-timeframe setting adapts to your trading horizon. These carefully balanced defaults provide an excellent starting point for most traders.
For optimal results, I recommend making minimal adjustments at first, then gradually customizing settings as you become familiar with the indicator's behavior in your specific markets and timeframes.
Screenshots:

Breakout Support & Resistance SwiftEdgeBreakout Support & Resistance
The Breakout is a technical analysis tool designed to identify breakout opportunities in the market by detecting price movements through support and resistance levels. It plots potential entry points, stop-loss (SL), and take-profit (TP) levels based on user-defined percentages, helping traders visualize breakout setups on their charts.
How It Works
Support and Resistance Detection: The indicator uses pivot points to identify support and resistance levels over a user-defined lookback period.
Breakout Identification: A breakout is confirmed when the price crosses above a resistance level (bullish) or below a support level (bearish) and remains there for a specified number of bars.
Entry, SL, and TP Levels: Upon a confirmed breakout, the indicator sets an entry point at the closing price and calculates SL, TP1, and TP2 levels based on user-defined percentages.
Directional Filtering: To avoid conflicting signals, the indicator filters breakouts based on the current trade direction. A new entry in the opposite direction is only set if the price moves a user-defined percentage away from the previous entry or if the previous trade hits its SL, TP1, or TP2.
Visuals: The indicator plots support and resistance lines, breakout labels, and entry/SL/TP levels on the chart. Users can choose to display only the latest entry or up to 5 recent entries.
Features
Customizable Settings: Adjust the lookback period for pivot points, breakout confirmation bars, SL/TP percentages, and more.
Directional Change Control: A direction change is indicated when the price moves significantly in the opposite direction, helping to manage trend reversals.
Multiple Entry Display: Option to show up to 5 recent entries for tracking multiple breakouts.
Alerts: Receive alerts when a breakout is confirmed, including entry, SL, TP1, and TP2 levels.
Settings
Pivot Lookback Length: Number of bars to look back for identifying support and resistance levels (default: 5).
Breakout Confirmation Bars: Number of bars the price must stay above/below the level to confirm a breakout (default: 2).
Take Profit 1 (%): First take-profit level as a percentage above/below the entry (default: 2.0%).
Take Profit 2 (%): Second take-profit level as a percentage above/below the entry (default: 4.0%).
Stop Loss (%): Stop-loss level as a percentage below/above the entry (default: 1.0%).
Show Multiple Entries: Toggle to display up to 5 recent entries or only the latest (default: false).
Direction Change Threshold (%): Percentage the price must move away from the entry to allow a direction change (default: 2.0%).
How to Use
Add the Breakout Scanner to your chart.
Adjust the settings to match your trading style (e.g., tweak the pivot lookback or SL/TP percentages).
Watch for breakout labels ("Breakout") on the chart, indicating a confirmed breakout.
Use the plotted entry, SL, TP1, and TP2 levels to plan your trades.
Enable alerts to be notified of new breakouts in real-time.
Notes
This indicator is designed to assist with identifying breakout opportunities and does not guarantee specific results. Always combine it with other analysis and risk management techniques.
The direction change feature helps filter breakouts in the opposite direction, but significant price movements may still trigger a new entry in the opposite direction.
For best results, test the indicator on a demo account to understand its behavior in your preferred market and timeframe.

JL - DWM OHLCThis indicator plots the following price levels on your chart automatically AND will not show up if you are using a timeframe bigger than 60 minutes, 1 day, or 1 week.
Here are the price levels that are automatically plotted for you, and so you know the styling is different for Daily, Weekly, Monthly levels so you can easily distinguish between them:
- Prior Day: High / Low / Close
- Current Day: Open
- Prior Week: High / Low / Close
- Current Week: Open
- Prior Month: High / Low / Close
- Current Month: Open
These plots are timeframe dependent and will not plot on subsequently higher timeframes, here is how they work:
Daily Price Levels are only shown on timeframes that are smaller than 60 minutes.
Weekly Price Levels are only shown on timeframes smaller than 1 Day.
Monthly Price Levels are only shown on timeframes smaller than 1 Week.
This way, you can turn on the indicator and not have to think about turning off certain price levels if you switch to a larger / longer timeframe than what you typically use.
For example, Daily OHLC price levels will quickly clutter the 60 minute chart, and likely you don't need to know the HLC of the Prior Day if you are looking at the 60 minute chart. Therefor it may be helpful to automatically hide the Daily price level plots, and only show the Weekly and Monthly plots on the 60 minute timeframe.
I hope you find this indicator helpful, thanks for reading.

Machine Learning Trendlines Cluster [LuxAlgo]The ML Trendlines Cluster indicator allows traders to automatically identify trendlines using a machine learning algorithm based on k-means clustering and linear regression, highlighting trendlines from clustered prices.
For trader's convenience, trendlines can be filtered based on their slope, allowing them to filter out trendlines that are too horizontal, or instead keep them depending on the user-selected settings.
🔶 USAGE
Traders only need to set the number of trendlines (clusters) they want the tool to detect and the algorithm will do the rest.
By default the tool is set to detect 4 clusters over the last 500 bars, in the image above it is set to detect 10 clusters over the same period.
This approach only focuses on drawing trendlines from prices that share a common trading range, offering a unique perspective to traditional trendlines. Trendlines with a significant slope can highlight higher dispersion within its cluster.
🔹 Trendline Slope Filtering
Traders can filter trendlines by their slope to display only steep or flat trendlines relative to a user-defined threshold.
The image above shows the three different configurations of this feature:
Filtering disabled
Filter slopes above threshold
Filter slopes below threshold
🔶 DETAILS
K-means clustering is a popular machine-learning algorithm that finds observations in a data set that are similar to each other and places them in a group.
The process starts by randomly assigning each data point to an initial group and calculating the centroid for each. A centroid is the center of the group. K-means clustering forms the groups in such a way that the variances between the data points and the centroid of the cluster are minimized.
The trendlines are displayed according to the linear regression function calculated for each cluster.
🔶 SETTINGS
Window Size: Maximum number of bars to get data from
Clusters: Maximum number of clusters (trendlines) to detect
🔹 Optimization
Maximum Iteration Steps: Maximum loop iterations for cluster computation
🔹 Slope Filter
Threshold Multiplier: Multiplier applied to a volatility measure, higher multiplier equals higher threshold
Filter Slopes: Enable/Disable Trendline Slope Filtering, select to filter trendlines with slopes ABOVE or BELOW the threshold
🔹 Style
Upper Zone: Color to display in the top zone
Lower Zone: Color to display in the bottom zone
Lines: Style for the lines
Size: Line size

Price Levels by Market Cap (Manual)This indicator will forecast the price by marketcap. The crypto's current circulating supply should be inputted manually.

High and Low in a Given Date/Time RangeThis Pine Script v5 indicator plots horizontal lines at both the highest and lowest price levels reached within a user-defined date/time range.
Description:
Inputs:
The user specifies a start and an end date/time by providing the year, month, day, hour, and minute for each. These inputs are converted into timestamps based on the chart’s timezone.
How It Works:
Timestamp Conversion: The script converts the provided start and end dates/times into timestamps using the chart’s timezone.
Bar Check: It examines every bar and checks if the bar’s timestamp falls between the start and end timestamps.
Price Updates:
If a bar’s time is within the specified range, the indicator updates the highest price if the current bar's high exceeds the previously recorded high, and it updates the lowest price if the current bar's low is lower than the previously recorded low.
Drawing Lines:
A red horizontal line is drawn at the highest price, and a green horizontal line is drawn at the lowest price. Both lines start from the first bar in the range and extend dynamically to the current bar, updating as new high or low values are reached.
End of Range: Once a bar's time exceeds the end timestamp, the lines stop updating.
This tool offers a clear and straightforward way to monitor key price levels during a defined period without any extra fluff.

Highlight All Bars Matching Today's Weekday Across ChartThis indicator highlights all bars on the chart that correspond to the same weekday as today. It is designed to help traders identify recurring patterns or behaviors that may appear consistently on specific weekdays.
By visually marking these repeating days, traders can more easily observe potential time-based market tendencies and enhance pattern recognition in their analysis.
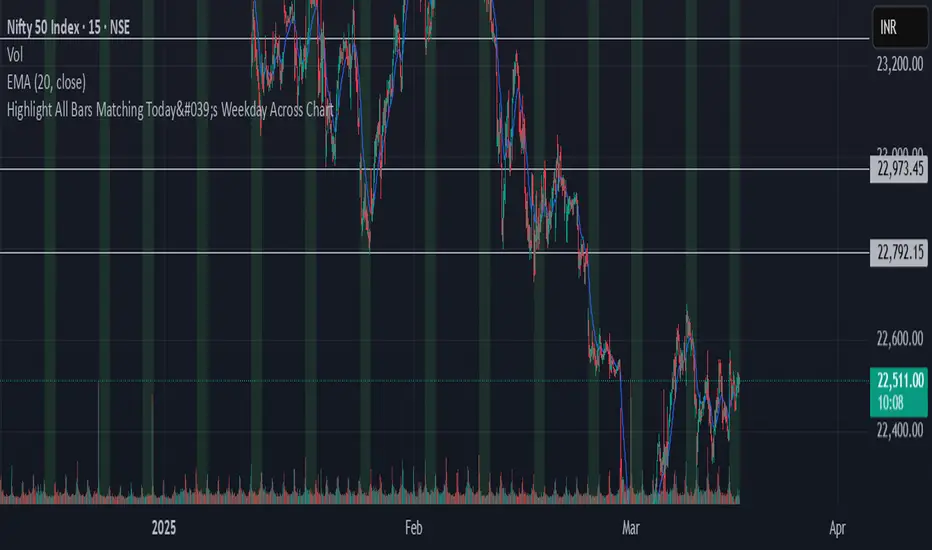
Smart Range Breakout - SwiftEdgeDescription:
The "Smart Range Breakout - SwiftEdge" indicator is a custom tool designed for identifying potential breakout opportunities on a 1-minute chart, with a focus on volatile markets like the DAX index. This script introduces a unique approach by combining range consolidation detection with volume confirmation and breakout validation, tailored for short-term trading strategies.
How It Works:
The indicator identifies consolidation periods where the price range (difference between the highest high and lowest low over a user-defined length) is below a multiple of the Average True Range (ATR). This helps detect periods of low volatility, which often precede breakouts.
Once a consolidation is confirmed (minimum number of bars), a green box is drawn on the chart, spanning a fixed length of bars (default 50), representing the potential breakout zone.
Breakouts are signaled only when a candle opens above the upper boundary (box top) or below the lower boundary (box bottom) of the consolidation box, ensuring a clear entry point based on price action at the open.
The script includes a volume filter, requiring volume to exceed a moving average by a specified multiplier, and a confirmation period to validate the breakout over consecutive bars.
To avoid signal clutter, only one breakout signal (up or down) is generated per box, and no further signals are issued until a new consolidation box is formed.
How to Use:
Apply the indicator to a 1-minute chart (optimized for DAX or similar volatile indices).
Adjust the "Consolidation Length" (default 5) to set the lookback period for detecting consolidation.
Modify the "Range Threshold (ATR Multiplier)" (default 2.0) to make the consolidation detection more or less strict based on market volatility.
Use "Minimum Consolidation Bars" (default 2) to set the minimum duration of a consolidation phase.
Tune "Confirmation Bars" (default 1) to require more bars to confirm the breakout.
Set "Volume MA Length" (default 5) and "Volume Multiplier" (default 1.1) to filter breakouts with insufficient volume.
Adjust "Max Box Length" (default 50) to control the duration of the breakout zone on the chart.
Look for green triangles below the chart for bullish breakouts and red triangles above for bearish breakouts, occurring when a candle opens outside the box with confirmed volume.
Originality:
This script stands out by integrating a fixed-length consolidation box with an opening-price breakout condition, combined with volume and multi-bar confirmation. Unlike traditional breakout indicators that rely solely on closing prices or simple price thresholds, this approach prioritizes the opening price and limits signals to one per cycle, reducing noise in volatile markets.
Chart Notes:
The accompanying chart displays the indicator's output with green boxes indicating consolidation zones, yellow dots marking consolidation periods, and green/red triangles for breakout signals. No additional scripts or unrelated drawings are included to ensure clarity.
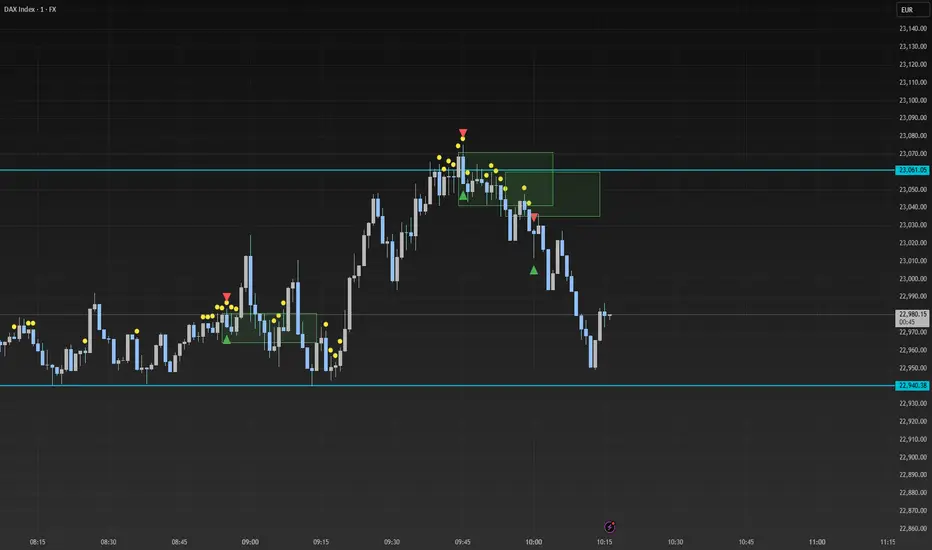
Multi Swing Point ConnectionsMulti Swing Point Connections — Tool for custom Highs & Lows structure mapping. This indicator allows to create fully customizable connections between multiple types of swing points, offering advanced visual structure of price dynamics.
Features:
Dynamic Swing Detection using adjustable pivot period.
Connect up to 8 swing relationships, with individual controls for swing points: 🔴 Higher High, 🟠 Lower High, 🔵 Higher Low, 🟢 Lower Low
Countback customization (steps for historical/future reference)
Optional enabling/disabling per connection
Visual Structure Mapping with configurable line color and width.
Perfect for identifying key structure shifts
Mapping trending vs consolidating phases
Building your own internal order flow frameworks
Inputs:
Swing Period: Defines how many bars to the left/right are used to detect pivot highs/lows.
Line Customization: Adjust style, width and color for visual clarity.
Connection Parameters: Select which swing types to connect, and control how far back and forward to look when making the connection.
Connection Examples:
HH to LH - Mapping potential bearish transition. Often signals weakening bullish momentum and a potential bearish shift in structure.
LL to HL - Mapping potential bullish transition. Suggests buyers stepping in earlier and potential bullish momentum building.
HL to LH (or LH to HL) - these can indicate sideways structure — often in consolidating or compressing price action depending on custom steps.
HH to HH (or LL to LL) - Connecting successive HHs or LLs visualizes higher highs in uptrends or lower lows in downtrends — a classic trend-following perspective.
HL to HL (or LH to LH) - Connecting successive HLs (or LHs) can highlight the “internal” structure between impulse legs, often defining minor trend channels or short-term ranges within the larger trend.
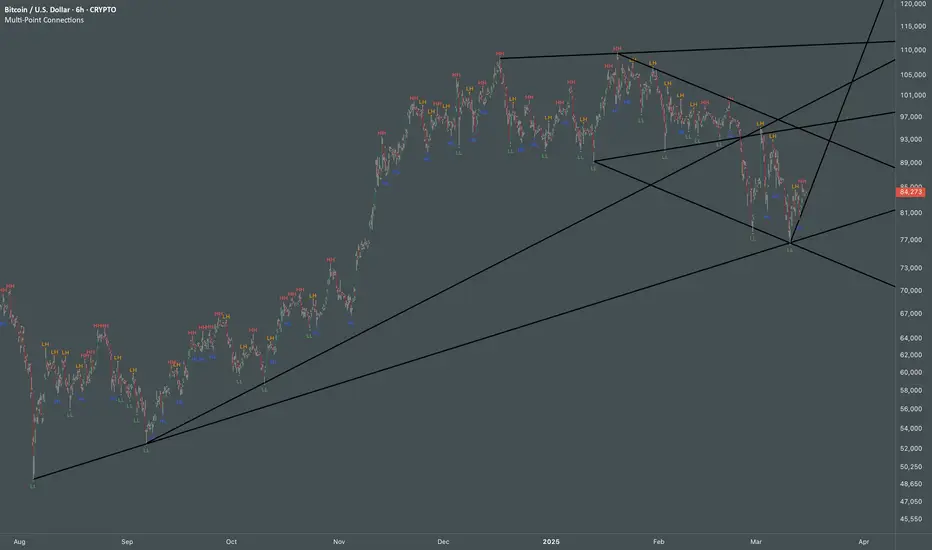
Diamond PatternDiamond Pattern Indicator
This indicator is designed to detect the Diamond Pattern, a technical formation that often signals potential trend reversals. The diamond pattern can lead to strong price movements, making it a valuable tool for traders.
Features:
✅ Automatic Detection – Identifies diamond patterns on the chart.
✅ Trend Reversal Signals – Highlights potential price direction changes.
✅ Multi-Timeframe Compatibility – Works across all timeframes.
✅ User-Friendly – Simple to use with no complex settings required.
How to Use:
1. Add the indicator to your chart.
2. Monitor for the formation of a Diamond Pattern.
3. Use the breakout direction to guide your trading decisions.
