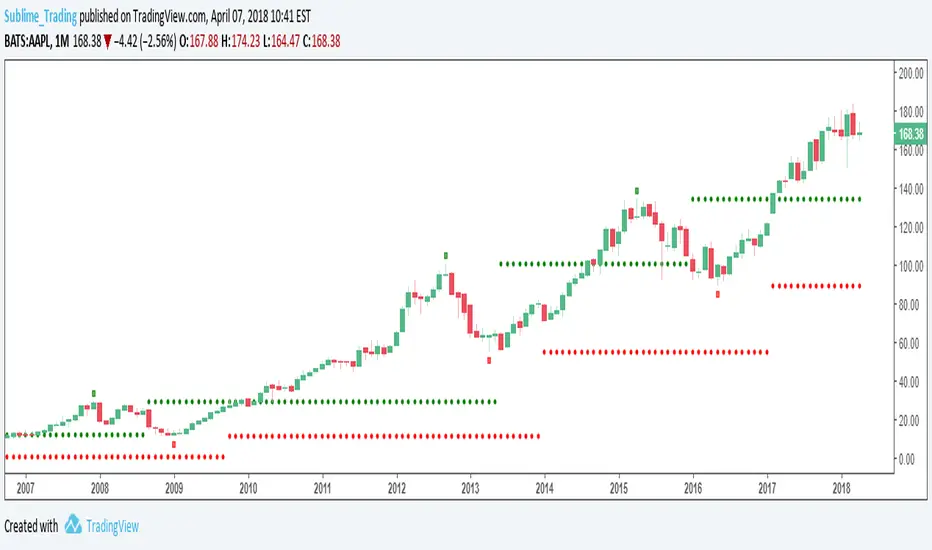
Prev HHLL Round NumbersDisplays previous highs and lows. Added Round numbers.
Modified Chris Moody script.
Support
BottomFinder Adv. Charts SuiteIn development. Will contain over a dozen of the most popular indicators in one script. Save on your indicator space and keep extra slots open for other stuff!
SS EMA / SMA RibbonColor Change if above or below EMAs / Ribbon
StokedStocks EMA / SMA Ribbon 9 20 25 30 35 40 45 50 55 60 65 70 75 80 85 90 95 100 200
EMAs Color Change if above or below EMAs / Ribbon
Lime : Uptrending; Long Bias
Green : Dip Buy / ReEntry or downtrend reversal warning
Red : Downtrend. Short Bias
Maroon : Short Reentry (sell the peak) or uptrend reversal warning
1st strategy Long when Price crosses above all EMAs
2nd strategy if late is buy first or second pullback to 9 or 20 EMA which are the 1st and 2nd ribbon lines (in an uptrend)
3rd strategy is Short once price crosses UNDER all EMAs
Use Trailing stop % once long or short
Better when shorter time frames line up with Longer time Frames for less risk EXAMPLE Above all EMAs on 5min chart and on Daily Chart

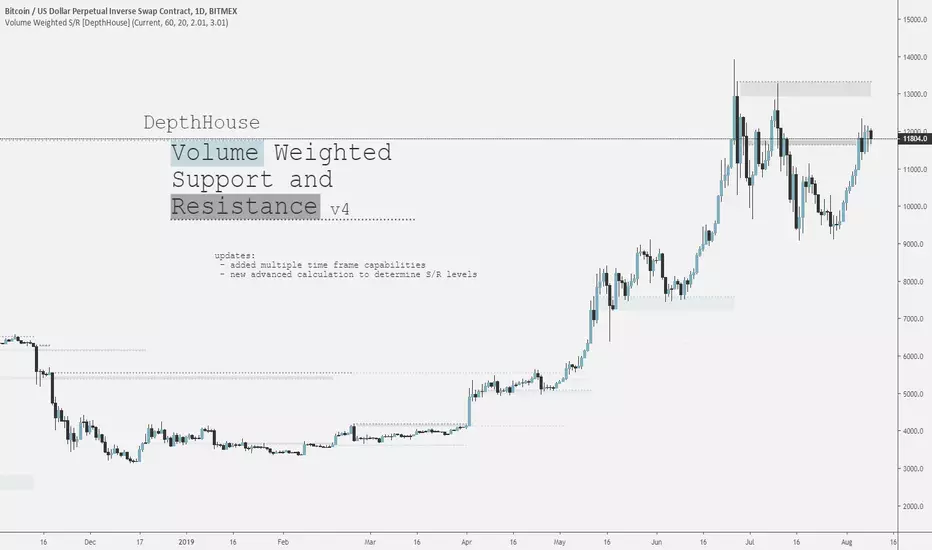
DepthHouse Volume Weighted Support and ResistanceDepthHouse Volume Weighted Support and Resistance or VWSP uses calculations based on volume to determine possible levels of support and resistance.
--Options--
Moving Average Type: The first version supports 4 different moving averages for which the calculation are based upon. SMA (default) EMA, TEMA, DEMA
more of these will be added based on popularity & requests
Factors: The Current version supports up to 3 different factors. This is what gives the VWSR the layering effect.
The defaults are 2,3,4. However please feel free to adjust these to match your trading style.
Fill Debugger: This does nothing other than alters the fill spacing. This is used to to get rid of continuous fills if they ever occur. Does not effect calculations at all.
Try this indicator for FREE! Just leave a comment, or feel free to send me a PM
Support & Resistance FilterVisualize support and resistance levels with a high level of user control. Tired of meaningless, tightly clustered, support and resistance lines (shouldn't those just be considered bounces)? Just filter them out with the Bounce Filter. Want to visualize S&R in a crisp, clear new way? Use "Areas of S&R". Want to have a ridiculous amount of control over what counts for support and resistance in the first place? Use the Swing Filter (built-in). Perhaps most interesting... ...want to see support and resistance for (say) Bitfinex-BTC/USD on a Coinbase chart to see how they affect Coinbase candles? Then check out the advanced settings and have fun ;)
Support & Resistance levels are determined by historic pivots (swings). If a price breaks through the first resistance level, it may really take off. If it breaks through the second level, or through all five resistance levels, you might be on your way to the moon (Lambos not included). The inverse is true when the price breaks-down, through support levels.
5 Levels of Support and 5 levels of Resistance are available.
In a very bullish or bearish situation, searching back in time for the next highest Support or Resistance level can become quite demanding on TradingView's server. I've pushed it to the limit:
R2 & S2 look back 1,000 candles
R3 & S3 look back 2,250 candles
R4 & S4 look back 3,500 candles
R5 & S5 look back 4,999 candles
When TradingView's servers are getting a little bogged down, you may get an error about "a loop being longer than 100ms". That just comes with the territory of searching so many candles back. To resolve it, just click "Force Reload" in the settings.
I'd love to post the manual, the instructions for the settings, here in the description, but the publishing policy sets a limit as to how long these descriptions can be. So check the comments for a manual on how to use this indicator. And if you'd like to plug this kind of indicator into your scripts, just contact me for custom work.
~jdhadwin

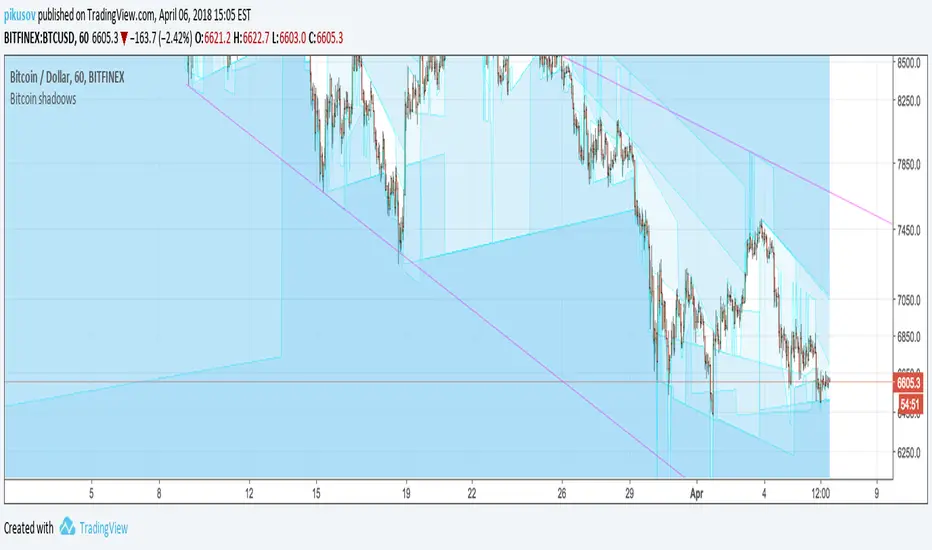
CryptoShadows V1The first Diagonal Support and Resistance indicator. Best for bitcoin and cryptocurrencies

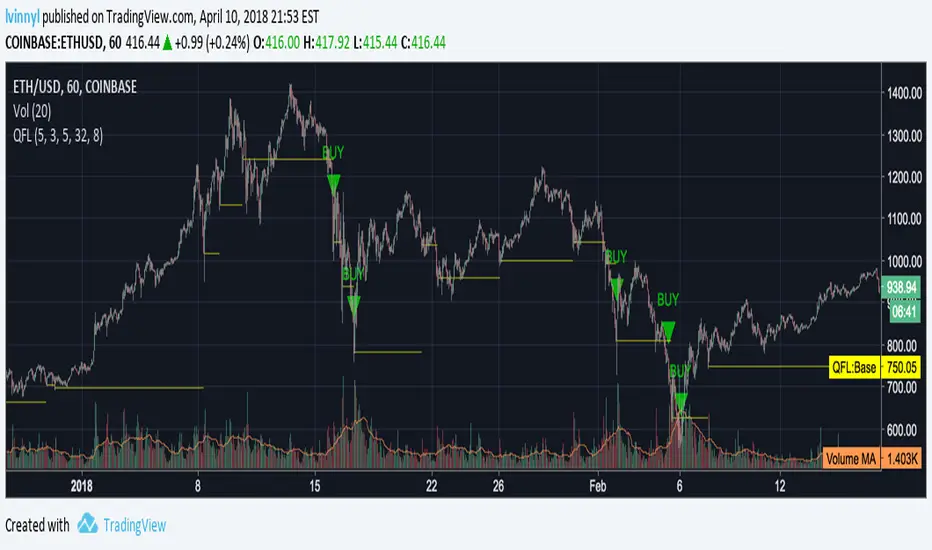
Quickfingers Luc's Base Breaking Indicator v1This script is an attempt to implement Quickfingers Luc's Base Breaking Strategy (steemit.com) where it will detect bases using pivot low detection, panic selling detection (price momentum), RSI and percent below base thresholds to trigger an alert condition.
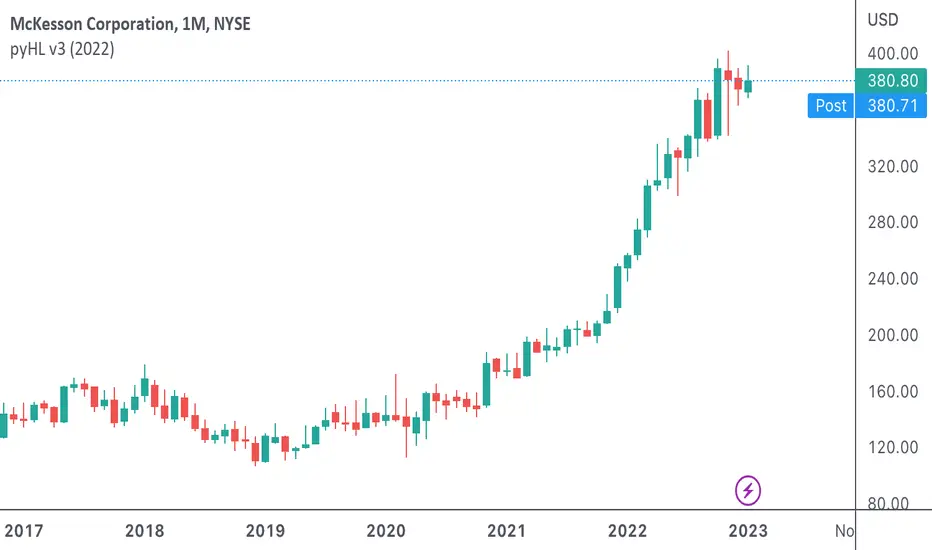
pyHLThis is a customised indicator highlighting key levels of support and resistance on the monthly time frame.
mPiv9 v2This is a customised indicator highlighting key levels of support and resistance on the monthly time frame.

wPiv21This is a customised indicator highlighting key levels of support and resistance on the weekly time frame.

wPiv11This is a customised indicator highlighting key levels of support and resistance on the weekly time frame.
wPiv4This is a customised indicator highlighting key levels of support and resistance on the weekly time frame.
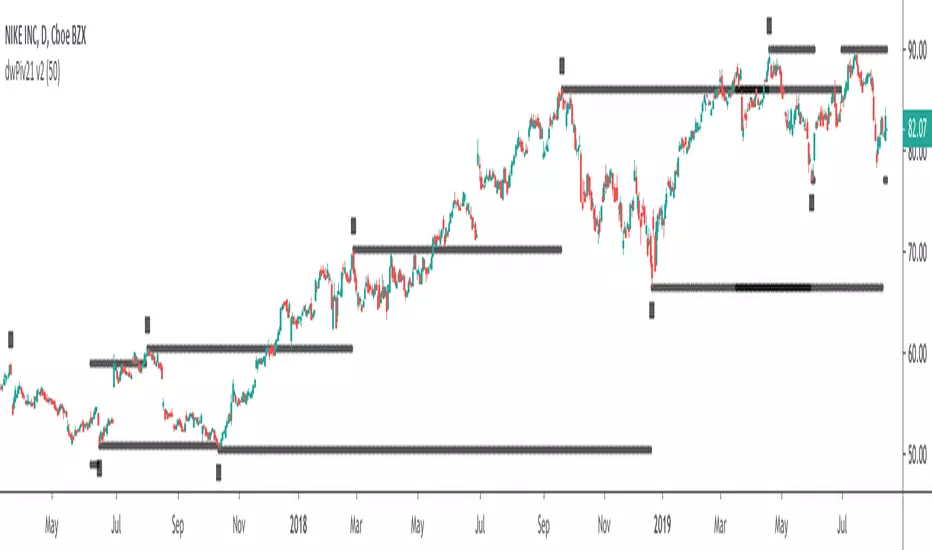
dwPiv21This is a customised indicator highlighting key levels of support and resistance on the daily time frame.
dwPiv11This is a customised indicator highlighting key levels of support and resistance on the daily time frame.
dwPiv4This is a customised indicator highlighting key levels of support and resistance on the daily time frame.

dPiv5This is a customised indicator highlighting key levels of support and resistance on the daily time frame.
mPiv9This is a customised indicator highlighting key levels of support and resistance on the monthly time frame.
yHLThis is a customised indicator highlighting key levels of support and resistance on the monthly time frame.
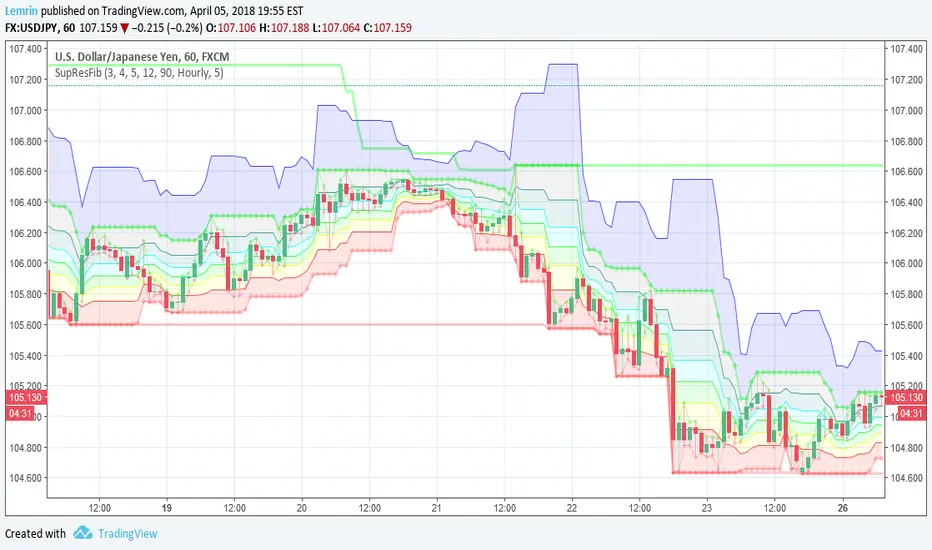
Automatic Support, Resistance, Fibonacci LevelsThis indicator plots absolute high and low values for up to five completely adjustable time periods (in months, weeks, days, hours, minutes) and optionally calculates the Fibonacci levels on the pair of absolutes of your choice, ascending or descending, and mimics the shading available in the built-in Fib charting tools (e.g. retracement).
Here are a few screenshots of the same chart with various options selected.
3-Month, 4-Week, and 5-Day absolutes with 3-Monthly Fib plotted:
The same chart with 4-Weekly Fib:
The same chart with 5-Daily Fib:
5-Day, 12-Hour, 90-Minute absolutes with 12-Hourly Fib:
Zoomed in, on a 30-minute interval, with 90-minute Fib:
With descending ("inverted") 90-minute Fib:
I started putting this together for Vazzyb, who was looking for a way to automate plotting horizontal support and resistance levels for monthly, weekly, and daily extremes, and then I added additional features as they occurred to me. Special thanks to Paaax, who suggested I add Fib levels.
I am leaving the code open, so you may feel free to grab snippets you like and use them for your own purposes. Of particular interest may be my custom "calc_fib()" function, which accepts any series pair, as well as a Boolean indicating whether to invert, and returns an array with each of the major Fibonacci levels: .
If anyone likes this enough to feel generous, please feel free:
BTC
3KmFchJ18QvMzAJKDcFQXvyK9p1EHWQdhP
BCH
qqtrw64ptuwprk5vtj3z8qwkvh3v0jawxq7khqng7x
ETH
0x9b51361A278910Ba3945C7519C9f0FA8a77df18d
LTC
MDeWWsP7XCG2zQuZ2dYALZXQ52u2qkc8fh
P.S. If you want the time lengths to be as close to accurate as possible, don't forget to change the number of days per week when using for cryptocurrency!

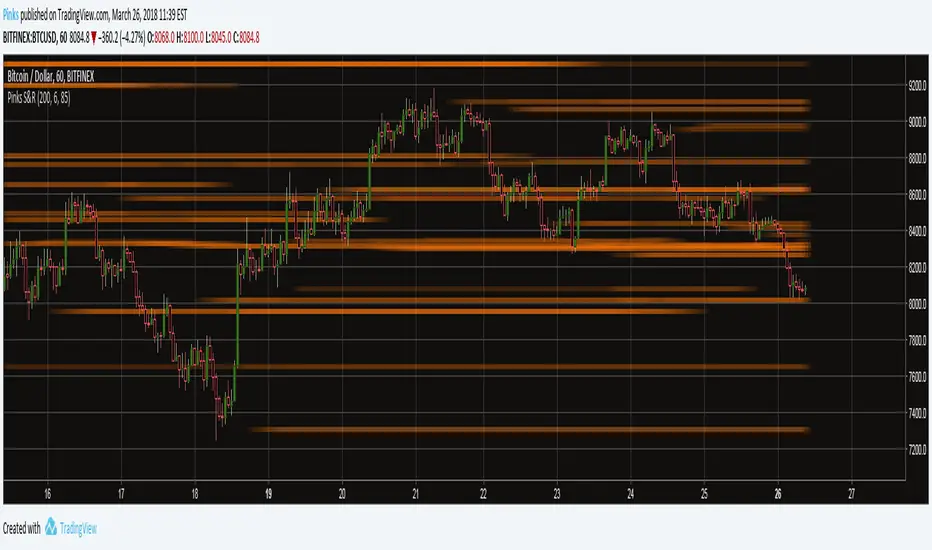
Pinks Statistical Support and ResistanceSupport and Resistance levels based on statistical methods
This is an autonomous Support and Resistance (S&R) indicator that locates levels where the price of an asset is likely to meet resistance or support. It works on all timeframes, and on any asset. It is more advanced than many other indicators that purport to do the same thing.
How to use Pinks Statistical Support and Resistance
It is recommended to turn off Indicator Values when using this indicator. Do do this, perform the following:
Right click somewhere on your chart window background
Click Properties
Click on the "Background" tab
Uncheck "Indicator Values*
Parameters
Length: How many candles in the past the algorithm will use for calculating S&R levels.
Cleanup parameter: How strongly the algorithm will discard certain datapoints it does not consider important in its calculations.
Acceptance: This parameter sets the limit for what the algorithm considers a S&R level. Lower values will display more (and weaker) levels, higher values will show fewer (and stronger) levels.