Basecamp AutoFibAutomatic Fibonacci Support and Resistance derived from the recent Average True Range.
This tool is used as a guideline for where mathematically evident support and resistances are estimated to be.
Unlike typical methods, this will adjust as candles print and the ATR expands or contracts assisting the user in ensuring realistic price targets relative to the current movement.
Support

True Range AutoFibAutomatic Adjusting Fib Support and Resistance
Adjustable Candle Length Average True Range centered on the 34 MA Fibonacci Support and Resistance lines for all timescales on all instruments.
**These lines do move as candles print adjusting slowly to the changing ATR. This generally should indicate the realistic expected move for the current time frame.
{PREMIUM} Support And Resistance ScriptSupport and resistance is a trading technique that has been around for decades. In simple terms, support and resistance is a measure of supply and demand. While this sounds simple, it is very difficult to identify support and resistance as they happen in real time.
Luckily, we have a solution. The script you see below is a custom software that was developed by Mike that automatically identifies the best price levels to buy (support) at and sell (resistance) at. The software uses a proprietary algorithm that identifies when stocks are undervalued and overvalued. When a stock is undervalued, a blue diamond and the word "SUPPORT" will automatically appear on your chart. Additionally, when a stock is overvalued, a black flag and the word "RESISTANCE" will automatically appear on your chart.
When you sign up for our program you have 100% full access to use the support and resistance script on all major stock exchanges, global currency pairs, worldwide indexes, 30+ crypto exchanges, and more. In addition to having completely automatic support and resistance points on your chart, you will have exclusive access to a screener that scans through 19,000 stocks every night and finds the best stocks to buy now. The screener shows stocks that have huge upside potential with minimal downside risk. The stocks on the list are in the $1 - $300 price range, so this screener is suitable for all types of traders.

Spacer - SRThis script spaces prices between charts while scalping
They can be used as potential support and resistance
Prices are spaced with odd numbers only 1,3,5,7,9
Enjoy the script

Grimes Modified MACD Supply DemandA follower of mine asked me if I could make a version of my www.tradingview.com script using the MACD. Well it just so happens I was making a few modifications to my MACD script: just as this question came up so I went ahead and threw this together.
The MACD that triggers the SR zones is pictured below, with key trigger points encircled to illustrate how it works.
Volume Based S/RI got a question if it would be possible to Automatically draw S/R levels based on Volume rather than RSI as I had earlier done in this script;
Well it certainly is and it looks as though it might even be tradeable.
The indicator compares the size of volume bars so that if there is a noticeable increase in volume (noticeable here meaning above the indicator threshold) it marks the bar high and low prior to the bigger volume candle.

HTF High/LowThis simple script draws the previous higher timeframe candle high/low to your chart.
You can also make the script paint the zone between the low/open and the high/close.

Support the Resistance BacktestHello Fellow Traders!
-------------------------------------------
This is the newest addition to Gnome Alerts PRO!
This Bot Script works on all Crypto, Leverage, Forex, & Traditional Exchanges.
Trade of Support & Resistance Levels in Realtime!
FEATURES
------------------------
*Autoview Ready*
- Easy to Use
- Backtesting Included
- Stop Loss
More info on how gain access in my profile!

ZenTrading MTFA Support & Resistance Day/Swing_BETAThis is a multiple timeframe analysis indicator for the day trading and swing trading timeframes (4HR downwards).
The pink dots indicate support/resistance levels. Current levels as well as past levels are relevant.
This is a beta testing version of the indicator, there may be some minor issues, so use at your own risk.
If you have any questions feel free to contact me

ZenTrading MTFA Support & Resistance_BETAThis is a multiple timeframe analysis indicator for the long term and swing trading timeframes (1HR upwards).
The crosses indicate support/resistance levels. Current levels as well as past levels are relevant.
This is a beta testing version of the indicator, there may be some minor issues, so use at your own risk.
A day trading timeframe version is coming soon.
If you have any questions feel free to contact me
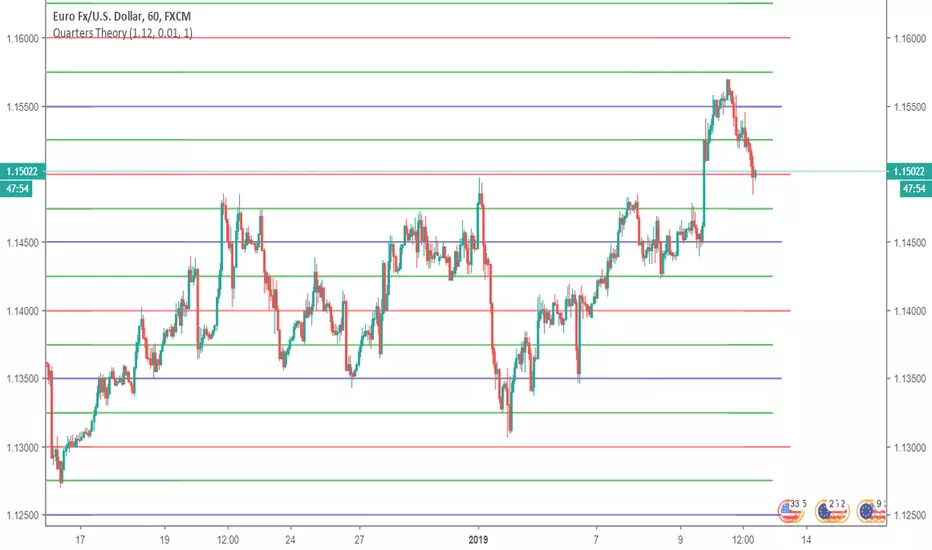
Quarters TheoryIndicator that lets you to put Whole (red), Half (blue) and Quarter (green) levels on a chart, which work as support/resistance levels. Defaults are only for EURUSD, for other symbols you have to change the settings. First input is "Starting Price (Bottom)", which should be the lowest point you want your levels to be. There are only 10 Whole levels on this indicator, but if you want you could add them from pine editor. The next input is "Next Whole Level" this is the price from one whole level to next whole level, for example for EURUSD it is 0.01. The third input is for removing the quarter lines (green lines), if you want to remove them set this option to "0", otherways leave this to "1".
This indicator looks very good on JPY and NZD pairs.
Works on long term too:
Learned from him: www.youtube.com
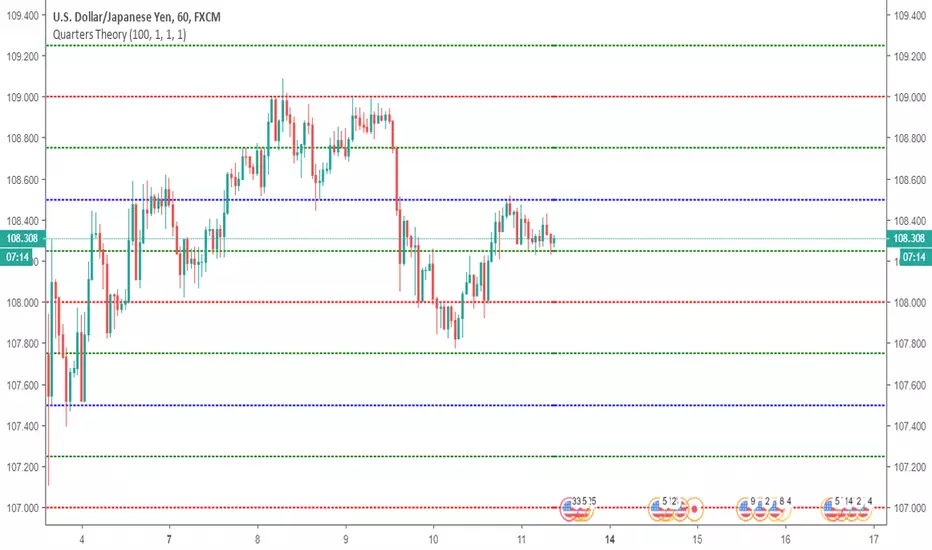
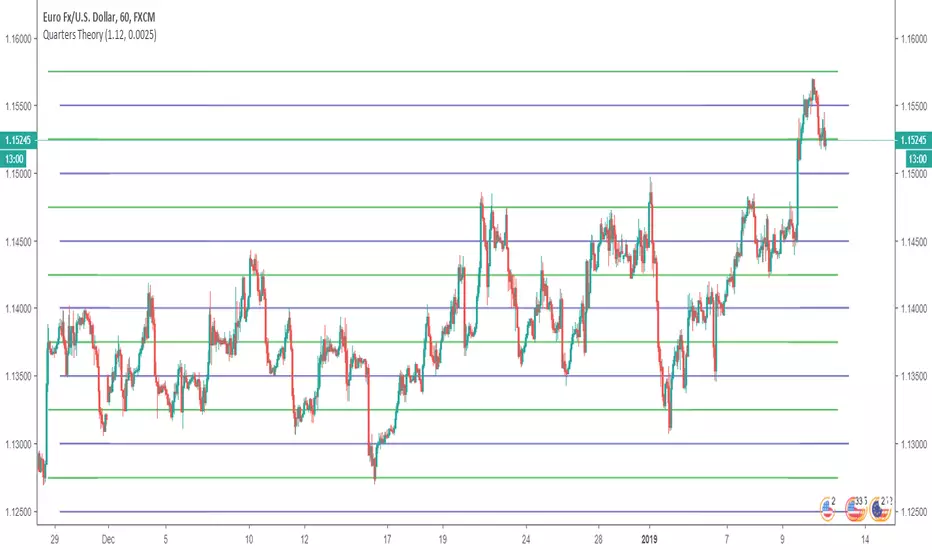
Quarters TheoryThis indicator helps you to put Quarter Theory lines on your chart. It's defaults are meant for EURUSD , but you can change it for other charts. There are 16 lines in this indicator.
For EURUSD recommended settings right now are: Starting Price (Bottom):1.12 and Gap: 0.0025
USDCAD: Starting Price (Bottom):1.315 and Gap: 0.005
EURAUD: Starting Price (Bottom):1.59 and Gap: 0.005
USDJPY: Starting Price (Bottom):107 and Gap: 0.5
USDCHF: Starting Price (Bottom):0.97 and Gap: 0.0025
BTCUSD: Starting Price (Bottom):3200 and Gap: 100
XAUUSD: Starting Price (Bottom): 1230 and Gap: 5
These settings are the ones I use, but you could find better settings for yourself.
Works very well on JPY pairs.
Horizontal LinesHorizontal lines help you to put Quarter Theory lines on your chart. It's defaults are meant for EURUSD , but you can change it for other charts. There are 16 lines in this indicator.
For EURUSD recommended settings right now are: Starting Price (Bottom):1.12 and Gap: 0.0025
USDCAD: Starting Price (Bottom):1.315 and Gap: 0.005
EURAUD: Starting Price (Bottom):1.59 and Gap: 0.005
USDJPY: Starting Price (Bottom):107 and Gap: 0.5
USDCHF: Starting Price (Bottom):0.97 and Gap: 0.0025
BTCUSD: Starting Price (Bottom):3200 and Gap: 100
XAUUSD: Starting Price (Bottom): 1230 and Gap: 5
These settings are the ones I use, but you could find better settings for yourself. It works very well on JPY pairs.
Ichimoku A/D Breakoutthis is basically a clone of the super a/d indicator but we're using a standard ichimoku as the source for the trend instead of the supertrend indicator

RSI Based Automatic Supply and DemandA script that draws supply and demand zones based on the RSI indicator. For example if RSI is under 30 a supply zone is drawn on the chart and extended for as long as there isn't a new crossunder 30. Same goes for above 70. The threshold which by default is set to 30, which means 30 is added to 0 and subtracted from 100 to give us the classic 30/70 threshold on RSI, can be set in the indicator settings.
By only plotting the Demand Below Supply Above indicator you get automatic SD level that is updated every time RSI reaches either 30 or 70. If you plot the Resistance Zone / Support Zone you get an indicator that extends the zone instead of overwrite the earlier zone. Due to the zone being extended the chart can get a bit messy if there isn't a clear range going on.
There is also a "confirmation bars" setting where you can tell the script how many bars under over 30 / 70 you want before a zone is drawn.
Here is an image of only using the "Demand Below / Supply Above" plot.
As you can see, this could be useful "Price Flow" indicator, where we would only short if a zone appears below another zone, or long if two zones in a row are going up, like stairs.

Trend Follower With Help of Donchian Channels - TFWHDCThis is a simple Day Trade indicator, but can be used for swing and long term trades.
It is based on Donchian Channels to detect trend and point out resistance or support breakouts using arrows.
The bars ared colored when a breakout occurs. When a resistance breakout occurs the current and the next bars are colored green (default) and when a support breakout occurs the current and the next bars are colored red (default). This way this indicator can show if its an uptrend or a downtrend.
I hope this indicator will be useful for many traders!
Thank you!

Auto Pivot PointsThis indicator plots a Pivot Point and 3 Support and Resistance lines that automatically adapt to the Timeframe
These can also be plotted against a Custom Timeframe
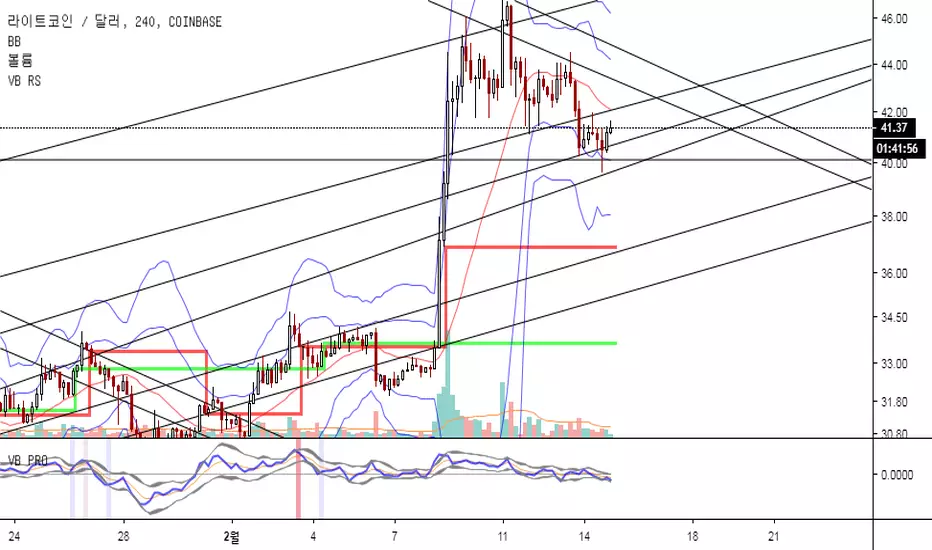
VB Resistance SupportThe VB RS indicator will plot dot lines that represent the swing points based on the swing length input(number of bars to the left and right of the swing point).
Swing highs and lows can be used by traders to identify possible areas of support and resistance , which can then be used to determine optimal positions for stop-loss or profit target orders.
highs and lows are earlier market turning points. Hence, they are natural choices for projecting support and resistance levels. Every point is a potential support or resistance level . However, for effective trading, focus on major swing highs and lows.
This indicator was created based on VB Indicator.
Support & Resistance Zones [SHK]Support & Resistance Zones clearly draws some useful S\R zones for you.
Important notes:
It's not bulletproof and unmistakable but it may be so useful to get some strong zones. You may get false or missed levels, So always check for other levels.
Always draw the continuation of previous levels by hand. It's a must! I didn't continue the zones to keep your charts clear.
The lagging is zero . Unlike many similar scripts.
Just compare the results to another support and resistance tools :)
Feel free to share your ideas about this script.

Support/Resistance Algo-Tradeing StrategyThis strategy Automates Support and resistance trading and a tight trailing stop loss technique. The support and resistance levels are calculated from previous highs and lows; these levels are used to make two types of trades:
1. Break out trades, taking a trade if the market is able to push through a support or resistance level.
2. Liquidity pool rejection, also known as a stop loss hunt. When the market is brought past a key level (to take out stop losses) which traders (usually institutions) use to enter, which then reverses back through the support/resistance level where the strategy enters a trade.
An optional "volatility filter" may be used when on a suitable market. This means that trades are only entered when there is suitable volatility.
A tight stop loss is kept so most trades lose, but winning trades are left to run much further. So this is a very reliable profitable strategy on many markets.
For a limited time I will provide access to this strategy for free as it is not yet complete, there is still testing to do and I would appreciate any feedback.

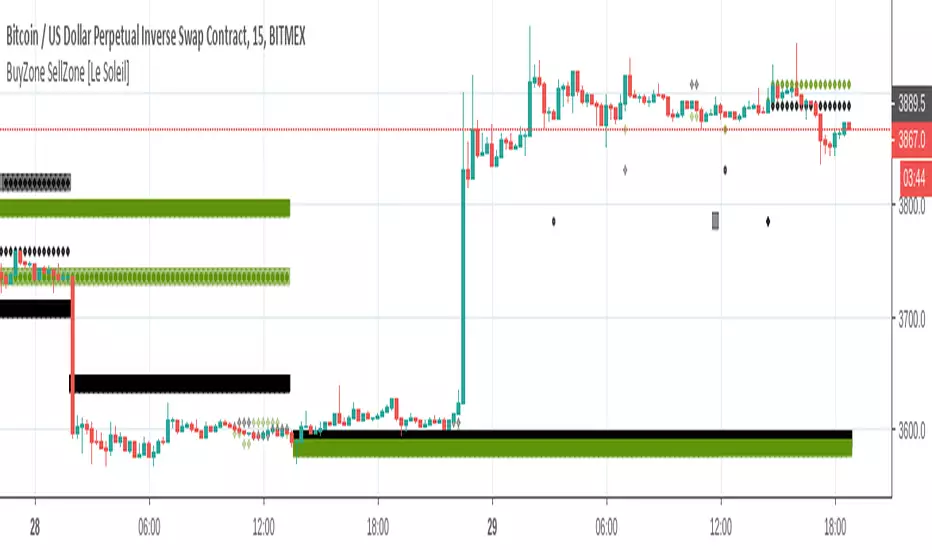
BuyZone SellZone [Le Soleil]Show buy zone, sell zone. You can use it for trade and margin. It is really useful and more effective than Support Resitance line. Like and follow me if you like it.
Support and Resistance Levels (Volume) Script to create resistance levels, to find pivot points and accurate entry. On the smallest timeframes, the script shows the most accurate results.
Settings:
"Support / Resistance length" - the more, the less results, but more accuracy
"The number of candles on the screen" - screen length in bars for comfortable work

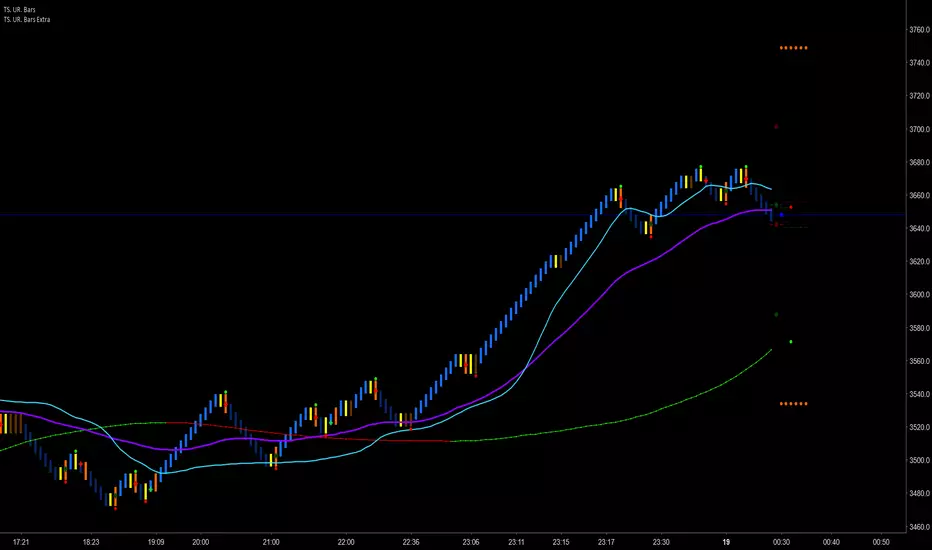
Trader Set - Uni Renko Bars ExtraThis is the separated script from original Uni Renko script. The main reason for this separation is that Trading View limits the user on plotting stuff to 64 plots, the Uni Renko script was so full that even a single more plot was impossible, so, separation came and now if i want to add any feature to this, it's possible.