{INDYAN} Boring and Explosive Candle -Demand & SupplyREAD:-Blue candle as boring/base candle and Black candle as explosive candle
FInd two explosive candle (Black) where two base/boring (Blue) candles are in between.
It will be marked as demand and supply zone.
Those who leant demand and supply will find this indicator usefull for findin and marking zones.
#When yuy find a Explosive candle , it become a potential demand and supply zone. It depens on second candle thou.
Thanks
Love INDYAN
Zona de Oferta

Candlestick Reversal SystemHello Traders,
In the book "Secrets of a Pivot Boss: Revealing Proven Methods for Profiting in the Market" by Franklin Ochoa, Four different types of reversal systems were introduced and candlestick patterns are used to find reversals. I will not write a lot about the book, you should get/read it for yourself. There are many great ideas in the book, Candlesetick Reversal System, Following Trend, Time Price Opportunity, Advanced Camarilla Concepts and much more.
Reversal systems mentioned in the book are :
- Wick Reversal System
- Exteme Reversal System
- Outside Reversal System
- Doji Reversal System
I tried to add these four reversal systems to the script. If you need detailed info you better read the book ;)
Enjoy!

Pivot TrendHello Traders,
Another original idea is here with you. Actualy I can say that it's a breakout strategy that uses multiple Pivot Point's averages.
How it works?
- it finds the Pivot Points, you can set the length as you want
- it gets averages of Pivot Highs and Pivot Lows, you can set the number of Pivot Points to be included
- it compares the current closing price with averages of Pivot Highs and Pivot Lows
- if both are positive or negative then trend changes
You have two options:
- Pivot Point Period => is the length that is used to find Pivot Points. means it checks left/right bars if it's Pivot Point (4 by default)
- Number of PP to check => is the number of Pivot Points that the script finds and calculates the averages (3 by default)
An Example with the settings Pivot Point Period = 5 and Number of PP to check = 2
Play with settings as you wish. Comments are welcome, together we can improve it ;)
Enjoy!
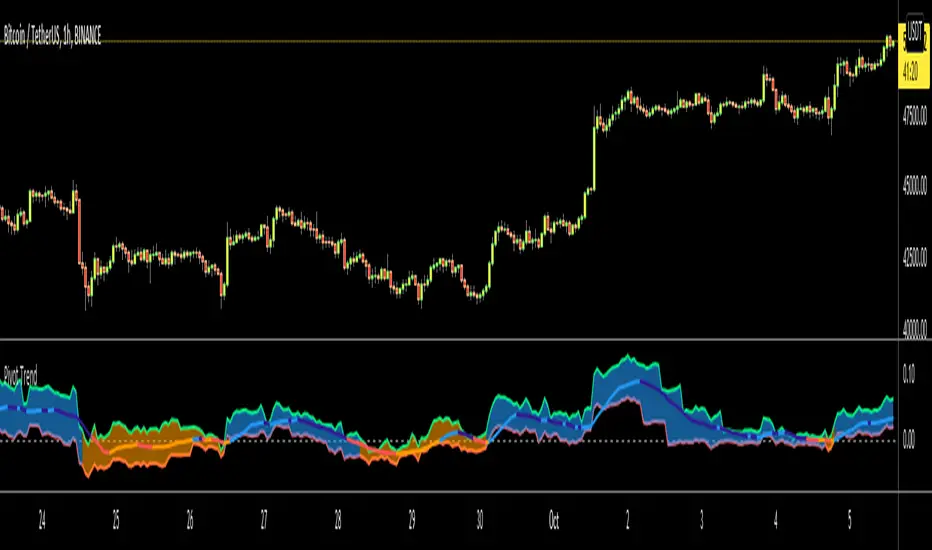
Donchian Trend RibbonHello Traders,
I think you all know Donchian Channels. so I am not going to write about it.
With this indicator I tried to create Donchian Trend Ribbon by using Donchian Channels.
How it works ?
- it calculates main trend direction by using the length that is user-defined. so you can change it as you wish
- then it calculates trend direction for each 9 lower lengths. if you set the length = 20 then the lengths are 19, 18,...11
- and it checks if the trend directions that came from lower lengths is same or not with main trend direction.
- it changes the trend color of the ribbon.
-
Warning: Entry points may also represents trend reversal. So you should use stoploss line if you decide to take buy/sell positions.
P.S. I didn't backtest it, it's non-repainting, it should be used educational purposes only.
Published by user request. You may want to see following one:
Enjoy!

Demand Supply Zone IndicatorThe Demand Supply Zone indicator helps in identifying the Demand Supply zones on chart by pinpointing them. The indicator looks for patterns of Drop-Base-Rally and Rally-Base-Rally and when such pattern is available the indicator marks it as DZ ( Demand Zone ). Likewise, if the indicator finds a pattern of Rally-Base-Drop or Drop-Base-Drop the indicator marks it as SZ ( Supply Zone ). The basing candles are changed to Blue color and the Legout candle is changed to Black color.
The setting for legout strength can be customized as follows
1 – Good Legout Strength
1.5 – Strong Legout Strength
2 - Very Strong Legout Strength
The setting for number of candles in the basing can be customized from 1 to 6.
Use the link below to obtain access to this indicator.

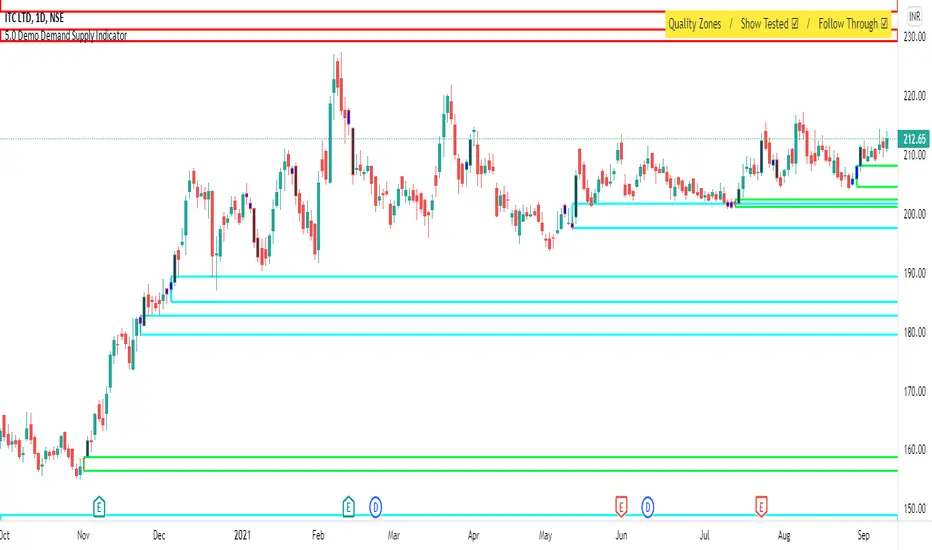
Demo - Demand Supply Zone IndicatorDemand Supply Zone indicator automatically pin points the demand and supply zone on the charts. The demo version will only identify zones on daily timeframe.
Explosive Move IndicatorThe indicator changes the color of explosive candles to black, this helps in identifying zones for Demand Supply Trading methodology.

Boring CandleThe indicator changes the color of boring candles to blue, this helps in identifying basing for Demand Supply Trading methodology.

BTC circulating supply [peregringlk]Just as simple as it sounds. The BTC circulating supply, deduced by using BTC_capitalization / BTCUSD.

Trend Lines for RSI, CCI, Momentum, OBVHello Traders!
After publishing Trend Lines for RSI yesterday, I realized that Trend Lines for more indicators needed by the traders. so I decided to make it for four different indicators: RSI, CCI, OBV, Momentum
In the indicator options you can choose the indicator from pull-down menu.
How it works?
- On each bar it finds last 10 higher and lower Pivot Points (PP) for the indicator.
- from first bar to 10. Pivot Point it searchs if a trend line is possible
- for each PP it starts searching from the last PP .
- it checks if drawing a trend line possible or not and also it's broken or not
- if it's broken then optionally it shows broken trend lines as dotted (or you can option not to see broken lines)
- if it finds a continues trend line then it stops searhing more and draw trend line, this is done by checking angles (I did this to make the script faster, otherwise you may get error because of it needs time more than .2sec)
- the script makes this process for each PP
- then shows the trend lines
P.S. it may need 3-10 seconds when you added the script to the chart at first (because of calculations)
Trend lines for CCI:
Trend Lines for OBV
Trend Lines for Momentum:
You may want to watch how Trend Lines script works (that was made for RSI)
s3.tradingview.com
If you still didn't see Trend Lines v2 then visit:
All Comments are welcome..
Enjoy!

Supply Demand [ThanhNg369]Hi,
This indicator will displays the majors Demand and Supply (NOT TESTED) in your chart.
It's also contains 3 Moving Average. You can choose different types of Moving Average between: EMA, SMA, WMA, VWMA.
Very easy to use.
Like and follow me if you like it.

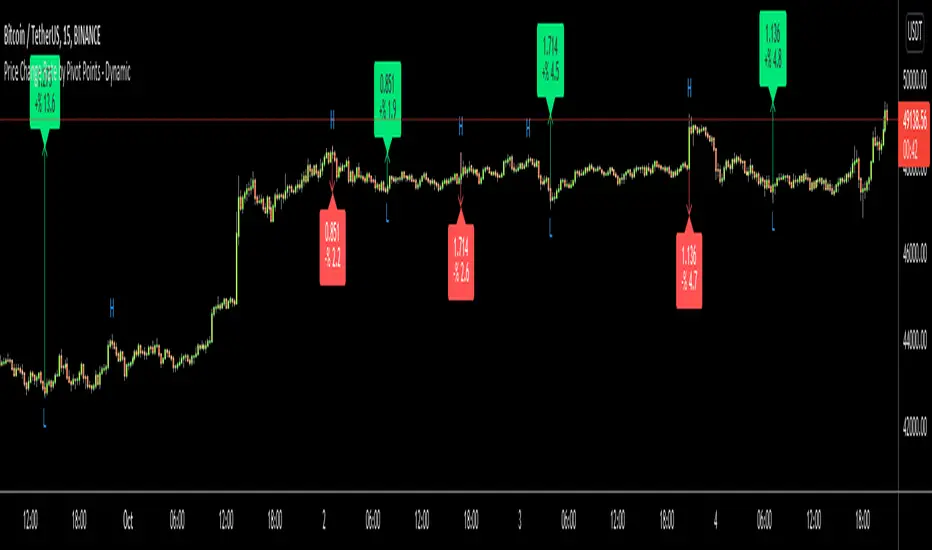
Price Change Rate by Pivot Points - DynamicHi Everyone
Usually I need Price Change info and I believe most of you need this info too. I want to see how it increased/decreased. I automate this by using Pivot Points.
it works dynamically and it uses Pivot Highs and Pivot Lows accordingly. That means it calculates which one to use.
Please watch following video:
Enjoy!
Trend Lines v2Hello Everyone. After working on new and better trend lines script for couple of weeks, finally I am proud to publish Trend Lines v2.
How it works?
- On each bar it finds last 10 higher and lower Pivot Points (PP).
- from first bar to 10. PP it search if a trend line is possible
- for each it starts searching from the last PP.
- it check if drawing a trend line possible or not and also it's broken or not
- if it's broken then optionally it shows broken trend lines as dotted
- if it finds a continues trend line and stop searhing more and draw trend line (I did this to make the script faster, otherwise you may get error because of it needs time more than .2sec)
- the script makes this process for each PP
optionally trend lines may be Solid or Dashed
optionally you may get rid of broken trend lines if you think it's crowded
and sometimes you may not see any trend line on the chart. this means you need to adjust the period for Pivot Points accordingly
also I made a video. if you watch this video you can see how the script works.
Important! after you add this tool to the chart you may need zoom-in and zoom-out to see all lines!
I thought a lot to make it free or not then I decided make it free and open source. you should know there is a lot of effort for this script, so if you think this is usefull please consider a donation ;)
Enjoy!

Eric Smith Supply and Demand V3Supply Demand, look back limited for now until Tradingview supports arrays.
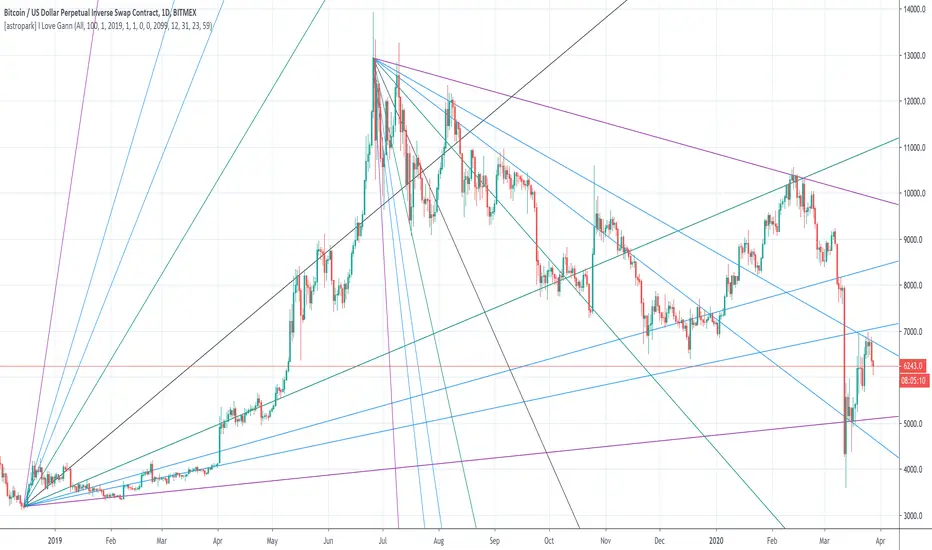
[astropark] I Love GannDear Followers,
yet another great tool! Gann was historically a great trader, who strictly followed his theory and died so rich!
Gann Fan is a great indicator: it draws a series of trendlines from important highs and lows in the chart and, as you will see from the chart itself, price action feels those trendlines, which acts as support and resistance !
Once a trendline is broken up, price tends to go upper to the next one, while the contrary happens when a trendline is broken down.
Here an example on BTCUSD:
Here an example on EURUSD:
This indicator
draws for you the Gann Fan, you don't need to do anything !
works on both cryptocurrencies, stocks and forex charts
works on every timeframe, but I suggest you to use it on high timeframes, where it's more reliable
lets you select the starting and the ending day-time from which and to which you want to see gann fans
lets you make trendlines be drawn dashed if you like, as well as you can edit their width
Divergence for many indicator v3Hello Everyone. Almost one year later, with Pine version 4, I developed new version of the Divergence for many Indicator.
It analyses divergences for 10 predefined indicators and then draws line on the graph. Red for negatif divergence (means prices may go down or trend reversal), Lime for positive divergences (means prices may go up or trend reversal)
Divergences version 2 has latency because it waits higher time frame completion. in this new version the script uses Pivot Points and on every bar it checks divergence between last Pivot point and current bar and if it finds any then immediately draws line and removes old one. so there is no latency with this version.
There are predefined 10 indicators in the script, you have option to choose which indicators the script would analyse for divergence. (RSI , MACD , MACD Histogram, Stochastic , CCI , Momentum, OBV, Diosc, VWMACD and CMF)
In replay mode you can see how the script puts new divergence line and removes old one. you better see it for yourself by using replay mode.
Hope you Enjoy!

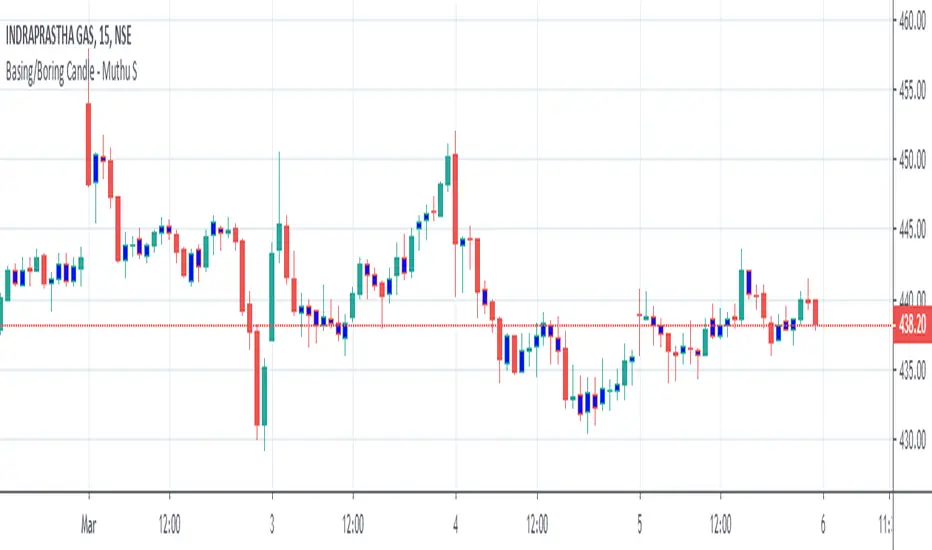
Boring Candle - Muthu SThis Indicator marks Boring Candle on the chart based on the input ATR Range.
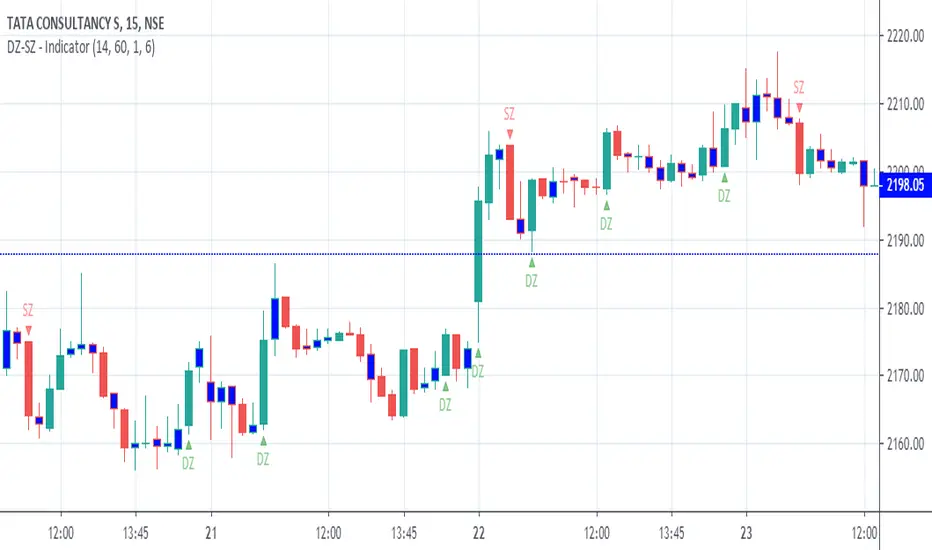
DZ-SZ - IndicatorThis indicator marks Demand and Supply Zone on the chart based on various inputs like ATR Range, Legout strength, Boring candle etc. It also marks Boring candle in Blue colour.
Prior knowledge of Demand and Supply Zone is mandatory to use this indicator effectively.
Kindly do your own math (based on your experience & knowledge) to identify the zones along with this indicator.
Pivots (CPR) - Daily, Weekly & Monthly (only for Indraday) Hi all Dear users,
Here, I have shared my CPR script on Daily, Weekly & Monthly basis. which will only works on intraday time frames. Best time frames recommended are 3,5 &15.
This will be very useful for intraday trades. And also it has more customizing options.
The features are:-
================
- Have an option to use only Daily pivots.
- Have an option to check tomorrow pivot ( After day closing).
- You can customize each and every style and colors.
- It also contains Previous day High, Previous Week High & Previous Month High.
- You can Show or Hide daily weekly Monthly and highs too.
Please share this AMAZING INDICATORS others.

[PX] Lookback LevelHey guys,
this indicator detects support and resistance level based on the number of times a level got tested in a certain range.
How does it work?
In the user input settings, you will be able to choose between two modes "Tested Level" and "Untested Level".
"Tested Level" will be detected by the number of times a certain low or high got tested in the "Lookback"-range, while fitting in the "Deviation"-range of the specific high or low. A crossing of the level is allowed. The "Untested Level" work the same way, but crossings of the level will eliminate it.
The indicator is highly dependent on which input you will use. Please play around with the settings and see how it works on different timeframes and symbols.
As always, it comes with styling options for the levels.
If some of you find it useful, please leave a like and hit the follow button :)
Happy trading,
paaax

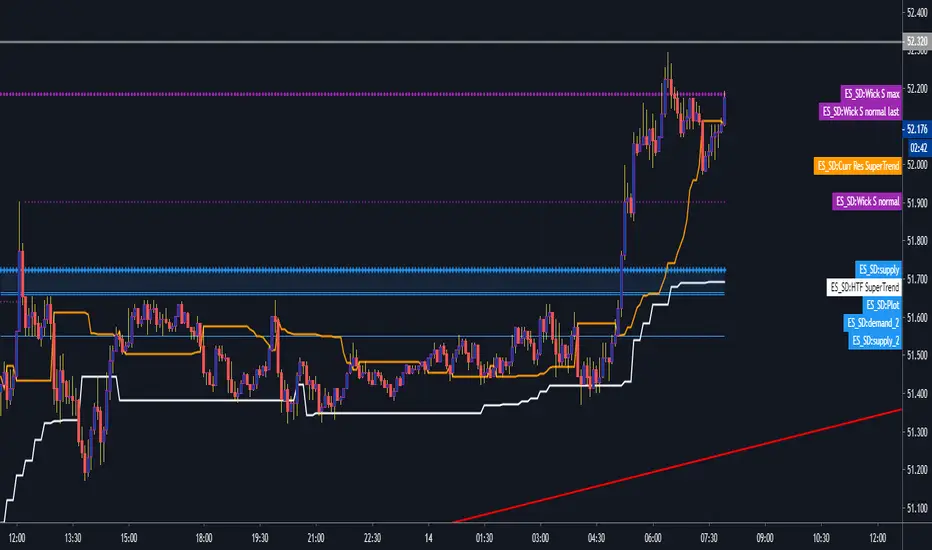
[astropark] Breaker Blocks, Supply Demand Order BlocksDear Followers,
today a new powerful indicator! Welcome to the great world of Breaker Blocks (BB) and Supply-Demand Order Blocks !
So what's the point? As always, the point is how to trade as safer as possible!
Breaker Blocks are price ranges where you simply have to wait for a pullback and sell-buy on its touch and price bounce, like in the screenshot below:
Supply and Demand are very important concepts, synonymous of Support and Resistance in most cases.
You should never sell whenever near a demand/support zone, unless price breaks through it as too weak. The same for supply/resistance: you should not buy near resistance, as most times you may start a trade with very high losing risk.
Here a screenshot how indicator works showing supply and demand order blocks (just enable them from indicator's option):
This indicator
can analyze chart based on high-low candle prices or open-close one
can show you Breaker Blocks (BB)
can show you Supply & Demand Order Blocks (OB)
lets you decide if you want to see high-low or open-close range of each OB
lets you edit the analysis window
lets you see local tops and bottoms of price as labels
This is a premium indicator , so send me a private message in order to get access to this script .

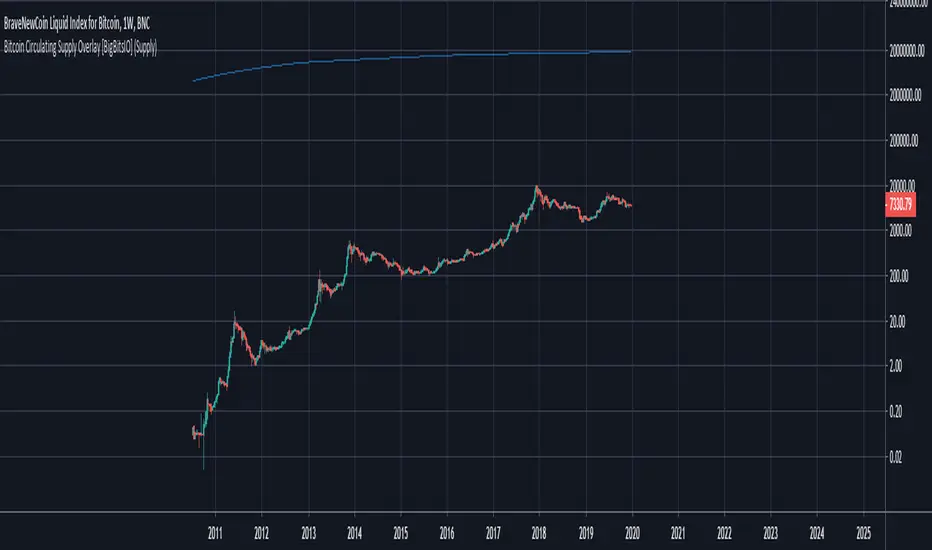
Bitcoin Circulating Supply Overlay [BigBitsIO]This script shows the estimated circulating supply of Bitcoin on any given day.
Features:
- Estimated Bitcoin circulating supply calculated daily
- Uses the Bitcoin reward schedule, past halving dates, and the next upcoming halving estimated date to calculate the current estimated supply.
- Optionally includes an option to use "Log Reduction" on the chart
*** DISCLAIMER: For educational and entertainment purposes only. Nothing in this content should be interpreted as financial advice or a recommendation to buy or sell any sort of security or investment including all types of crypto. DYOR, TYOB. ***
[PX] VWAP Gap LevelHello guys,
another day, another method for detecting support and resistance level. This time it's all about the VWAP and daily gaps it might produce.
How does it work?
The indicator detects when a new daily candle begins and the VWAP makes a big move in either direction. Often it produces a gap and this is where the support or resistance level will be plotted. The idea behind it is, that those gaps get filled at some point in time. You can control how big a VWAP movement ("gap") has to be with the "VWAP Movement %" -setting. Also, you can adjust the style of the level.
If you find this indicator useful, please leave a "like" and hit that "follow" button :)
Have fun and happy trading :)))
