Gold 1&5 Min Trading Strategy [TradingFinder] XAU Scalper Signal🔵 Introduction
Scalping in financial markets is based on immediate price reactions and precise analysis of price action behavior. In this trading approach, the trader must identify signals that originate directly from market structure, momentum shifts, candlestick formations, and the position of price relative to key zones.
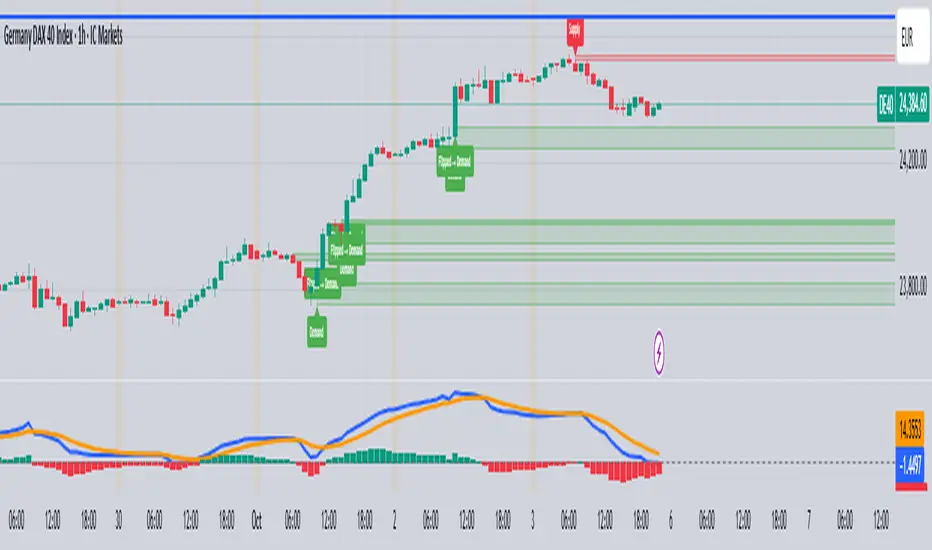
Supply and demand areas serve as the primary regions of order concentration and form the foundation of scalping analysis, since they provide the most accurate representation of balance or imbalance between buyers and sellers as well as the active flow of liquidity in the market.
In demand zones, price reactions usually begin with the formation of reversal or continuation candlestick patterns. These patterns include structures such as Pin Bar, Engulfing, Doji, Failure, Rejection, and other forms of false breakout behavior, each of which can indicate a potential short term change in direction.
Liquidity plays a central role in these reactions, because price entering a demand zone typically coincides with the absorption of sell side liquidity and the restoration of order flow. This process often leads to rapid movements that are suitable for scalping. Therefore, combining candlestick confirmation with the location of price inside a supply or demand zone is one of the most reliable methods of identifying low risk scalping signals.
Demand zones include several structural variations, each representing a different form of liquidity behavior. One of the most well known examples is the order block, which is the final bearish candle before a strong bullish movement and indicates the presence of unfilled buy side interest.
Another important structure is the Fair Value Gap, which appears when a price void forms across three consecutive candles due to a lack of liquidity during the moment of displacement. The market often returns to this area to restore balance. Imbalance structures also represent one sided pressure in order flow where the market reacts later to correct these inefficiencies.
Breaker structure is another key element in demand analysis. A breaker is formed when an order block is violated and price returns to the same level after collecting liquidity, then continues in the opposite direction. This pattern often appears near liquidity based highs or lows and reflects a shift in the strength of market participants.
Together, order blocks, Fair Value Gaps, imbalances, and breakers form the core of demand analysis in price action and are widely used in precise scalping strategies due to their strong connection with liquidity and the high predictability of price reactions within them.
Bullish Setup :
Bearish Setup :
🔵 How to Use
This strategy is built on price action analysis, market reactions inside supply and demand zones, and confirmation through candlestick patterns. The first step is to identify key areas such as order blocks, Fair Value Gaps, imbalances, or breakers.
After these zones are located, price behavior within them is examined using candlestick structure and momentum direction. Entries are taken only when price reaches a validated zone, a clear sign of liquidity absorption or injection appears, and a confirming candlestick forms inside the zone.
This approach allows the trader to capture fast and precise entries during moments when the market is actively reacting to decision points.
🟣 Long Setup
In the buy setup, a valid demand zone must first be identified. This can be a bullish order block, an unfilled bullish Fair Value Gap, an imbalance at the lower part of structure, or a bullish breaker. When price enters this zone and shows signs of absorbing sell side liquidity, candlestick behavior must be examined.
Formation of reversal signals such as a Pin Bar with a long lower wick, bullish Engulfing, Rejection Candle, or a false breakout of the low, indicates a favorable shift in order flow. After receiving candlestick confirmation, a buy entry is taken within the same zone and the stop level is placed below the liquidity boundary. Targets are typically based on filling gaps, reaching supply zones, or returning to structural means.
🟣 Short Setup
In the sell setup, a valid supply zone must be recognized. This may include a bearish order block, a bearish Fair Value Gap, an imbalance at the upper part of structure, or a bearish breaker. When price enters this zone and liquidity accumulates above nearby highs, the probability of a fast momentum shift increases.
Confirmation occurs when a bearish reversal pattern forms such as Engulfing, Pin Bar with a long upper wick, indecisive Doji followed by rejection, or a false breakout of the high. After confirmation, the sell entry is placed and the stop level is set above the liquidity zone. Targets are selected based on filling lower Fair Value Gaps, reaching demand zones, or returning to structural midpoints.
🔵 Settings
Last Candle in Signal Direction : When On, a signal is issued only if the last candle moves in the direction required by the signal.
Signal in Nearly Zone : When enabled, the signal becomes valid even if the candle is near the zone rather than strictly inside it. When disabled, only signals formed inside the zone are allowed.
Allow Both Side Signals : When On, signals from both sides of the structure can be issued even if a limiting level exists. When disabled, only signals that do not violate the limiting level are allowed.
🔵 Conclusion
Using price action, supply and demand zones, and candlestick confirmation alongside liquidity analysis creates an effective framework for identifying fast market reactions in scalping conditions. Focusing on structures such as order blocks, Fair Value Gaps, imbalances, and breakers allows the trader to recognize shifts in momentum and changes in order flow with greater precision.
In this approach, entries are taken only when price reaches a validated zone, liquidity behavior is observable, and the confirming candle forms at the correct location. This leads to organized, low risk scalping signals that are aligned with the real time behavior of the market.
Indicador Pine Script®