Stoploss

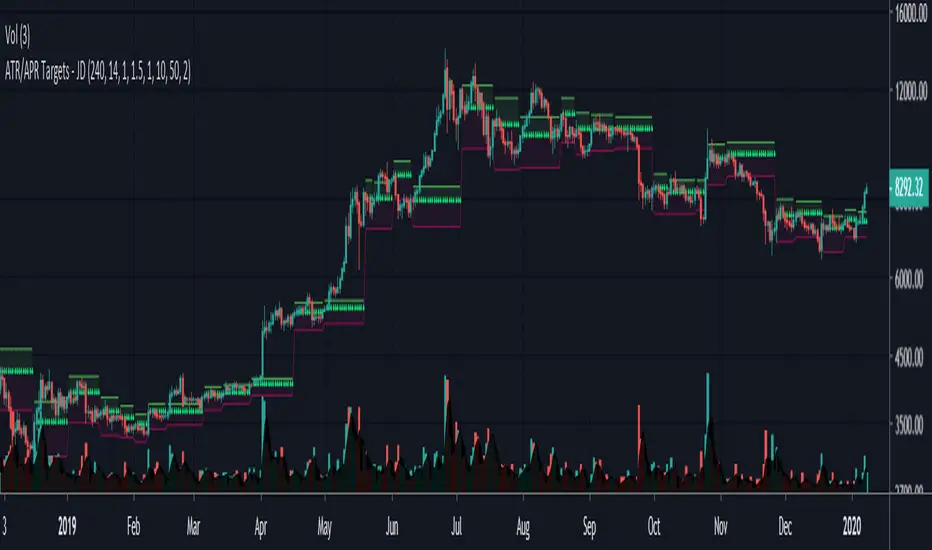
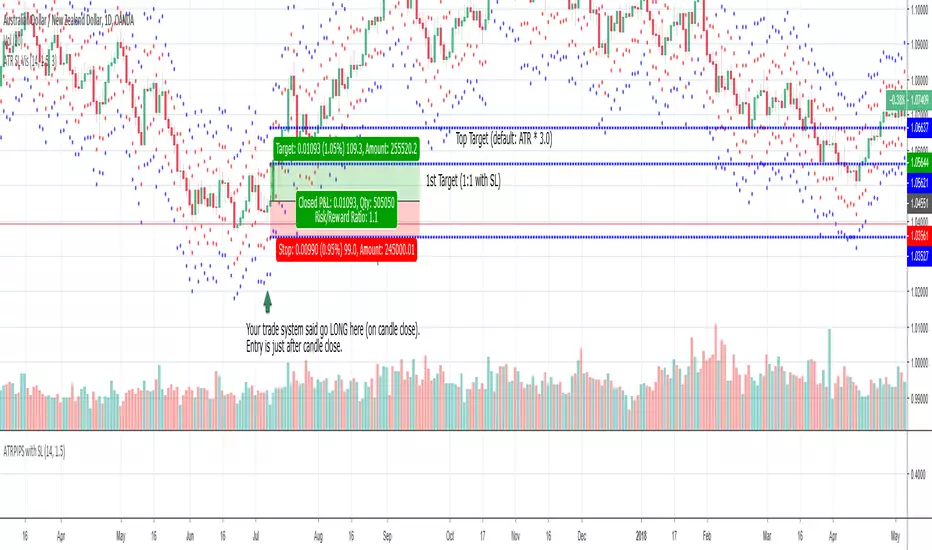
ATR Targets - JDA simple visual representation of ATR trading targets.
The indicator shows ATR targets (TP and SL) from the last swing points (if you entered there)
There is an option to chose targets for a long or short position.
JD.
#NotTradingAdvice #DYOR
I build these indicators for myself and provide them open source, to use for free to use and improve upon,
as I believe the best way to learn is toghether.
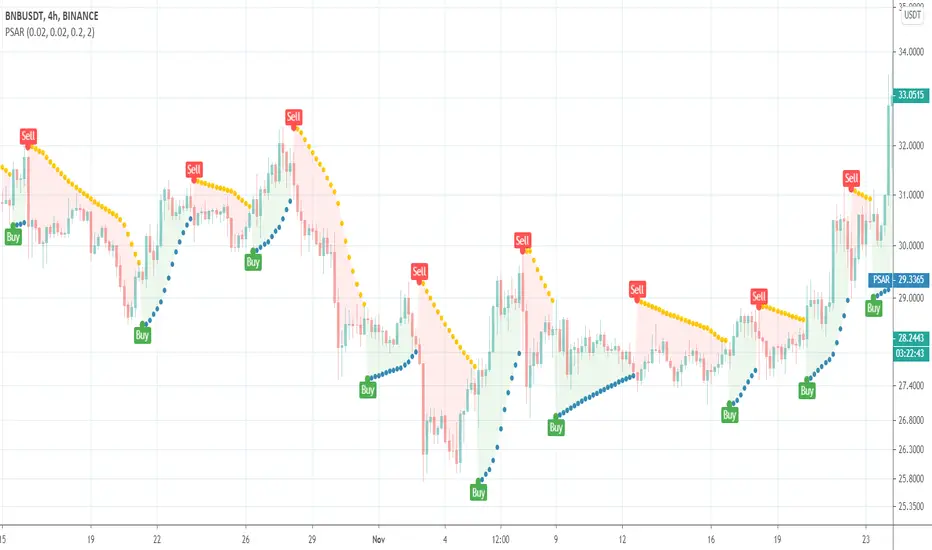
Parabolic SARThis is a redesign of the built-in Parabolic SAR indicator. I added a proper input system, an option to highlight initial points for both lines and an option to choose points width. So, customize it as you want.
Parabolic SAR was originally developed by J. Welles Wilder and described in his book "New Concepts in Technical Trading Systems" (1978). It is a trend-following indicator that can be used as a trailing stop loss.
To know which settings for PSAR are the most profitable on your instrument and timeframe you can use this tool
Profitable Parabolic SAR
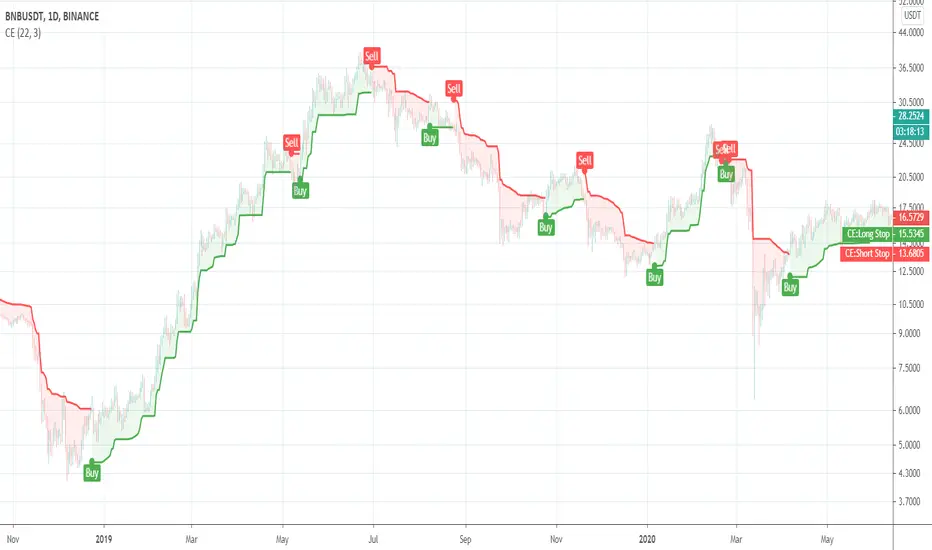
Chandelier ExitThis is a redesign of the Chandelier Exit indicator. It removes stupid transitions between Chandelier Exit' states and highlights initial points for both lines.
This indicator was originally developed by Charles Le Beau and popularized by Dr. Alexander Elder in his book "Come Into My Trading Room: A Complete Guide to Trading" (2002).
In short, this is a trailing stop-loss based on the Average True Range (ATR).
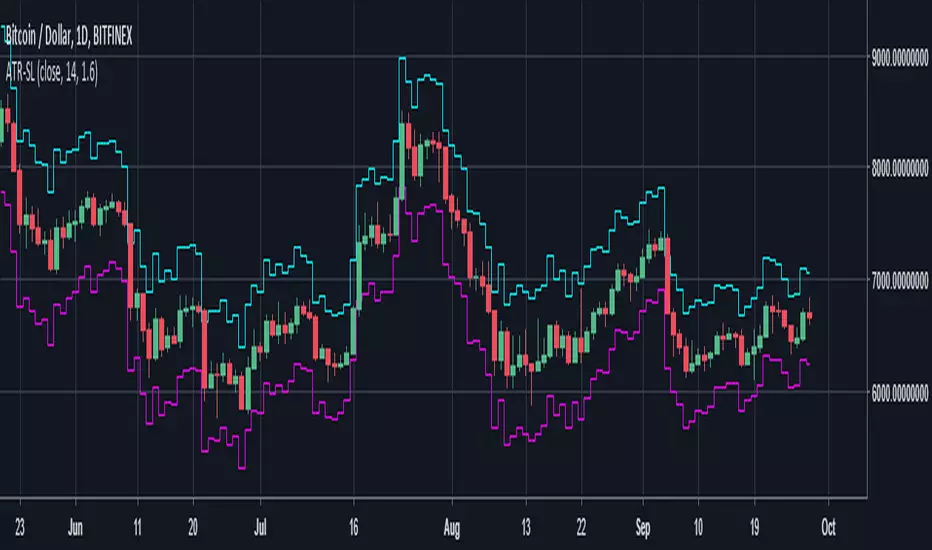
ATR SL Visualization (on chart)This indicator plots 2 sets of dots (and lines) based on your chosen ATR multiplier (Average True Range).
Generally, when trading on the daily timeframe a good rule of thumb is to use the ATR * 1.5 (the default setting of this indicator).
I created this indicator to quickly test other indicators but I also find it helpful in live trading.
How to use this indicator:
Your trade system provides an entry signal. The red dot (can be connected line in options) would be used as the stop loss for either a long or short.
Then the dot on the other side would be your first 1:1 target.
The blue line is the same ATR multiplier as a target (default but can be modified).
Using an additional tool like the horizontal ray can be helpful to see the exact location the SL might be hit or where the target might hit.
When drawing your ray ensure you’re using the right entry candle.
For instance, in a long scenario you would typically be entering a trade after your signal candle closes. So draw the ray at the point in price on the next candle for both stop loss and target.
Also use these dots (lines) as guides provides an easy way to plot SL and targets if you want to use the Long or Short tool.
For my trade systems I don’t use price targets (I exit when structure or indicators reveal to exit) but I do find it helpful to graph when testing. When something moves in my favor either the ATR or the ATR * 1.5 I take profit and typically move up my stop loss to break even or trailing.
The other strategy that could be possible but have not tested is as long as the SL is making a new high moving up a hard stop to the ATR SL each day the trade goes in your favor.
This should be obvious but if you want to use just the true ATR edit the multiplier to be 1.0
Average True Range (ATR %) Stop Loss CalculatorThis indicator takes the average of a series of ATR to calculate what I would consider an optimum stop loss placement represented in percentage (read below for full overview).
While the data is plotted what is most helpful are the actual numbers presented and for my charts I remove most of the plotting.
This indicator is most helpful on the daily timeframe but can be used for all timeframes such as the 4HR, 1HR or even 15M.
This indicator should not be used alone. It should be used in conjunction with proper price action analysis. It’s also a great indicator if you chart using Value Channels. Ideally you want your stop placement to be below at least one core Value Channel boundary range. In addition to standard support and resistance and some key moving averages the market respects. This also works best when trading with the prevailing BIAS of the instrument (bull or bear).
Cryptos: Generally, that means you’re buying on retracements that fit the end of a structured move. The other option is using this in a clear up trending market where the pull backs are clearly being supported with buying.
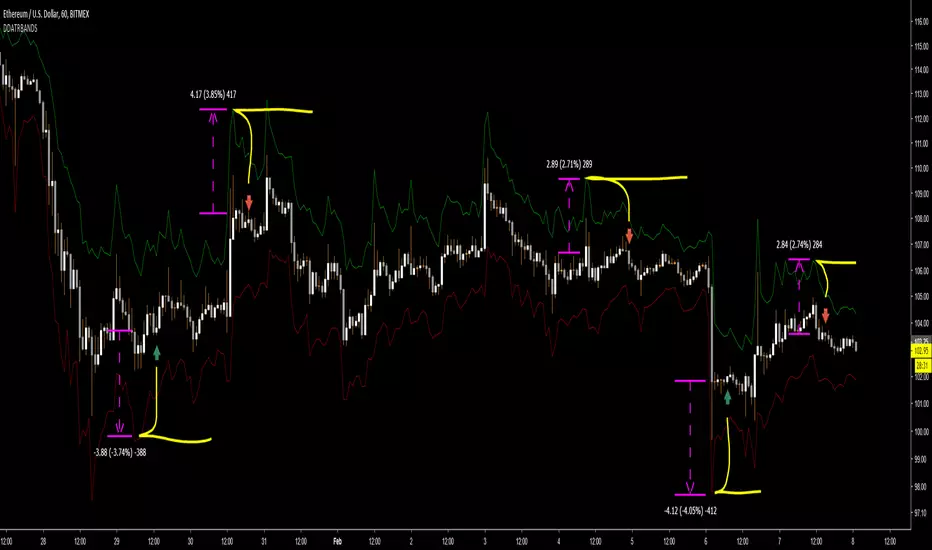
FOREX: I built another indicator for FOREX search: ATRPIPS with SL
WTI: Helpful but I have different rules for when I trade WTI. I rely upon VCs and diagnal VCs much more when trading this.
Equities: Helpful but with the increase of volatility as well as uncertainty of Bias of the market-- this should be used as more of a guide than
What is most important is the actual percentage numbers but I've found graphing 1-3 of the actual ATRs is helpful. The rest just uncheck the checkbox in the options.
Indicator Overview:
Value 1 - 3 Period ATR (maroon)
Value 2 - 7 Period ATR (green)
Value 3 - 30 Period ATR (blue)
Value 4 - 90 Period ATR (blue, bold)
Value 5 - 1 Period ATR (green)
Value 6 - 1 Period ATR (red)
Value 6 – Prime Stop Loss Placement (maroon). This is the average of all above ATRs multiplied by 1.5
Value 7 - Move Left (red). Experimental value. This is the difference between (prime stop loss) and 1 day period move. Two ways to use this value. Use as a tighter stop loss placement. The other option is to use as a retrace target for purchase and using the Prime Stop Placement value as you’re stop loss.
All ATRs use the LOW price of the period. After testing both the low and close I’ve settled on the low to capture the most volatility you will typically experience.
Once again, this indicator should be used in conjunction with your proven trade system.
Also, by knowing what the values are within the indicator you could just eye ball what would be the best stop placement depending on the ATR or 1 or 2 ATRs you find most represent the volatility of what you are trading.
I will be expanding on this indicator by bringing in average measured moves as well as volume analysis and most likely with color changes and modifications.
Background:
While using and refining my trade system I've noticed that most moves happen in 3 periods. So we start there. The 7 period is good for a 24 hour market such as crypto (although weekend trading can be a hit or miss) and to some extent FOREX. The longer periods of 30 & 90 are to smooth out the data set. The final value of the 1 period is to bring a little more recency to the calculation.
Why multiply the average by 1.5? I've found in my own trading and system I built to be the best placement (in conjunction with VCs) to ensure you're stop isn't to close and is within the instrument you are trading volatility .
I'm looking at making this more intelligent as well as take into account volume and structured moves.

DD ATR bandsThe top band is ATR added to candle high (with given length and multiplication). The bottom one is analogic.
Created for finding initial stop loss for entry on low timeframes. Use band value at last major high/low to place the stop loss at.
It shows prices with acceptable risk and a reasonable margin for market volatility.
ATR Pips with Stop LossThis indicator shares ATR pips and a calculated 1.5 x stop loss calculation.
1st number is ATR.
2nd number is ATR x 1.5 (a typical SL when trading daily time frame).
The plot lines are really not that important- it's the actual numbers.
What I do is uncheck the plot line checkboxes (ATR & SL) so it doesn't show up, that way I can reduce the indicator window.
This script is a modified script by ATR Pips . Kept the BB section for now as it might be useful, but doubt it.
Future updates:
- editable the multiple for SL
- static daily numbers (right now this shows the timeframe you are viewing, I'd keep that but add a static daily ATR so you have both)

DD ATR stop trailsATR based stop trails.
The top trail is basically lowest ATR since the last candle hit (with given length and multiplication) added to candle high.
The bottom trail is analogic.

LINEdicator - Trendanalysis toolThis indicator creates an trend channel based on an EMA/SMA combo and a Parabolc SAR indicator.
Watch for the peaks and the size of the red/green channel for possible trend change.
Can also be used as an Entry/Exit/Stop-Loss setting tool.

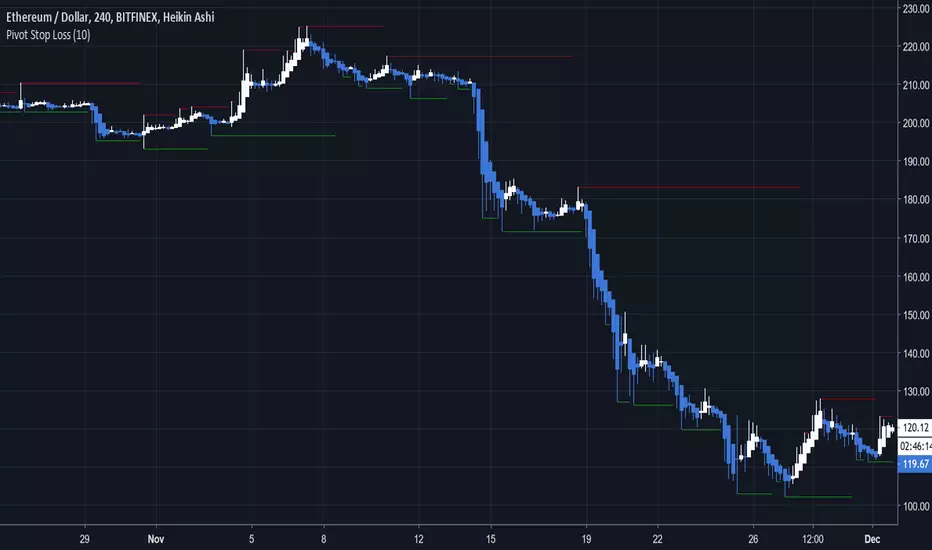
Pivot Stop LossHere we intend to use pivot points for stop loss and take profit. This has the added benefit of helping you to visualize support and resistance levels.
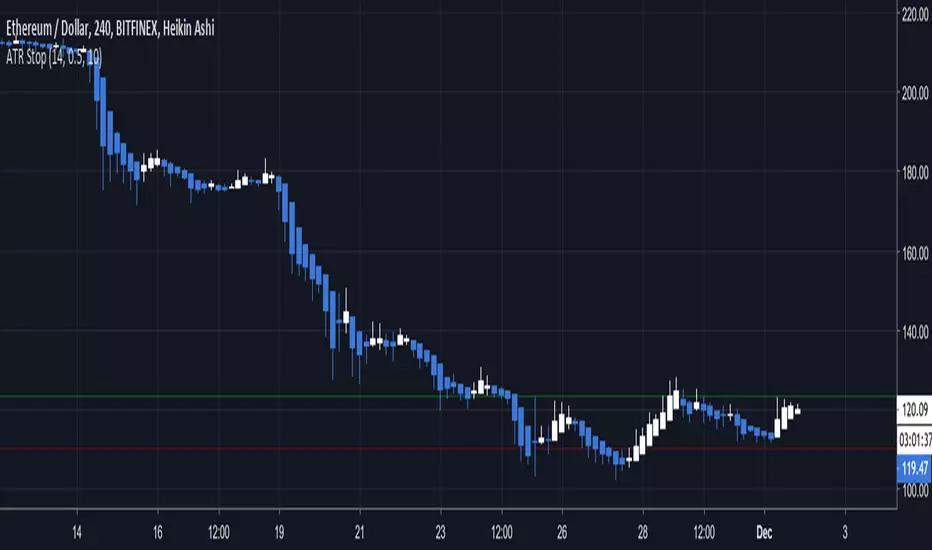
ATR Stop Loss VisualizerThis will help you figure out what stop loss settings work best for you. Some people might prefer ATR 14 * 0.5 for shorter timeframes, some might prefer more extreme settings such as ATR 30 * 2 to not get stopped out as often.

[ALERTS]Super-Trend & SL/TP V3This simple script analyzes the trend in real time...
Alerts, SL, TP, bla, bla, bla...


lamBOTghini-ALERTador & SL/TP V3I publish the code again in case someone is interested in learning. I am not an expert, I learned from others who published their scripts and for this reason I do the same.
If someone tries to sell you a script it is because they do not make money with it in trading and they need to sell it to earn something.
It is a simple combination algorithm of 3 EMA with stop loss and Take profit and with alerts.
Enjoy!
¡Mucho ánimo a los Venezolanos!
¡Saludos desde España!

ATR Trailing Stop Bands [R] This is based on the Average True Range Trailing Stops Strategy by Sylvain Vervoort, coded on TV HPotter. I have added Bands to see potential short and long stop loss zones before the indicator signals to switch itself, also changed color on the main Trailing Stop based on whether it is short or long, added increased stop loss hunt protection by combining with my Wickiness indicator to add Wick Protection, based on either Average or Maximum Wicks, to prevent your stop getting wicked out. Experiment with different timeframes according to your trading style and how long you like to hold a trade. This indicator does not intend to tell you when to take profit, just how to place your stop to give you the best chance of not getting stopped out too early and to minimise risk by trailing it safely.
May you all never be stop hunted again.
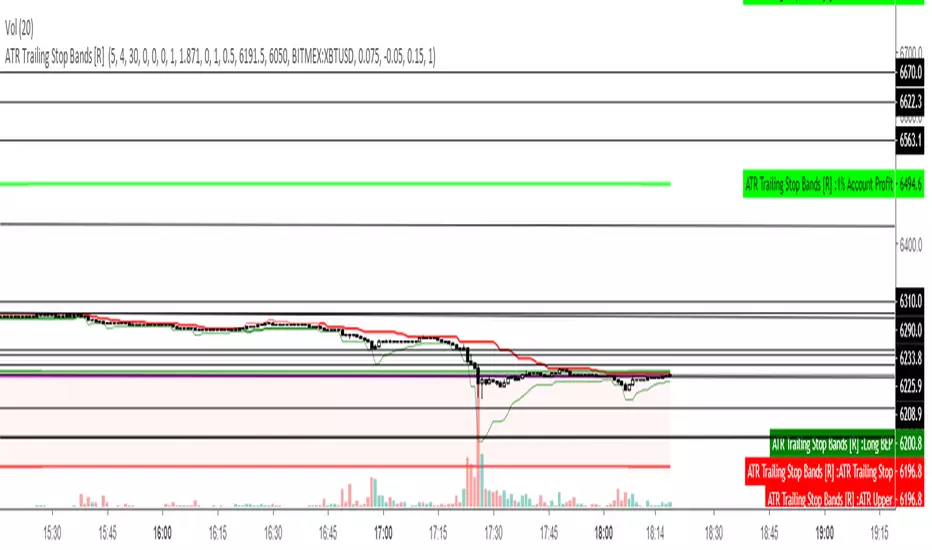
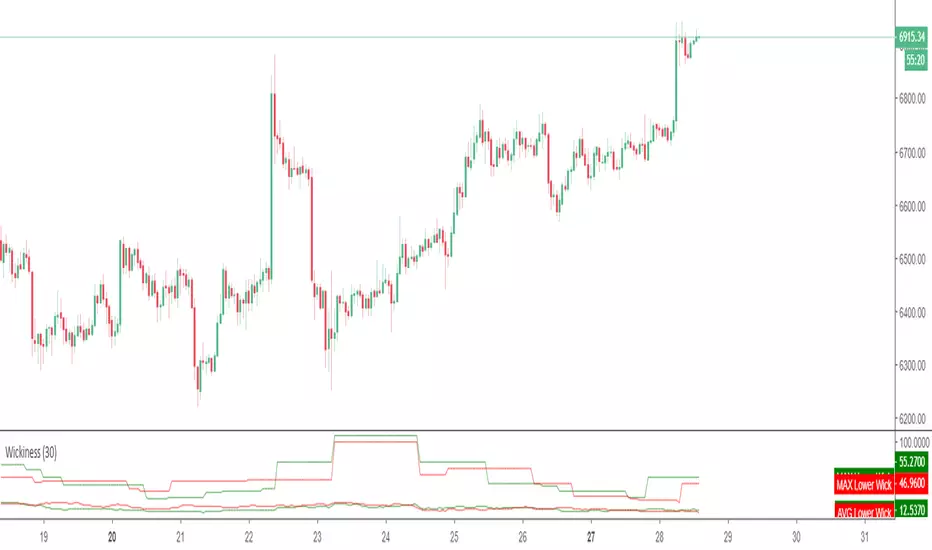
WickinessThis script measures the maximum and average length of upper and lower wicks. While this can be used as a volatility gauge and to see if there is more support or resistance, it's primary use is to not get wicked out on stops, by adding one of these numbers to the the Moving Average or S/R level that one is using for a Stop, plus maybe a few points of buffer.
Donchian Channel with Range AdditionA Donchian Channel with additional zones at places where its range is smaller than a set amount of atr. Thus it kind of combines with Keltner Channel qualities. Purpose is to set a stop loss wide enough to avoid shaking out of a position. The example chart shows a Philips day chart, where I opened position on 16 juli at 37,50 and set the stop loss at low border level 35,60, on 23 juli was an earnings rapport, the wick of the candle shows that quotes went very low, obviously smart traders had to fill a huge order and hunted for stops, triggering my stop closing the position. next days quotes went a lot better, so I missed the fun. The Donchian Channel was too narrow because quotes had ranged in the previous weeks. If I had placed my stop on the additional low, setting it 5 atr below the high border, my stop would have been safe.

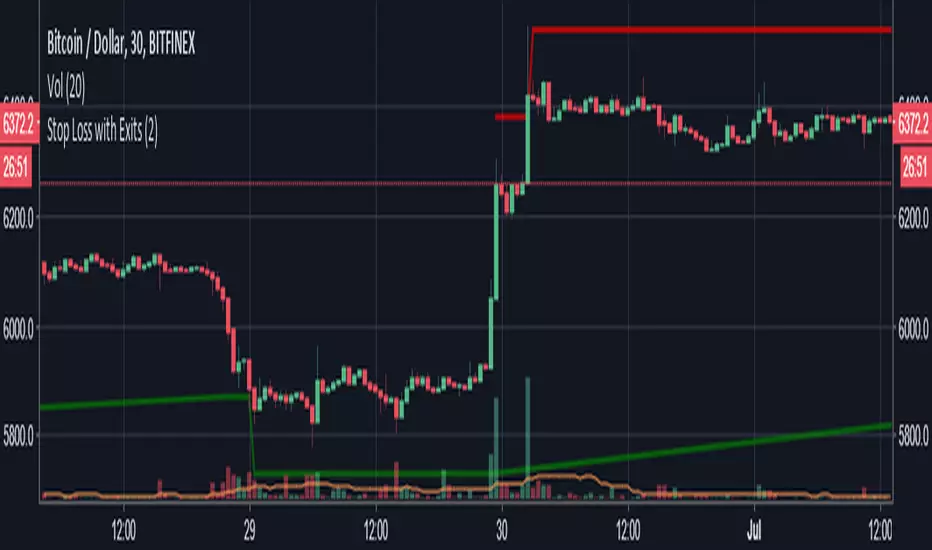
Stop Loss with ExitsStandard Percentage-based Stop Loss for long and short, with configurable extra exit conditions.
Just copy/paste into your script.
Uses "low" and "high" values for crossing the stop loss threshold, but can be changed to "close" if you prefer (change "low" and "high" on lines 31 and 32 to "close")
Double EMA with stop loss indicatorThis is an updated version of my previous stop loss script.
I've added a double EMA line and modified the stop as below;
In an uptrend....
1. a yellow dot will appear once it's time to move your stop. The yellow dot will display at the level of the stop loss. Place your stop 1 pip below the dot.
2. The yellow dot will only appear if a new higher low has formed and has been confirmed. Also the current candle must have broken the high of a previous bullish candle or the dot will not appear.
3. The dot will also appear if there is a likely reversal of the current trend.
Also works in downtrends.....