Support & Resistance AI (K means/median) [ThinkLogicAI]█ OVERVIEW
K-means is a clustering algorithm commonly used in machine learning to group data points into distinct clusters based on their similarities. While K-means is not typically used directly for identifying support and resistance levels in financial markets, it can serve as a tool in a broader analysis approach.
Support and resistance levels are price levels in financial markets where the price tends to react or reverse. Support is a level where the price tends to stop falling and might start to rise, while resistance is a level where the price tends to stop rising and might start to fall. Traders and analysts often look for these levels as they can provide insights into potential price movements and trading opportunities.
█ BACKGROUND
The K-means algorithm has been around since the late 1950s, making it more than six decades old. The algorithm was introduced by Stuart Lloyd in his 1957 research paper "Least squares quantization in PCM" for telecommunications applications. However, it wasn't widely known or recognized until James MacQueen's 1967 paper "Some Methods for Classification and Analysis of Multivariate Observations," where he formalized the algorithm and referred to it as the "K-means" clustering method.
So, while K-means has been around for a considerable amount of time, it continues to be a widely used and influential algorithm in the fields of machine learning, data analysis, and pattern recognition due to its simplicity and effectiveness in clustering tasks.
█ COMPARE AND CONTRAST SUPPORT AND RESISTANCE METHODS
1) K-means Approach:
Cluster Formation: After applying the K-means algorithm to historical price change data and visualizing the resulting clusters, traders can identify distinct regions on the price chart where clusters are formed. Each cluster represents a group of similar price change patterns.
Cluster Analysis: Analyze the clusters to identify areas where clusters tend to form. These areas might correspond to regions of price behavior that repeat over time and could be indicative of support and resistance levels.
Potential Support and Resistance Levels: Based on the identified areas of cluster formation, traders can consider these regions as potential support and resistance levels. A cluster forming at a specific price level could suggest that this level has been historically significant, causing similar price behavior in the past.
Cluster Standard Deviation: In addition to looking at the means (centroids) of the clusters, traders can also calculate the standard deviation of price changes within each cluster. Standard deviation is a measure of the dispersion or volatility of data points around the mean. A higher standard deviation indicates greater price volatility within a cluster.
Low Standard Deviation: If a cluster has a low standard deviation, it suggests that prices within that cluster are relatively stable and less likely to exhibit sudden and large price movements. Traders might consider placing tighter stop-loss orders for trades within these clusters.
High Standard Deviation: Conversely, if a cluster has a high standard deviation, it indicates greater price volatility within that cluster. Traders might opt for wider stop-loss orders to allow for potential price fluctuations without getting stopped out prematurely.
Cluster Density: Each data point is assigned to a cluster so a cluster that is more dense will act more like gravity and
2) Traditional Approach:
Trendlines: Draw trendlines connecting significant highs or lows on a price chart to identify potential support and resistance levels.
Chart Patterns: Identify chart patterns like double tops, double bottoms, head and shoulders, and triangles that often indicate potential reversal points.
Moving Averages: Use moving averages to identify levels where the price might find support or resistance based on the average price over a specific period.
Psychological Levels: Identify round numbers or levels that traders often pay attention to, which can act as support and resistance.
Previous Highs and Lows: Identify significant previous price highs and lows that might act as support or resistance.
The key difference lies in the approach and the foundation of these methods. Traditional methods are based on well-established principles of technical analysis and market psychology, while the K-means approach involves clustering price behavior without necessarily incorporating market sentiment or specific price patterns.
It's important to note that while the K-means approach might provide an interesting way to analyze price data, it should be used cautiously and in conjunction with other traditional methods. Financial markets are influenced by a wide range of factors beyond just price behavior, and the effectiveness of any method for identifying support and resistance levels should be thoroughly tested and validated. Additionally, developments in trading strategies and analysis techniques could have occurred since my last update.
█ K MEANS ALGORITHM
The algorithm for K means is as follows:
Initialize cluster centers
assign data to clusters based on minimum distance
calculate cluster center by taking the average or median of the clusters
repeat steps 1-3 until cluster centers stop moving
█ LIMITATIONS OF K MEANS
There are 3 main limitations of this algorithm:
Sensitive to Initializations: K-means is sensitive to the initial placement of centroids. Different initializations can lead to different cluster assignments and final results.
Assumption of Equal Sizes and Variances: K-means assumes that clusters have roughly equal sizes and spherical shapes. This may not hold true for all types of data. It can struggle with identifying clusters with uneven densities, sizes, or shapes.
Impact of Outliers: K-means is sensitive to outliers, as a single outlier can significantly affect the position of cluster centroids. Outliers can lead to the creation of spurious clusters or distortion of the true cluster structure.
█ LIMITATIONS IN APPLICATION OF K MEANS IN TRADING
Trading data often exhibits characteristics that can pose challenges when applying indicators and analysis techniques. Here's how the limitations of outliers, varying scales, and unequal variance can impact the use of indicators in trading:
Outliers are data points that significantly deviate from the rest of the dataset. In trading, outliers can represent extreme price movements caused by rare events, news, or market anomalies. Outliers can have a significant impact on trading indicators and analyses:
Indicator Distortion: Outliers can skew the calculations of indicators, leading to misleading signals. For instance, a single extreme price spike could cause indicators like moving averages or RSI (Relative Strength Index) to give false signals.
Risk Management: Outliers can lead to overly aggressive trading decisions if not properly accounted for. Ignoring outliers might result in unexpected losses or missed opportunities to adjust trading strategies.
Different Scales: Trading data often includes multiple indicators with varying units and scales. For example, prices are typically in dollars, volume in units traded, and oscillators have their own scale. Mixing indicators with different scales can complicate analysis:
Normalization: Indicators on different scales need to be normalized or standardized to ensure they contribute equally to the analysis. Failure to do so can lead to one indicator dominating the analysis due to its larger magnitude.
Comparability: Without normalization, it's challenging to directly compare the significance of indicators. Some indicators might have a larger numerical range and could overshadow others.
Unequal Variance: Unequal variance in trading data refers to the fact that some indicators might exhibit higher volatility than others. This can impact the interpretation of signals and the performance of trading strategies:
Volatility Adjustment: When combining indicators with varying volatility, it's essential to adjust for their relative volatilities. Failure to do so might lead to overemphasizing or underestimating the importance of certain indicators in the trading strategy.
Risk Assessment: Unequal variance can impact risk assessment. Indicators with higher volatility might lead to riskier trading decisions if not properly taken into account.
█ APPLICATION OF THIS INDICATOR
This indicator can be used in 2 ways:
1) Make a directional trade:
If a trader thinks price will go higher or lower and price is within a cluster zone, The trader can take a position and place a stop on the 1 sd band around the cluster. As one can see below, the trader can go long the green arrow and place a stop on the one standard deviation mark for that cluster below it at the red arrow. using this we can calculate a risk to reward ratio.
Calculating risk to reward: targeting a risk reward ratio of 2:1, the trader could clearly make that given that the next resistance area above that in the orange cluster exceeds this risk reward ratio.
2) Take a reversal Trade:
We can use cluster centers (support and resistance levels) to go in the opposite direction that price is currently moving in hopes of price forming a pivot and reversing off this level.
Similar to the directional trade, we can use the standard deviation of the cluster to place a stop just in case we are wrong.
In this example below we can see that shorting on the red arrow and placing a stop at the one standard deviation above this cluster would give us a profitable trade with minimal risk.
Using the cluster density table in the upper right informs the trader just how dense the cluster is. Higher density clusters will give a higher likelihood of a pivot forming at these levels and price being rejected and switching direction with a larger move.
█ FEATURES & SETTINGS
General Settings:
Number of clusters: The user can select from 3 to five clusters. A good rule of thumb is that if you are trading intraday, less is more (Think 3 rather than 5). For daily 4 to 5 clusters is good.
Cluster Method: To get around the outlier limitation of k means clustering, The median was added. This gives the user the ability to choose either k means or k median clustering. K means is the preferred method if the user things there are no large outliers, and if there appears to be large outliers or it is assumed there are then K medians is preferred.
Bars back To train on: This will be the amount of bars to include in the clustering. This number is important so that the user includes bars that are recent but not so far back that they are out of the scope of where price can be. For example the last 2 years we have been in a range on the sp500 so 505 days in this setting would be more relevant than say looking back 5 years ago because price would have to move far to get there.
Show SD Bands: Select this to show the 1 standard deviation bands around the support and resistance level or unselect this to just show the support and resistance level by itself.
Features:
Besides the support and resistance levels and standard deviation bands, this indicator gives a table in the upper right hand corner to show the density of each cluster (support and resistance level) and is color coded to the cluster line on the chart. Higher density clusters mean price has been there previously more than lower density clusters and could mean a higher likelihood of a reversal when price reaches these areas.
█ WORKS CITED
Victor Sim, "Using K-means Clustering to Create Support and Resistance", 2020, towardsdatascience.com
Chris Piech, "K means", stanford.edu
█ ACKNOLWEDGMENTS
@jdehorty- Thanks for the publish template. It made organizing my thoughts and work alot easier.
Stoploss

Risk Management GO8686: Stop Loss, Position Size & TargetFull Name: Risk Management GO8686: Stop Loss, Position Size & Target
What this indicator provides:
A dashboard to calculate Stop Loss, Position Size and Target, where users can customize Risk Management parameters in the setting.
Position Size: calculated from "initialCapital", "Leverage", "Max Loss", "feeMaker", "feeTaker".
Stop Loss Price: using pivots, default length is set to 3, with an extra ATR value controlled by "'Multiplier OF Extra ATR".
Target: calculated from entry price, risk reward, distance between entry and stop loss, fees
What the indicator does Not provides:
entries of positions: The Long/Short entries displayed are just MACD signal crossing zero, users can apply their own entry logic, by modifying ready2L / ready2S variables.
What the indicator does Not guarantee:
the integrity, timeliness, accuracy, and comprehensiveness of the data, calculation method, calculation results, etc.
Two types labels:
1. Automated labels: they are displayed when MACD signal crossing zero, use "Display History Labels" to toggle display or not.
2. Setup Manually label: located at the right side of the latest bar, to display results when users setup manually
The settings of the indicator:
"Toggle to Reload",
"InitialCapital", "Leverage", "Max Loss % per trade", "feeMaker", "feeTaker",
4 length inputs for Pivot, "Multiplier of Extra ATR for stop loss",
"Toggle To setup manually", "Toggle between Long / Short", "Entry Price, set manually", "Stop Loss Price, set manually", "Risk-Reward Ratio"
"Display History Labels"
---------- Disclaimer ----------
Before using or requesting access to the indicator, customers/users acknowledge that they have read and accepted that the indicator, any associated contents on all social medias and any communication with the indicator author, including but not limited to: product and service details, signals, alerts, data, calculation methods, calculation results, user manual, tutorials, ideas, videos, chats, messages, emails, blogs, tweets, etc. are provided solely for educational purpose and Not as financial advice. Customers/users understand and agree to use the aforementioned indicator and information at their own risk.
---------- Updates ----------
The latest updates override the previous content.
To activate a update, if it does not load as expected: close the indicator, save the chart, clear browser caches, restart the browser, reload the chart and apply the indicator to the chart.

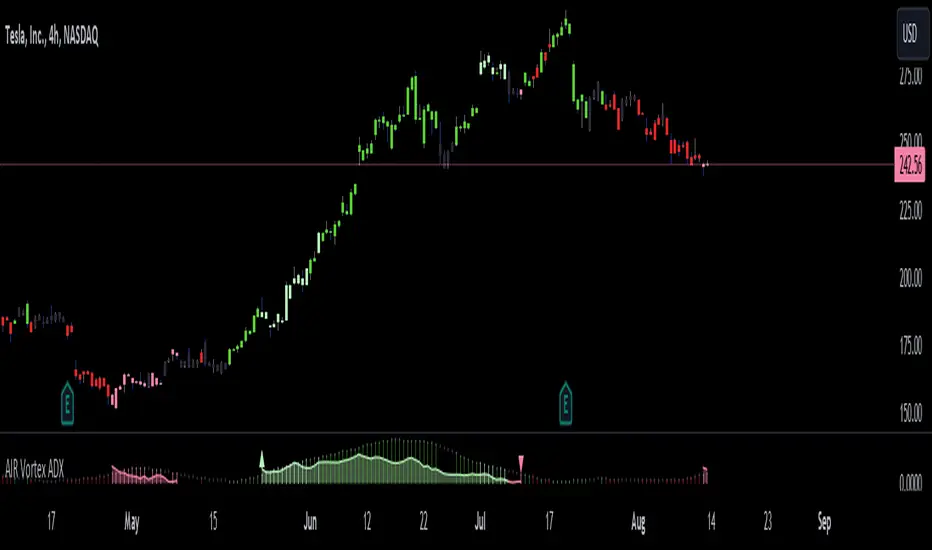
AIR Vortex ADXThis project started as an effort to improve the user interface of the hybrid indicator ADX of Vortex, which is, as per the name, a blend of ADX and Vortex Indicator. Plotting both indicators on the same polarity and normalising the vortex, a better interpretation of the interaction between the two is possible, and trend becomes apparent.
Basically, the Vortex provides the bright punch and ADX the continuation of the trend and momentum.
A range mixer has been added to the vortex, comprising both true and interpercentile ranges (see my previous script for a desrciption of interpercentile range). Users can activate and add amounts of each as they see fit.
Finally, there is an RSI filter, the idea of which is to filter out ranging (flat) markets, where no distinct direction is yet emerging.
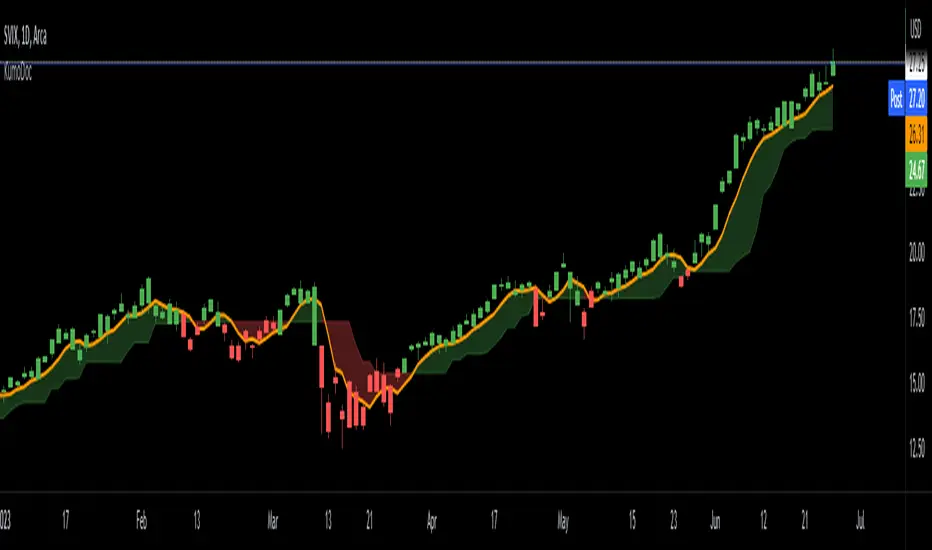
IKH Cloud V1.0 (nextSignals)The IKH Cloud V1.0 (nextSignals) is an Ichomoku-type indicator that can be used for various trading strategies. It's based on a ThinkScript study from @stephenharlinmd (aka nextSignals) that uses an instantaneous moving average as the base MA, and a custom trailing stop. Both of these components form the cloud.
Indicator Components and Calculation
The indicator comprises two key components:
Instantaneous Moving Average (IMA) : This is a type of moving average that places a greater weight on the most recent data points, and is based on Ehler's book "Rocket Science for Traders". This is slightly different from the Doc's original, but is very approximate.
Trailing Stop : This component helps determine the stop loss level that moves along with the price. The trailing stop is based on the highest high and the lowest low of the last 5 bars, as well as the simple moving averages of the low and high of the previous bar. The trailing stop is calculated separately for each condition: when the bar index is greater than 1 and when the previous 'a' variable is either 1 or 0.
These two components are used to create a filled area on the chart, also known as the 'cloud'. The color of the cloud and the candlesticks change based on the relative positions of the IMA and the trailing stop.
How to Use the Indicator
The following are just ideas on how to use this indicator, and is not financial advice in any form:
Trend Identification: When the IMA is above the trailing stop (cloud), it indicates an uptrend, and when it's below, it indicates a downtrend.
Entry/Exit Signals: Traders can consider going long when the candlesticks move above the cloud and short when they move below the cloud.
Stop Loss Level: The trailing stop line (the cloud's edge) can serve as a dynamic stop loss level.
Please don't use just this indicator on its own. Please use this in conjunction with other analysis tools, indicators, and systems you already have in place. Always consider the overall market context and use appropriate risk management strategies.
VolatilityThis script shows three different calculations for volatility.
All three can be used as Stop-Loss...
- Absolute Price Changes
- Maximum Price Fluctuation
- and every one should know Average True Range
The script has a dark and light theme.
And the colors can be changed and each can be deactivated.
On top of that I stumbled over the fact that when MPF crosses over APC
this could result in a significant change in price and could also be used as an entry or exit.
This is also highlighted by default. You can change its background color and you can deactivate it too.
ACP measures volatility over most recent close prices.
This is excellent for comparing volatility.
It includes both frequency and magnitude.
In other words: Sum of differences between second to last close price and last close price as absolute value for 'n' bars.
MPF measures volatility over most recent candles, which could be used as an estimate of risk.
It may also be effective as the basis for a stop-loss or take-profit,
like the ATR but it ignores the frequency of directional changes within the time interval.
In other words: The difference between the highest high and lowest low over 'n' bars.
When you don't know what the ATR is then you can look at this link .

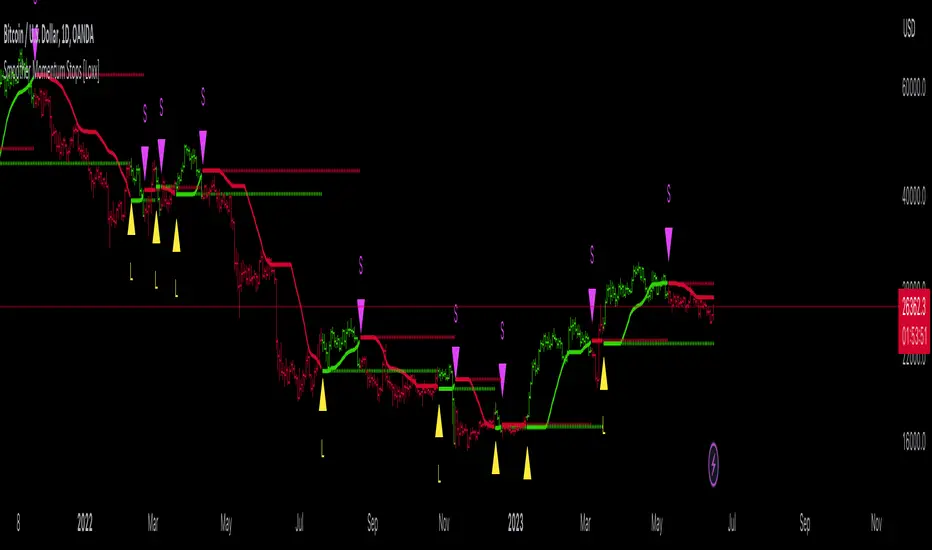
Smoother Momentum Stops [Loxx]Smoother Momentum Stops (SMS) is a dynamic tool that combines the logic of momentum and moving averages to create an overlay of the market price and generate potential trade signals. The original idea for this indicator comes from the beloved and esteemed trading indicator guru Mladen Rakic.
Understanding the Framework
The SMS incorporates various aspects of technical analysis, including momentum calculation, several types of moving averages, and an intelligent stop-and-reverse system that determines when to enter and exit trades.
The indicator initiates by defining the color scheme for visualization, specifically green for bullish trends and red for bearish trends. It further utilizes the 'smmom' and 'fema' functions to calculate smoothed momentum and fast exponential moving averages, respectively. The values computed by these functions are central to the signal generation process.
Momentum Calculation
The 'smmom' function serves to calculate a smoother momentum by taking a source (such as the closing price) and a period as inputs. This function employs a complex algorithm involving exponential moving averages (EMA), wherein two EMAs are calculated with different smoothing factors, and the difference between the two results is returned as the output. This smooth momentum calculation assists in eliminating unnecessary noise from the market and delivers more reliable momentum readings.
Moving Averages Computation
One key feature of the SMS is the ability to select from five different moving average types: Exponential Moving Average (EMA), Fast Exponential Moving Average (FEMA), Linear Weighted Moving Average (LWMA), Simple Moving Average (SMA), and Smoothed Moving Average (SMMA). The 'variant' function assigns the chosen method to the '_avg' variable, which is then used in the trade signal logic.
Trade Signal Generation
SMS employs a complex yet robust mechanism for generating trade signals. A stop-and-reverse system is established, which works on the principle of momentum. If the smoothed momentum is positive, an upper stop is determined and if the momentum is negative, a lower stop is defined.
The process continues by defining long and short entry conditions. The indicator goes long when an upper stop exists, and the previous bar had a lower stop, signifying a shift in momentum. The short entry condition is the opposite: the indicator goes short when a lower stop exists, and the previous bar had an upper stop. Alerts are generated for each of these conditions, helping traders to take timely action.
Visual Representation and UI Options
In terms of visual representation, the indicator plots upper and lower stops, employing green color for upper and red for lower stops. If the option to color bars is chosen, the entire bar is colored green or red, based on whether an upper or lower stop exists. This feature allows traders to visually comprehend market conditions better. Support and reisstance levels are also provided for visual context.
Conclusion
The Smoother Momentum Stops indicator is a potent tool for traders seeking to optimize their trading strategies. It blends the fundamentals of momentum and moving averages, resulting in a robust system that provides clear, reliable, and timely trading signals. By adjusting the smoothing type and period parameters, traders can customize the indicator to fit various market conditions and asset types, thereby adding a layer of flexibility to their trading strategies.
The use of a stop-and-reverse system adds a layer of risk management by offering precise entry and exit points based on momentum shifts. These stops are not just mere levels of entries or exits, but they reflect the undercurrent of the market's momentum, thus providing a dynamic framework to make informed trading decisions.
Additionally, the SMS indicator offers visual simplicity. The color-coded bars and distinct symbols for long and short positions make it easier for traders to interpret the signals and market direction quickly. Combined with the alert system, it ensures that traders never miss an important trading opportunity.
Finally, the power of the SMS indicator lies in its adaptability and comprehensive approach. By providing a selection of moving averages and an intelligent momentum-based system, it encapsulates various aspects of market behavior. As such, it is a useful tool not just for momentum traders, but for any trader who understands the significance of moving averages and momentum in predicting market movements.
In conclusion, the Smoother Momentum Stops indicator stands as an innovative, adaptable, and powerful tool for the modern trader. Its blend of flexibility, dynamic risk management, and straightforward visualization offer a comprehensive solution for traders looking to navigate the complex world of financial markets. With a detailed understanding of its workings as presented in this essay, traders can harness its full potential to optimize their strategies, manage risk, and achieve their trading objectives.
AIR Supertrend (Average Interpercentile Range)Supertrend (ST) is a popular stop loss and trend identification script. The simplicity of seeing a clean trend on a chart makes it attractive, yet it is restricted by only allowing the source, length and multiplier to be adjusted, & these tend to have a limited effect on the properties of the identified trend.
There is a wide variety of interesting ST scripts on TradingView that give the user more control, but none to my knowledge, based on measuring the statistical dispersion of Average Interpercentile Range (AIR).
Two more levels of control:
Normally, ATR Average True Range is used to calculate the range in ST. ATR is initially calculated using RMA to smooth out True Range. This script gives the user the option of changing the MA to some more interesting varieties & modifying their parameters.
The default range setting when you load the indicator on a chart will be AIR.
The real strength of the indicator, however, and the reason I am publishing it, is to release AIR. Play round with the percentile range setting. Lowering it will allow you to stay longer in a trade in a volatile market. Raising it will make it tighter.
For comparison, you can switch back the range setting to ATR and load up RMA to see how the original, classic ST plots.
Alerts are included in this version. Alway use a stop loss.
DISCLAIMER: None of this is financial advice.
Credits to these authors, whose hard work inspired parts of this script:
@ KivancOzbilgic - SuperTrend
@ KioseffTrading - Tillson T3 MA
@ cheatcountry - Hann Window Smoothing
@ mutantdog - Interquartile Range function in his 'Blaze' script

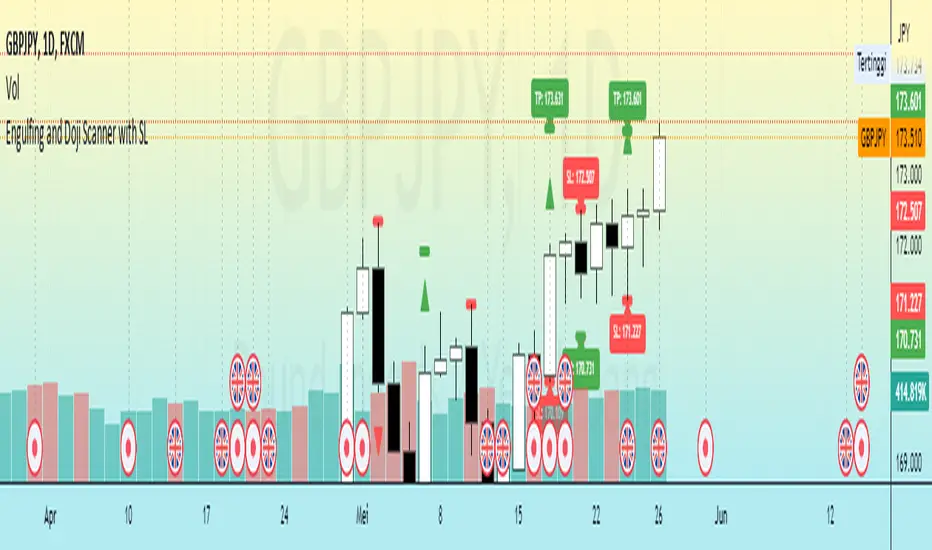
Engulfing and Doji Scanner with SLThe Bullish Engulfing pattern occurs when the close is higher than the open, and scripts will look for this pattern by checking the difference in the close and open prices sufficiently in pips. Likewise, the Bearish Engulfing pattern occurs when the close is lower than the open, and scripts will look for this pattern by checking for sufficient difference in the open and close in pips.
The Doji pattern occurs when the absolute difference between the open and close prices is very small compared to the price range for that period. The script will look for these patterns by comparing the difference between the open and close prices by a certain percentage of the price range.
After the patterns are detected, the script will calculate the Stop Loss (SL) and Take Profit (TP) levels based on the parameters set. The SL level will be determined based on the lowest price range with certain adjustments, while the TP level is calculated using a 1:1 ratio to the SL distance.
This script will display arrows and Stop Loss and Take Profit labels on the chart to assist traders in identifying relevant patterns and levels. However, it is important to remember that these scripts only assist in the analysis of patterns and levels, and a more complete trading strategy and decision-making remains the responsibility of the trader.
Take profit and Stop Loss ATR HL [Tcs] | ALGOThis indicator helps traders set stop loss and take profit levels based on either ATR or High-Low range.
The indicator calculates stop loss and take profit levels for both long and short positions, based on the user's input of ATR length, ATR smoothing method, and multiplier levels for each level. It’s possible to set 3 levels of take profit, for both long and short trades.
The indicator also includes the option to show or hide levels, bands, and labels for the calculated stop loss and take profit levels.
Additionally, the indicator has a function to calculate the user's risk based on their account balance, risk percentage, and broker fees.
Overall, this indicator can be helpful for traders who use stop loss and take profit levels in their trading strategies and want a visual representation of those levels on their charts.
Please note that this indicator is for educational purposes only and should not be used for trading without further testing and analysis.

Limit Order + ATR Stop-Loss [TANHEF]This indicator enables interactive placement of limit or stop-limit orders with a trailing ATR stop-loss and optional profit target (with alerts). Refer to the images below for further clarification.
Why use a trailing stop-loss?
A trailing stop-loss serves as an exit strategy when price moves against you, while also allowing you to adjust the exit point further into profit when price moves favorably. The ATR (Average True Range), a reliable measure of volatility, acts as an effective risk management tool, functioning as a trailing stop-loss.
Indicator Explanation
Initial indicator placement: Select Long Limit or Long-Stop Limit order.
Change Entry Type: Switch between Long and Short within settings.
Modify entry price: Drag circle, adjust in settings, or re-add indicator to chart.
Optional Profit Target: Use Risk/Reward ratio or specify price.
Entry anticipation: Estimated ATR stop-loss and profit target as blue circles (fluctuates with volatility changes).
Entry triggered: Actual ATR stop-loss and profit target plotted.
Exit conditions: Stop-loss or profit target hit, exit entry.
Update Frequency: Continuously, Bar Open, or Bar Open on entry then continuously.
ATR Overlap: no entry occurs if the ATR overlaps with price (stop-loss 'hit' already on entry bar)
Table: Displays input settings selected.
Show Only On Ticker: Ability to hide indicator on other tickers.
Long Limit
Long Stop-Limit
Short Limit
Short Stop-Limit
Alerts
1. 'Check' alerts to use within indicator settings (entry, trailing stop hit, profit target hit, and failed entry).
2. Select 'Create Alert'
3. Set the condition to 'Limit Order + ATR Stop-Loss''
4. Select create.
Additional details can be added to the alert message using these words in between Curly (Brace) Brackets:
{{trail}} = ATR trailing stop-loss (price)
{{target}} = Price target (price)
{{type}} = Long or Short stop-loss (word)
{{traildistance}} = Trailing Distance (%)
{{targetdistance}} = Target Distance (%)
{{starttime}} = Start time of position (day:hr:min)
{{maxdrawdown}} = max loss
{{maxprofit}} = max profit
{{update}} = stoploss update frequency
{{entrysource}} = entry as 1st bar source (yes/no)
{{triggerentry}} = Wick/Close Trigger entry input
{{triggerexit}} = Wick/Close Trigger exit input
{{triggertarget}} = Wick/Close Trigger target input
{{atrlength}} = ATR length input
{{atrmultiplier}} = ATR multiplier input
{{atrtype}} = ATR type input
{{ticker}} = Ticker of chart (word)
{{exchange}} = Exchange of chart (word)
{{description}} = Description of ticker (words)
{{close}} = Bar close (price)
{{open}} = Bar open (price)
{{high}} = Bar high (price)
{{low}} = Bar low (price)
{{hl2}} = Bar HL2 (price)
{{volume}} = Bar volume (value)
{{time}} = Current time (day:hr:min)
{{interval}} = Chart timeframe
{{newline}} = New line for text

Supertrend - Optimised Exit We created a small script that will allow you to have a quick look into static SL/PT to choose from. This might save you time, replacing the manual search for optimal SL/PT.
We're checking signals of the strategy and computing its performance with a grid of SL/PT selected.
We used SuperTrend signals in this example, but it will be straightforward to integrate your signals.
In addition to total Return, we compute MAX Dd and Profit Factor. Other metrics can be implemented as well.
Thanks to @MUQWISHI for helping code it.
Disclaimer
Please remember that past performance may not indicate future results.
Due to various factors, including changing market conditions, the strategy may no longer perform as well as in historical backtesting.
This post and the script don’t provide any financial advice.

Stophunt WickAcknowledgement
This indicator is dedicated to my friend Alexandru who saved me from one of these liquidation raids which almost liquidated me.
Alexandru is one of the best scalpers out there and he always nails his entries at the tip of these wicks.
This inspired me to create this indicator.
What's a Liquidation Wick?
It's that fast stop-hunting wick that stophunts everyone by triggering their stop-loss and liquidation.
Liquidity is the lifeblood of stock market and liquidation is the process that moves price.
This indicator will identify when a liquidity pool is getting raided to trigger buy or sell stops, they are also know as stop-hunts.
How does it work?
When market consolidates in one direction, it builds up liquidity zones.
Market maker will break out of these consolidation phases by having dramatic price action to either pump or dump to raid these liquidity zones.
This is also called stop-hunts or liquidity raids. After that it will start reversing back to the opposite direction.
This is most noticeable by the length of the wick of a given candle in a very short amount of time and the total size of the candle.
This indicator highlights them accordingly.
Settings
Wick and Candle ratio works with default values but finetune will enhance user experience and usability.
Wick Ratio: Size of the wick compared to body of a candle.
Adjust this to higher ratio on smaller timeframe or smaller ratio on bigger timeframe to your trading style to spot a trend reversal.
Candle Ratio: The size of the candle, by default it is 0.75% of the current price.
For example, if BTC is at 20,000 then the size of the candle has to be minimum 150.
This can be fine tuned to bigger candle size on higher time frames or smaller for shorter timeframe depending on the trade type.
How to use it?
This indicator will identify when a liquidity pool is getting raided to trigger buy or sell stops, they are also know as stop-hunts. It can be used of its own for scalping but there are also a good few indicators which would most definitely help to confluence bigger timeframe trades.
Scalp
This indicator shows the most chaotic moments in price action; therefore it works best on smaller timeframes, ideally 3 or 5 minute candle.
- Wait for the market to start pumping or dumping.
- Current candle will change colour (Bullish/Bearish).
- Enter trade as soon as price starts to reverse back.
- Place the stop-loss outside of the current candle.
- Wait for the Liquidation Wick to appear as confirmation.
Price is very chaotic during a liquidity stop-hunt raid but there is a saying:
"In the midst of chaos, there is also opportunity" - Sun-Tzu
Since this is a very high risk, high reward strategy; it is advised to practice on paper trade first.
Practice until perfection and this indicator would be the perfect bread and butter scalp confirmation.
Fair Value Gap
FVG strategy is the most accurate in conjunction with this indicator.
Normally price would reverse after consuming fair value gaps but often it's difficult to know when and where.
This indicator would identify those crucial entry points for reverse course direction of the price action.
Support and Resistance
This indicator can also be used in conjunction with support and resistance lines.
Generally the stophunt will go deep below the support or spike much further up the resistance lines to liquidate positions.
Bollinger Bands
Bolling Bands strategy would be to wait until the price breaks out of the band.
Once the wick is formed, it would be an ideal entry point.
Script change
This is an open-source script and feel free to modify according to your need and to amplify your existing strategy.

Pip CrosshairsThis is a simple tool designed to help you visualize your stop loss and take profit levels before entering a trade. The tool plots two lines on the chart - a green dotted line for take profit and a red dotted line for stop loss (similar to the price line) - with a simulated default spread of one pip factored in. The indicator has the option to toggle between long and short positions.
Please note that the spread used in the tool is not based on your actual spread and should be adjusted accordingly. As, to the best of my knowledge Pine Script does not have the ability to automatically include spread in an indicator, so you will need to input your spread manually. (if you can please let me know cause that would be a game changer).
Overall, should help save you a bit of time by not having to manually measure stop loss and take profit levels for each trade.
Happy hunting :)
Three-Day Rolling PivotThe three-day rolling pivot is another pivot concept,
which may be used by intermediate positions, for several days or even weeks.
It can be utilized in many ways, such as to determine an entry point or trailing stop.
As the name suggests, this pivot is based on the last three days.
I learned this concept of the book "The logical Trader" by Mark Fisher.
Kudos go to him!
My version of the Three-Day Rolling Pivot uses actual data!
And all similar scripts I have found so far calculate future data and don't take into account the original data.
I hope this script will help some people to do some better decisions.
And I am pleased to get some advice to make this script even better!
Future data vs original data
Pine Script v5 Reference Manual:
Merge strategy for the requested data position... This merge strategy can lead to undesirable effect of getting data from "future" on calculation on history. This is unacceptable in backtesting strategies, but can be useful in indicators.
e2e4 on Stack Overflow said:
Pine v1-v2's security() function is using the lookahead parameter by default, which could be modified in v3-v5...
stackoverflow.com
I haven't found a script which put this into account jet.
I leave this option available for people that wanna more speculated data. But it's disabled by default.
Long/Short Example
You can enter Long when the market cross over the upper line (default color is green) and you should put your trailing stop 1-5 ticks below the lower line (default color is red).
The opposite when Shorting, then the market has to cross down the lower line and your trailing stop should be 1-5 ticks above the upper line.
How does this script work:
First it fetches the highest high of ...
yesterday,
the day before yesterday,
and the day before that.
After that the script looks for the highest high of all three.
Next it does the same for previous lowest low.
Last but not least, it fetches the closing price of the last day.
After that it adds all three prices together and divide them by three.
This result in a three day pivot price.
Then it adds the highest high and lowest low of the three last days and divide it by two.
This gives us the second number we need to calculate the differential.
The differential is the gap between the three day pivot price and the second number.
Sometimes the second number is bigger than the three day pivot price so I took that into account too. Other wise the colors plotted would be on the wrong site.
Finally, the script is rounding the numbers to the nearest minimum tick of that security.

Inter-Exchanges Crypto Price Spread Clouds (Tartigradia)Display variations in min-max and median values of high, low and close across exchanges. It's a kind of realized volatility indicator, as the idea is that in times of high volatility (high emotions, fear, uncertainty), it's more likely that market inefficiencies will appear for the same asset between different market makers, ie, the price can temporarily differ a lot. This indicator will catch these instants of high differences between exchanges, even if they lasted only an instant (because we use high and low values).
Compared with my other "Inter-Exchanges Crypto Price Spread Deviation" indicator, this one overlays directly on the chart, and offers a different take based on the same premisses. Instead of summarizing volatility via standard deviation, here we display clouds of the range of values that were observed.
A big advantage of this approach is that it can also be used to determine safe stop loss levels, especially the values of percentile rank (i.e., what are the high values that were observed in at least 50% of exchanges?).
Indeed, all price levels are displayed in the indicator's status bar:
green for high values,
red for low values,
aqua for median,
purple for average,
The first two values are max and min values of high across exchanges (in green).
The next two values are max and min of low across exchanges (in red).
The next two values are median (aqua) and average (purple).
The last two values are percentile rank values for high (green) and low (red) respectively.
Another advantage is that the high (green) vs low (red) clouds can be seen as representing the buying or selling pressure respectively across exchanges, and this may in itself provide a signal to know whether one side is winning.
Link to my other complementary indicator:
Compared to other inter-exchanges spread indicators, this one offers two major features:
The symbol automatically adapts to the symbol currently selected in user's chart. Hence, switching between tickers does not require the user to modify any option, everything is dynamically updated behind the scenes.
It's easy to add more exchanges (requires some code editing because PineScript v5 does not allow dynamical request.security() calls).
Limitations/things to know:
History is limited to what the ticker itself display. Ie, even if the exchanges specified in this indicator have more data than the ticker currently displayed in the user's chart, the indicator will show only a timeperiod as long as the chart.
The indicator can manage multiple exchanges of different historical length (ie, some exchanges having more data going way earlier in the past than others), in which case they will simply be ignored from calculations when far back in the past. Hence, you should be aware that the further you go in the past, the less exchanges will have such data, and hence the less accurate the measures will be (because the deviation will be calculated from less sources than more recent bars). This is thanks to how the array.* math functions behave in case of na values, they simply skip them from calculations, contrary to math.* functions.

Cuck WickAcknowledgement
This indicator is dedicated to my friend Alexandru who saved me from one of these scam cuck wicks which almost liquidated me.
Alexandru is one of the best scalpers out there and he always nails his entries at the tip of these wicks.
This inspired me to create this indicator.
What's a cuck wick?
It's that fast stop-hunting wick that cucks everyone by triggering their stop-loss and liquidation.
Liquidity is the lifeblood of stock market and liquidation is the process that moves price.
This indicator will identify when a liquidity pool is getting raided to trigger buy or sell stops, they are also know as stop-hunts.
How does it work?
When market consolidates in one direction, it builds up liquidity zones.
Market maker will break out of these consolidation phases by having dramatic price action to either pump or dump to raid these liquidity zones.
This is also called stop-hunts or liquidity raids. After that it will start reversing back to the opposite direction.
This is most noticeable by the length of the wick of a given candle in a very short amount of time and the total size of the candle.
This indicator highlights them accordingly.
Settings
Wick and Candle ratio works with default values but finetune will enhance user experience and usability.
Wick Ratio: Size of the wick compared to body of a candle.
Adjust this to higher ratio on smaller timeframe or smaller ratio on bigger timeframe to your trading style to spot a trend reversal.
Candle Ratio: The size of the candle, by default it is 0.75% of the current price.
For example, if BTC is at 20,000 then the size of the candle has to be minimum 150.
This can be fine tuned to bigger candle size on higher time frames or smaller for shorter timeframe depending on the trade type.
How to use it?
This indicator will identify when a liquidity pool is getting raided to trigger buy or sell stops, they are also know as stop-hunts. It can be used of its own for scalping but there are also a good few indicators which would most definitely help to confluence bigger timeframe trades.
Scalp
This indicator shows the most chaotic moments in price action; therefore it works best on smaller timeframes, ideally 3 or 5 minute candle.
- Wait for the market to start pumping or dumping.
- Current candle will change colour (Bullish/Bearish).
- Enter trade as soon as price starts to reverse back.
- Place the stop-loss outside of the current candle.
- Wait for the cuck wick to appear as confirmation.
Price is very chaotic during a liquidity stop-hunt raid but there is a saying:
"In the midst of chaos, there is also opportunity" - Sun-Tzu
Since this is a very high risk, high reward strategy; it is advised to practice on paper trade first.
Practice until perfection and this indicator would be the perfect bread and butter scalp confirmation.
Fair Value Gap
FVG strategy is the most accurate in conjunction with this indicator.
Normally price would reverse after consuming fair value gaps but often it's difficult to know when and where.
This indicator would identify those crucial entry points for reverse course direction of the price action.
Support and Resistance
This indicator can also be used in conjunction with support and resistance lines.
Generally the cuck will go deep below the support or spike much further up the resistance lines to liquidate positions.
Bollinger Bands
Bolling Bands strategy would be to wait until the price breaks out of the band.
Once the wick is formed, it would be an ideal entry point.
Script change
This is an open-source script and feel free to modify according to your need and to amplify your existing strategy.

Trail Blaze - (Multi Function Trailing Stop Loss) - [mutantdog]Shorter version:
As the title states, this is a 'Trailing Stop' type indicator, albeit one with a whole bunch of additional functionality, making it far more versatile and customisable than a standard trailing stop.
The main set of features includes:
Three independent trailing types each with their own +/- multipliers:
- Standard % change
- ATR (aka Supertrend)
- IQR (inter-quartile range)
These can be used in isolation or summed together. A subsequent pair of direction specific multipliers are also included.
Two separate custom source inputs are available, both feature the standard options alongside a selection of 'weighted inputs' and the option to use another indicator (selected via 'AUX'):
- 'Centre' determines the value about which the trailing sum will be added to define the stop level.
- 'Trigger' determines the value used for crossing of stops, initiating trend changes and triggering alerts.
A selection of optional filters and moving averages are available for both.
Furthermore there are various useful visualisation options available, including the underlying bands that govern the stop levels. Preset alerts for trend reversals are also included.
This is not really an 'out-of-the-box' indicator. Depending upon the market and timeframe some adjustments will be necessary for it to function in a useful manner, these can be as simple or complex as the feature-set allows. Basic settings are easy to dial in however and the default state is intended as a good starting point. Alternatively with some experimentation, a plethora of unique and creative configurations are possible, making this a great tool for tweaking. Below is a more detailed overview followed by a bunch of simple example settings.
------------------------
Lengthy Version :
DESIGN & CONCEPT
Before we start breaking this down, a little background. This started off as an attempt to improve upon the ever-popular Supertrend indicator. Of course there are many excellent user created variants available utilising some interesting methods to overcome the drawbacks of the basic version. To that end, rather than copying the work of others, the direction here shifted towards a hybrid trailing stop loss with a bunch of additional user customisation options. At some point, a completely different project involving IQR got morphed into this one. After sitting through months of sideways chop (where this proved to be of limited use), at the time of publication the market has began to form some near term trend direction and it appears to be performing well in many different timeframes.
And so with that out of the way...
INPUTS
The standard Supertrend (and most other variants) includes a single source input, as default set to 'hl2' (candle mid-range). This is the centre around which the atr bands are added/subtracted to govern the stop levels. This is not however the value which is used to trigger the trend reversal, that is usually hard-coded to 'close'. For this version both source values are adjustable: labelled 'centre' and 'trigger' respectively.
Each has custom input selectors including the usual options, a selection of 'weighted inputs' and the option to use another indicator (selected from the Aux input). The 'weighted inputs' are those introduced in Weight Gain 4000, for more details please refer to that listing. These should be treated as experimental, however may prove useful in certain configurations. In this case 'hl-oc2' can be considered an estimate of the candle median and may be a good alternative to the default 'centre' setting of 'hl2', in contrast 'cc-ohlc4' can tend to favour the extremes in the trend direction so could be useful as a faster 'trigger' than the default 'close'.
To cap them off both come with a selection of moving average filters (SMA, EMA, WMA, RMA, HMA, VWMA and a simple VWEMA - note: not elastic) aswell as median and mid-range. 'Centre' can also be set to the output of 'trigger' post-filter which can be useful if working with fast/slow crosses as the basis.
DYNAMICS
This is the main section, comprised of three separate factors: 'TSL', 'ATR' and 'IQR'. The first two should be fairly obvious, 'TSL' (trailing stop loss) is simply a percentage of the 'centre' value while 'ATR' (average true range) is the standard RMA-based version as used in Supertrend, Volatility Stop etc.
The third factor is less common however: 'IQR' (inter-quartile range). In case you are unfamiliar the principle here is, for a given dataset, the greatest 25% and smallest 25% of samples are removed. The remainder is then treated as a set and the range is calculated by highest - lowest. This is a commonly used method in statistical analysis, by removing the extremes it is less prone to influence by outliers and gives a good representation of the main dispersion around the median. In practise i have found it can be a good alternative to ATR, translating better across multiple time-frames due to it representing a fraction of the total range rather than an average of per-candle range like ATR. Used in combination with the others it can also add a factor more representative of longer-term/higher-timeframe trend. By discarding outliers it also benefits from not being impacted by brief pumps/volatility, instead responding only to more sustained changes in trend, such as rallies and parabolic moves. In order to give an accurate result the IQR is calculated using a dataset of high, low and hlcc4 values for all bars within the lookback length. Once calculated this value is then halved which, strictly speaking, makes it a semi-interquartile range.
All three of these components can be used individually or summed together to create a hybrid dynamics factor. Furthermore each multiplier can be set to both positive and negative values allowing for some interesting and creative possibilities. An optional smoothing filter can be applied to the sum, this is a basic SWMA-4 which is can reduce the impact of sudden changes but does incur a noticeable lag. Finally, a basic limiter condition has been hard-coded here to prevent the sum total from ever going below zero.
Capping off this section is a pair of direction multipliers. These simply take the prior dynamics sum and allow for further multiplication applied only to one side (uptrend/lo-stop and downtrend/hi-stop). To see why this is useful consider that markets often behave differently in each direction, we've all seen prices steadily climb over several weeks and then abruptly dump in the process of a day or two, shorter time frames are no stranger to this either. A lack of downside liquidity, a panicked market, aggressive shorts. All these things contribute to significant differences in downward price action. This function allows for tighter stops in one direction compared to the other to reflect this imbalance.
VISUALISATIONS
With all of these options and possibilities, some visual aids are useful. Beneath the dynamics' section are several visual options including both sources post-filter and the actual 'bands' created by the dynamics. These are what govern the stop levels and seeing them in full can help to better understand what our various configurations actually do. We can even hide the stop levels altogether and just use the bands, making this a kind of expanded Keltner Channel. Here we can also find colour and opacity settings for everything we've discussed.
EXAMPLES
The obvious first example here is the standard %-change trailing stop loss which, from my experience, tends to be the best suited for lower time frames. Filtering should probably minimal here. In both charts here we use the default config for source inputs, the top is a standard bi-directional setup with 1.5% tsl while the bottom uses a 2.5% tsl with the histop multiplier reduced to 0 resulting in an uptrend only stoploss.
Shown here in grey is the standard Supertrend which uses 'hl2' as centre and 'close' as trigger, ATR(10) multiplied by 3. On top we have the default filtered source config with ATR(8) multiplied by 2 which gives a different yet functionally similar result, below is the same source config instead using IQR(12) multiplied by 2. Notice here the more 'stepped' response from IQR following the central rally, holding back for a while before closing in on price and ultimately initiating reversal much sooner. Unlike ATR, the length parameter for IQR is absolute and can more significantly affect its responsiveness.
Next we focus on the visualisation options, on top we have the default source config with ATR(8) multiplied by 2 and IQR(12) multiplied by 1. Here we have activated the switch to show 'bands', from this we can see the actual summed dynamics and how it influences the stop levels. Below that we have an altogether different config utilising the included filters which are now visible. In this example we have created a basic 8/21 EMA cross and set a 1% TSL, notice the brief fakeout in the middle which ordinarily might indicate a buy signal. Here the TSL functions as an additional requirement which in this case is not met and thus no buy signal is given.
Finally we have a couple of more 'experimental' examples. On top we have Lazybear's 'Variable Moving Average' in white which has been assigned via 'aux' as the centre with no additional filtering, the default config for trigger is used here and a basic TSL of 1.5% added. It's a simple example but it shows how this can be applied to other indicators. At the bottom we return to the default source config, combining a TSL of 8% with IQR(24) multiplied by -2. Note here the negative IQR with greater length which causes the stop to close in on price following significant deviations while otherwise remaining fairly wide. Combining positive and negative multiples of each factor can yield mixed results, some more useful than others depending upon suitable market conditions.
Since this has been quite lengthy, i shall leave it there. Suffice to say that there are plenty more ways to use this besides these examples. Please feel free to share any of your own ideas in the comments below. Enjoy.

cankardesler stoploss v2This stoploss allows to filter high volatility fake trends;
But how we are made it; we are calculating the last spikes value average and calculating the standart deviation, after we added to the standart stoploss formula price+2atr and voila!!
Your stop loss is ready.
The idea behind this formula: what is explosing our stops? fake-out spikes.
We think if we get the last spikes average and calculate the standart deviation on it and after add it to the original stop formula, its gonna help for bypassing the spikes.
Thanks a lot @ocankardes for helping me to developing this formula

MATHR3E RAMP-MA█ OVERVIEW
MATHR3E RAMP-MA (R-MA) is a trend following indicator.
█ CONCEPTS
Disclaimer:
MATHR3E RAMP-MA indicator is intended for advanced traders and may fit your profile, whether you are a day trader or a long-term investor.
It was originally developed by a renowned market analyst and documented in numerous books. Among them is the author Jason Perl.
It is recommended to have read the trading techniques mentioned in the books covering this indicator beforehand.
How to use:
MATHR3E RAMP-MA is useful for determining if a market is trending and when so, to procure entry points to initiate a trade in line with the expected directional move.
It can be applied to markets as a stop-loss, as well as a low-risk entry qualifier in conjunction with other indicators of the same author.
Moving Average (R-MA I):
Only displayed when market is trending
• Bull trend: Green (moving avg Lows/Period)
• Bear trend: Red (moving avg Highs/Period)
Moving Average (R-MA II):
Always displayed
• Bullish outlook on the market: the 3-day moving average must be positioned above the 34-day moving average
• Bearish outlook on the market: the 3-day moving average must be positioned below the 34-day moving average
█ FEATURES & BENEFITS
Versatile:
This indicator is based on relative price action, so you can apply it to any market or time frame without having to change the default settings.
Rate of Change:
The ROC is calculated for the fast and slow periods of the R-MA (II).
R-MA (II) is colored blue when its rate of change is advancing and maroon when it is declining.
Breakout Qualifier:
A close above/below the moving average R-MA (I) that is confirmed by the following price bar's opening price
Materialized on chart with Flags:
• Green when bear trend ends
• Red when bull trend ends
Alerts
Get notified on:
• UpTrend breakout
• DnTrend breakout
• Any breakout Signal

Average Range @coldbrewroshTaking the average daily range from low to high or high to low isn't the "best" way to get an idea of how much to set targets. So, I made this indicator to make the system better.
This indicator calculates the daily range from Open to High on Bullish Days & Open to Low on Bearish Days .
Nobody can catch the absolute low of the day on bullish days and get out at the high but one can enter at a reasonable price around the open ( 17:00 EST ) .
To complement the Average Range, another table shows the movement in the opposite direction.
For Instance: On Bullish Days how much it moved from Open to Low so that we have an idea of where to put the stop loss and vice versa. The time ranges calculated are the last 5 days, last 1 month, last 3 months & last 1 year.
Note #1: Even though the date range is predefined, it has a different meaning. For Instance: date range of last 5 days means "calculation of the range of last 5 bullish daily candles & not last 5 days" .
Note #2: Exclusive to Forex at the time of posting this.

Lines and Table for risk managementABOUT THIS INDICATOR
This is a simple indicator that can help you manage the risk when you are trading, and especially if you are leverage trading. The indicator can also be used to help visualize and to find trades within a suitable or predefined trading range.
This script calculates and draws six “profit and risk lines” (levels) that show the change in percentage from the current price. The values are also shown in a table, to help you get a quick overview of risk before you trade.
ABOUT THE LINES/VALUES
This indicator draws seven percentage-lines, where the dotted line in the middle represents the current price. The other three lines on top of and below the middle line shows the different levels of change in percentage from current price (dotted line). The values are also shown in a table.
DEFAULT VALUES AND SETTINGS
By default the indicator draw lines 0.5%, 1.0%, and 1.5% from current price (step size = 0.5).
The default setting for leverage in this indicator = 1 (i.e. no leverage).
The line closest to dotted line (current price) is calculated by step size (%) * leverage (x) = % from price.
Pay attention to the %-values in the table, they represent the distance from the current price (dotted line) to where the lines are drawn.
* Be aware! If you change the leverage, the distance from the closest lines to the dotted line showing the current price increase.
SETTINGS
1. Leverage: set the leverage for what you are planning to trade on (1 = no leverage, 2 = 2 x leverage, 5 = 5 x leverage...).
2. Stepsize is used to set the distance between the lines and price.
EXAMPLES WITH DIFFERENT SETTINGS
1) Leverage = 1 (no leverage, default setting) and step size 0.5 (%). Lines plotted at (0.5%, 1%, 1.5%, and –0.5%, –1%, –1,5%) from the current price.
2) Leverage = 3 and stepsize 0.5(%). Lines plotted at (1.5%, 3.0%, 4.5%, and –1.5%, –3.0%, –4.5%) from the current price.
3) Leverage = 3 and stepsize 1(%). Lines plotted at (3%, 6%, 9%, and –3%, –6%, –9%) from the current price.
The distance to the nearest line from the current price is always calculated by the formula: Leverage * step size (%) = % to the nearest line from the current price.

[-_-] Volatility Calibrated ATRDescription:
An indicator based on ATR adjusted for volatility of the market. It uses Heikin Ashi data to find short and long opportunities and displays a dynamic stop loss level. Additionally, it has alerts for when the trend changes (which is an entry signal).
How it works:
It works by dynamically calculating the Period for ATR which depends on current volatility level that is calculated by a function that uses Standard Deviation of price. ATR is then smoothed by Weighted Moving Average and multiplied by ATR Factor, resulting in a plot that changes its colour to red when we're in a downtrend and green when in an uptrend. This plot should be used as a dynamic Stop Loss level. Trend change is determined by price crossing the dynamic Stop Loss level. The squared red and green labels appear when the trend changes, and should be used as Entry signals.
Parameters:
- Source -> data used for calculations
- ATR Factor -> higher values produce less noise and longer trends, lower values give more signals

Entry helperHello traders,
This is a script I use daily as a scalper and it helps me a lot, maybe it can help you, this is why I am sharing it!
PART 1 - DESCRIPTION
This program is specifically designed to help scalpers but can be used for all types of trading but won't be as useful.
This script is what I call an entry helper as it calculates dynamically the position size, stop loss and take profit levels and more.
When scalping and placing market entry orders, the price can move significantely while you are calculating your position size according to your stop loss, capital, risk and especially close price that changes very quickly, this results in a risk that is not ideally controlled and personally was a source of frustration and stress. I wanted to enter my quantity and stop loss values as fast as possible and make the process easier.
This script automates the calculation of the position size, stop loss and take profit levels according the the users input and prints the data visibly on the screen so it is easy to copy by the trader. It allows the trader to be confident that his risk is as controlled as possible.
The script is easy to use and set up, this guide will help you if you have any difficulies or questions.
PART 2 - HOW TO USE THE SCRIPT
- SET THE CAPITAL SETTINGS
1 - Set your capital value in $
- SET THE TRADE SETTINGS
2 - Set your trade side (BUY or SELL)
3 - Set you desired risk in % of your capital
- ENTRY SETTINGS
4 - Set your entry from 2 different options
|MARKET| (default option)
This option will place the entry level at the last available price
|LIMIT|
This option allows you to input a fixed price level for the entry
- STOP LOSS SETTINGS
5 - Select your stop loss placement from 4 different options
|EXTREMA STOP LOSS| (default option)
This option will place the stop loss at the highest/lowest (extrema) price level within the last N candles
|ATR EXTREMA|
This option uses the same price level as the EXTREMA STOP LOSS but will add/soustract the last ATR value (calculated on the N last candles) multiplied by a coefficient that you input
|TICKS EXTREMA|
This option uses the same price level as the EXTREMA STOP LOSS but will add/soustract a number of ticks that you input
|PRICE LEVEL|
This option allows you to input a fixed price level for the stop loss
- TAKE PROFIT SETTINGS
6 - Select your take profit from 3 different options
|NONE| (default option)
This option will not display any take profit level, I have added this option as I don't have take profit targets
|RR|
This option uses a risk to reward ratio (reward/risk) that you input, it will automatically calculate the take profit level that corresponds
|PRICE LEVEL|
This option allows you to input a fixed price level for the take profit
- QUANTITY AND FEE SETTINGS
7 - Set the quantity settings, it represents the quantity in a lot (usually 100 000 in forex, 100 in stocks 1 for crypto currencies)
8 - Set the fee per quantity (turning lot)
- VISUAL SETTINGS
9 - Show or remove the tab
- TAB SETTINGS
10 - Select the data that you want to display in the tab (the tab will adapt automatically)
NOTES:
The vertical dashed line shows what candle has been used for the calculation of the stop loss, it allows you to visualize what candle the script has selected in case of an EXTREMA stop loss option.
I hope this helps you out! Any suggestions are welcome and I hope that the guide is clear enough.
Happy trading!
