S&P 500 (SPX500)

EMINI OPTIONS HighAccuracy Signal SystemThe SPX Options signal system is based on the Market Internals which ultimately drills down to its underlying stocks and their Movement
So a signal system is created which takes the key market Internals rather than just price alone.
In trading OPTIONS, your Direction earns you money along with Option Writing.
PARAMETERS TAKEN INTO ACCOUNT
1. Key Sector Stocks
2. NYSE TICK INDEX
3. UPVOL and DVOL
4. VIX Bands With Applied Gaussian Methodology
"PRICE OF SPX IS NOT TAKEN IN TO ACCOUNT IN THIS SIGNAL SYSTEM"
Understanding the signal system
1. Do not combine this signal system with any other indicators.
2. Greater than 75% success rate for 15 points in SPX .
Recommended time frames: 1 hour are highly recommended time frames.
But a risky trader can trade with 15 Mins because Market Internals support lower time frames. But trade cautiously and read the disclaimer carefully.
The signal system does not carry any recommendations and the signals are generated mathematically using the underlying MARKET INTERNALS LOGIC

Intelligent Supertrend (AI) - Buy or Sell SignalIntroduction
This indicator uses machine learning (Artificial Intelligence) to solve a real human problem.
The artificial intelligence that operates this Supertrend was created by an algorithm that tests every single combination of input values across the entire chart history of an instrument for maximum profitability in real-time.
The Supertrend is one of the most popular indicators on the planet, yet no one really knows what input values work best in combination with each other. A reason for this is because not one set of input values is always going to be the best on every instrument, time-frame, and at any given point in time.
The "Intelligent Supertrend" solves this problem by constantly adapting the input values to match the most profitable combination so that no matter what happens, this Supertrend will be the most profitable.
Indicator Utility
The Intelligent Supertrend does not change what has already been plotted and does not repaint in any way which means that it is fully functional for trading in real-time.
Ultimately, there are no limiting factors within the range of combinations that have been programmed. The Supertrend will operate normally but will change input values according to what is currently the most profitable strategy.
Input Values
While a normal Supertrend would include two user-defined input values, the Intelligent Supertrend automates the input values according to what is currently the most profitable combination.
Additional Tools
The Optimised Supertrend is a tool that can be used to visual what input values the Supertrend AI is currently using. Additional tools to back-test this indicator will be added to this product soon.
For more information on how this indicator works, view the documentation here:
www.kenzing.com
For more information on the Supertrend view these fun facts:
www.marketcalls.in

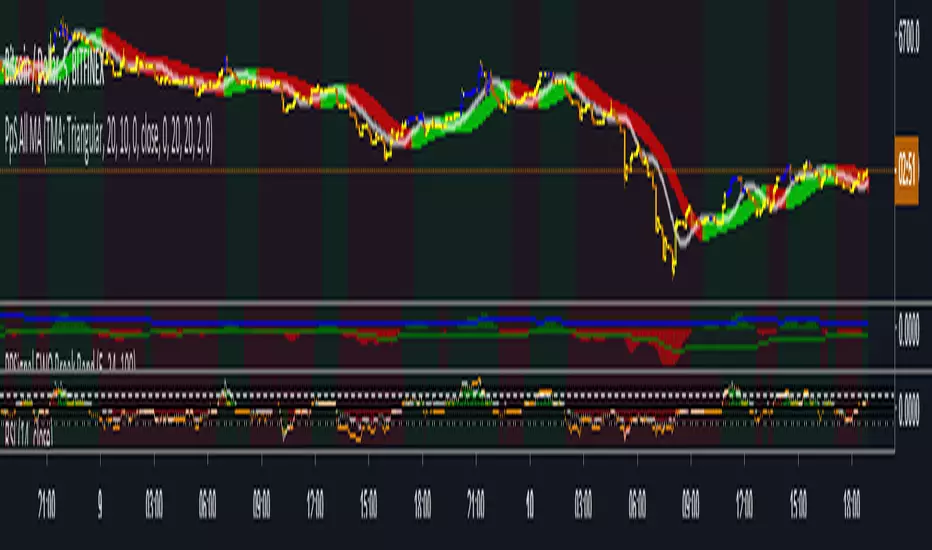
PpSignal The Ultimate Moving Average Crossover 4.0VMA with linear regression smoothe haiken ashi and supertrend bollinguer trend direction

PpSignal The Ultimate Moving Average Crossover 3.0 (CFB)CFB tells you how long the market has been in a quality trend. This value can be used to adjust the period length of other indicators, especially stochastic bands.In order to quantify the overall duration of a market's trend, we replaced classical cycle analysis methods (FFT, MEM, MESA) with a form of analysis that works even when no cycles exist. We accomplished this by examining a time series for specific fractal patterns of any size. We then gather all the patterns found and combine them into one overall index, CFB (Composite Fractal Behavior) Index.For good reason, CFB does not analyze time series data for dominant cycles. Classical cycle analysis examines data points (e.g. prices) and estimates the average presence of a cycle in the window. Now suppose a cycle with a period length of 9 days was strong for 50 days and then disappeared for the next 21 days

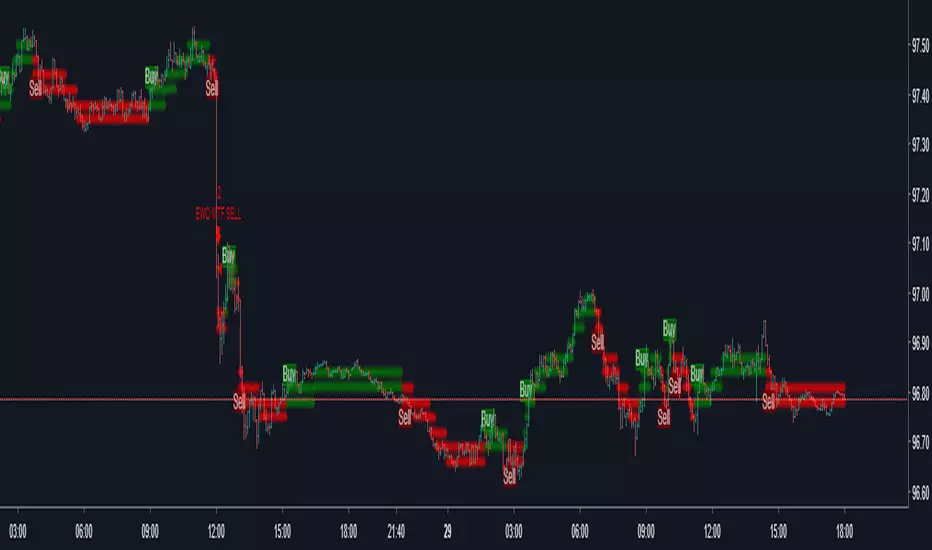
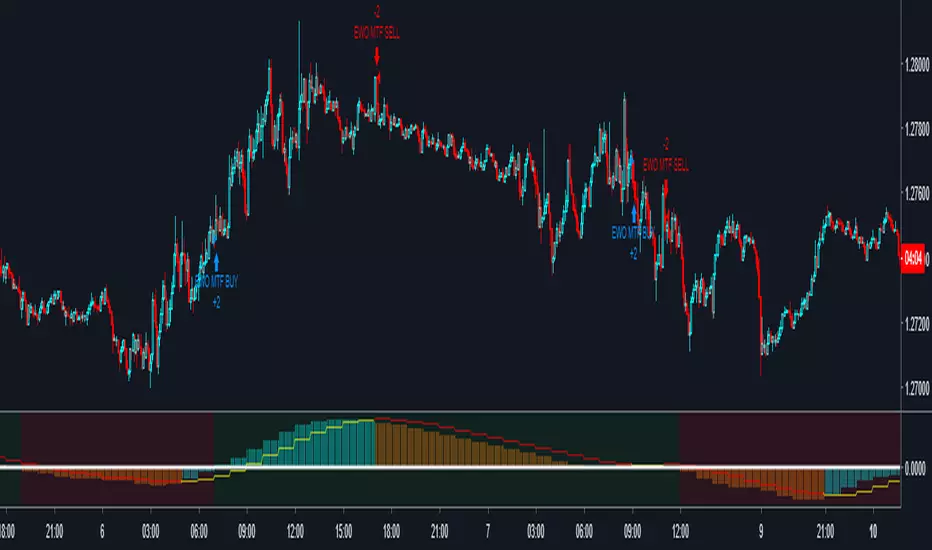
PpSignal EWO LBR MTFEwo mtf strategy.
(tf) superior time frame configuration in input window
Configuration
Forex and crypto :
For time 1 min use tf 30 min
for time 5 min use tf 60 min
for 15, 30 and 60 min use tf 240
Stock:
For time 1 min use tf 30 min
for time 5 min use tf 60 min
for 15 and 30 min tf 240.
For 60 tf D.
For D tf W
For W tf M
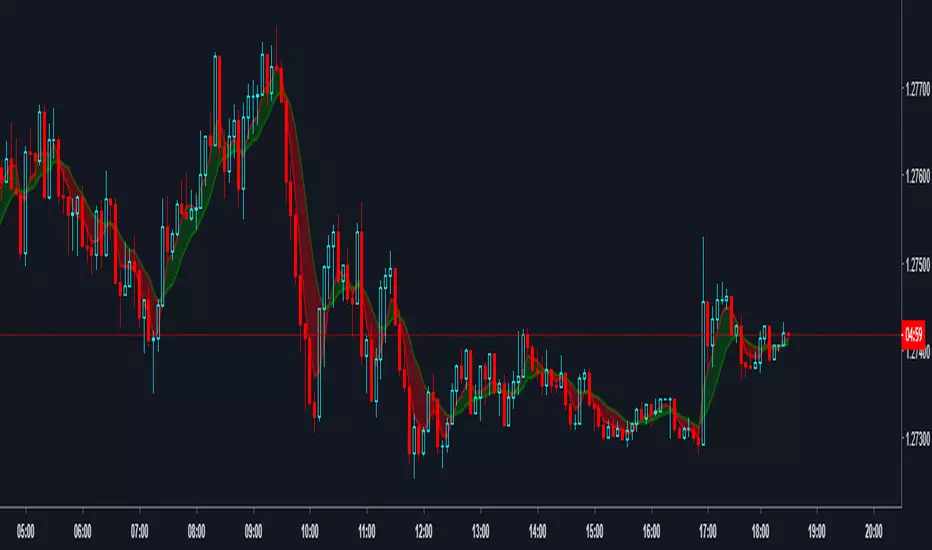
PpSignal The Ultimate Moving Average Crossover 2.0In this version we move out hauken ashi smoothed, bollinguer band and coral. in this version the script have Vidya MA yelloy red color, step ma, lime maroon color, VMA gren. solver and red color and ppsignal hilo trima ma, with different time frame.
If you work in time frame 5 min to 15 min we recommend use hilo trima or alma in 60 min time frame, if you use 30 min to 60 min en 240 min time frame, and d in weekly time frame.

Ehlers MESA Adaptive Moving Averageeveloped by John Ehlers, the MESA Adaptive Moving Average is a technical trend-following indicator which, according to its creator, adapts to price movement “based on the rate change of phase as measured by the Hilbert Transform Discriminator”. This method of adaptation features a fast and a slow moving average so that the composite moving average swiftly responds to price changes and holds the average value until the next bar’s close. Ehlers states that because the average’s fallback is slow, you can create trading systems with almost whipsaw-free trades.
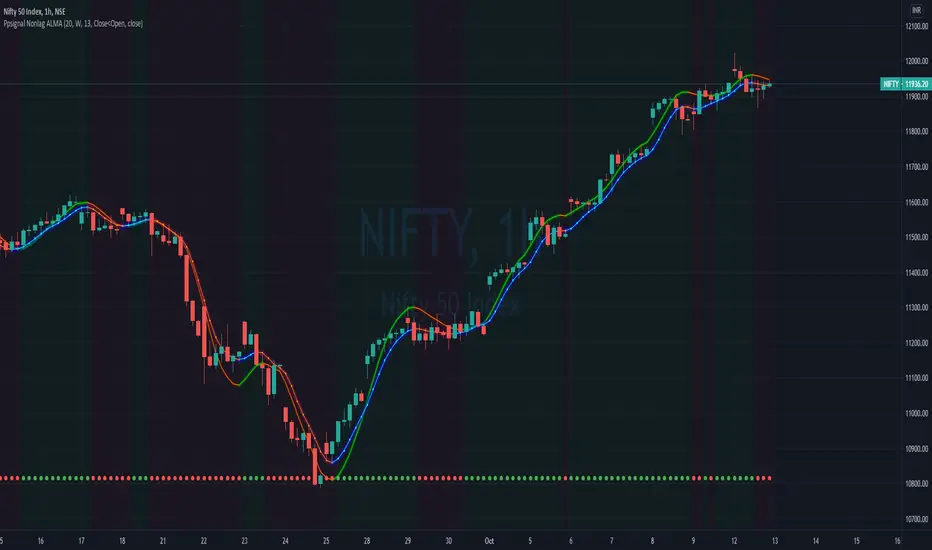
PpSignal Non lag ALMAThe zero lag exponential moving average (ZLEMA) indicator was created by John Ehlers and Ric Way.
As is the case with the double exponential moving average (DEMA) and the triple exponential moving average (TEMA) and as indicated by the name, the aim is to eliminate the inherent lag associated to all trend following indicators which average a price over time.
The formula for a given N-Day period and for a given data series is:
{\displaystyle {\textit {Lag}}={(Period-1)/2}} {\textit {Lag}}={(Period-1)/2}
{\displaystyle {\textit {EmaData}}={Data+(Data-Data(Lagdaysago))}} {\displaystyle {\textit {EmaData}}={Data+(Data-Data(Lagdaysago))}}
{\displaystyle {\textit {ZLEMA}}={EMA(EmaData,Period)}} {\textit {ZLEMA}}={EMA(EmaData,Period)}
The idea is do a regular exponential moving average (EMA) calculation but on a de-lagged data instead of doing it on the regular data. Data is de-lagged by removing the data from "lag" days ago thus removing (or attempting to) the cumulative effect of the moving average.
we use alma ma for calculate this script
PpSignal Non lag LSMAThe zero lag exponential moving average (ZLEMA) indicator was created by John Ehlers and Ric Way.
As is the case with the double exponential moving average (DEMA) and the triple exponential moving average (TEMA) and as indicated by the name, the aim is to eliminate the inherent lag associated to all trend following indicators which average a price over time.
The formula for a given N-Day period and for a given data series is:
{\displaystyle {\textit {Lag}}={(Period-1)/2}} {\textit {Lag}}={(Period-1)/2}
{\displaystyle {\textit {EmaData}}={Data+(Data-Data(Lagdaysago))}} {\displaystyle {\textit {EmaData}}={Data+(Data-Data(Lagdaysago))}}
{\displaystyle {\textit {ZLEMA}}={EMA(EmaData,Period)}} {\textit {ZLEMA}}={EMA(EmaData,Period)}
The idea is do a regular exponential moving average (EMA) calculation but on a de-lagged data instead of doing it on the regular data. Data is de-lagged by removing the data from "lag" days ago thus removing (or attempting to) the cumulative effect of the moving average.
We use Linear regression ma for calculate this script

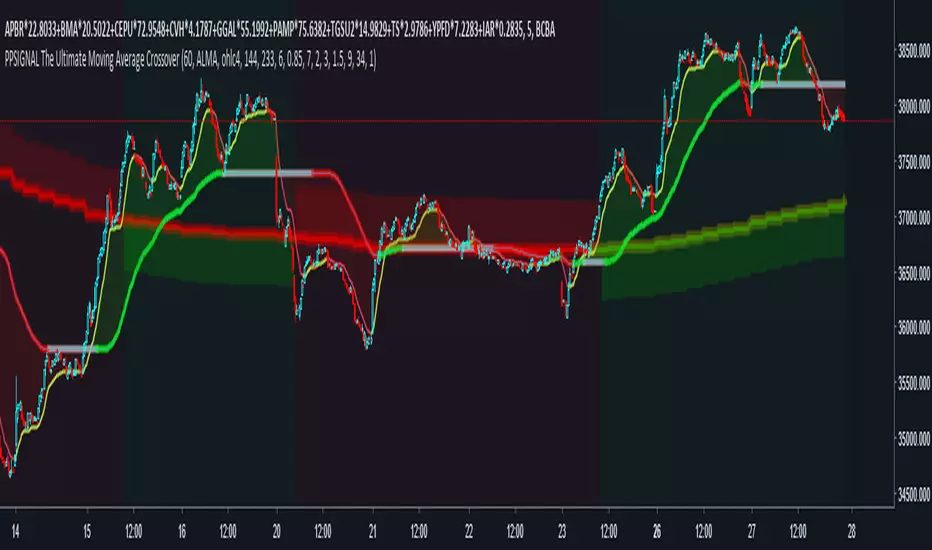
PpSignal The Ultimate Moving Average CrossoverNo matter how many times I explore new concepts, I tend to always incorporate a moving average, or two (if not on price, then on an oscillator). I am going to show the settings I have found to be most beneficial for finding the trend for the ES, forex, crypto etc. First, I have to admit, it is not just a simple crossover. Instead, it is a combination of a MA cross, Multi-Time Frame (MTF), and direction of a normalized moving average.

Intelligent Moving Average (AI)
Introduction
This indicator uses machine learning (Artificial Intelligence) to solve a real human problem.
The Moving Average is the most used indicator on the planet, yet no one really knows what pair of moving average lengths works best in combination with each other.
A reason for this is because no two moving averages are always going to be the best on every instrument, time-frame, and at any given point in time.
The " Intelligent Moving Average " solves the moving average problem by adapting the period length to match the most profitable combination of moving averages in real time.
How does the Intelligent Moving Average work?
The artificial intelligence that operates these moving average lengths was created by an algorithm that tests every single combination across the entire chart history of an instrument for maximum profitability in real-time.
No matter what happens, the combination of these moving averages will be the most profitable.
Can we learn from the Intelligent Moving Average?
There are many lessons to be learned from the Intelligent Moving Average. Most will come with time as it is still a new concept.
Adopting the usefulness of this AI will change how we perceive moving averages to work.
Limitations
Ultimately, there are no limiting factors within the range of combinations that has been programmed. The moving averages will operate normally, but may change lengths in unexpected ways - maybe it knows something we don't?
Thresholds
The range of moving average lengths is between 5 to 40.
Additional coverage resulted in TradingView server errors.
Future Updates!
Soon, I will be publishing tools to test the AI and visualise what moving average combination the AI is currently using.

PpSignal Composite Fractal Behavior (CFB)CFB tells you how long the market has been in a quality trend. This value can be used to adjust the period length of other indicators, especially stochastic bands.In order to quantify the overall duration of a market's trend, we replaced classical cycle analysis methods (FFT, MEM, MESA) with a form of analysis that works even when no cycles exist. We accomplished this by examining a time series for specific fractal patterns of any size. We then gather all the patterns found and combine them into one overall index, CFB (Composite Fractal Behavior) Index.For good reason, CFB does not analyze time series data for dominant cycles. Classical cycle analysis examines data points (e.g. prices) and estimates the average presence of a cycle in the window. Now suppose a cycle with a period length of 9 days was strong for 50 days and then disappeared for the next 21 days

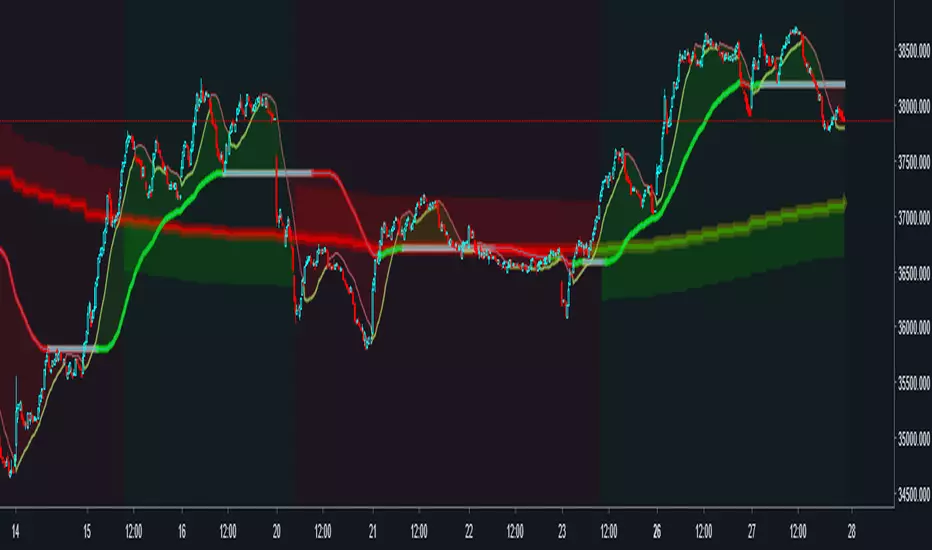
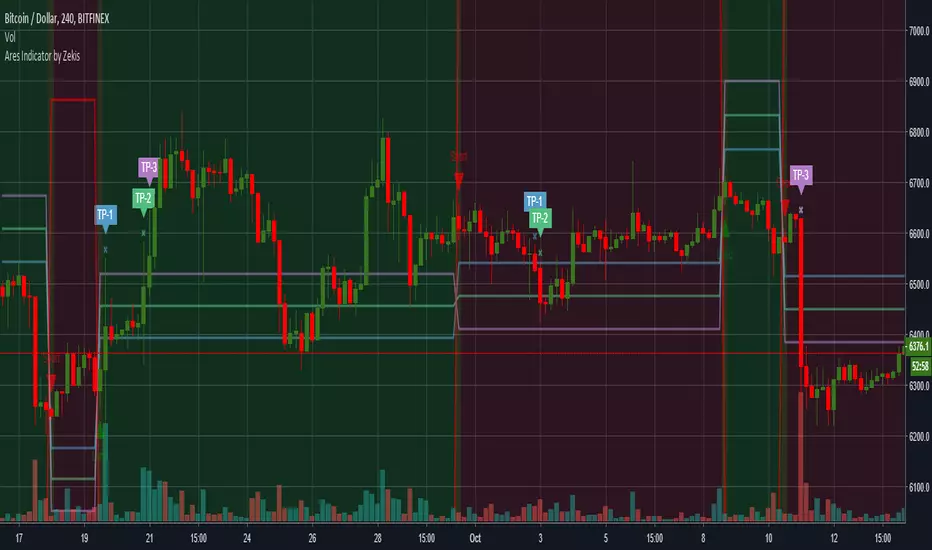
Ares Indicator by ZekisAres Indicator
System Algorithm based on historical price probabilities, with moving averages modified for optimal results.
Buy/Long when background turns green.
Sell/Short when background turns red.
There are 3 Take Profits and a Stop Loss, marked with lines for a better view and with symbols when it get there.
You can set them as you want to meet your requirements.
Alerts are added.
Enjoy!
@ Zekis
PpSignal ALL MOve Average 1.0Different moving average, Kaufman Adaptive Moving Average, Wilder's Moving Average, Triangular Moving Average , ZLEMA, EMA, SMA , HULL, ALMA, TEMA, ETC. -
BITFINEX:BTCUSD
Market direction and pullback based on S&P 500.A simple indicator based on www.swing-trade-stocks.com The link is also the guide for how to use it.
0 - nothing. If the indicator is showing 0 for a prolonged amount of time, it is likely the market is in "momentum mode" (referred to in the link above).
1 - indicates an uptrend based on SMA and EMA and also a place where a reversal to the upside is likely to occur. You should look only for long trades in the stock market when you see a spike upwards and S&P 500 is showing an obvious uptrend.
-1 - indicates a downtrend based on SMA and EMA and also a place where a reversal to the downside is likely to occur. You should look only for short trades in the stock market when you see a spike upwards and S&P 500 is showing an obvious uptrend.

@WACC Volatility Weighted PUT/CALL Positions [SPX]This indicator is based on Volatility and Market Sentiment. When volatility is high, and market sentiment is positive, the indicator is in a low or 'buy state'. When volatility is low and market sentiment is poor, the indicator is high.
The indicator uses the VIX as it's volatility input.
The indicator uses the spread between the Call Volume on SPX/SPY and the Put Volume.
This is pulled from CVSPX and PVSPX.
When volatility and put/call reaches a critical level, such as the levels present in a crisis or a sell off, the line will be green. See Sept 2015, 2008, and Feb 2018.
This level can be edited in the source code.
As the indicator is based on Put/Call, the indicator works best on larger time frames as the put/call ratio becomes a more discernible measure of sentiment over time.

Profit Maximizer 90%-95% IntraDayTrade Strategy WithTester Developed for Intraday and for very very Lesser Time Frame Trading. Note: Invite only Script .Request to me Access permission to test this.
Strategy tester enabled .All you can test this in live market in any segment.
Lesser the time frame greater the success rates as the test results.
This can be used : Crypto Currency/Bitcoins ,Forex,currencies ,Index ,Commodity Gold/silver ,Oil Market and in Equity /Futures
It will work for BINARY OPTION ,BINARY DIGITAL to enter and hold the position in right direction, User test it and confirm .
How to Use:
Three Main Zone BackGrounds: 1. Green Zone 2. LightRed Zone 3. Yellow Zone
1.Long only when Bar Color changed from Red or Black to BLUE and BackGround in Green, Hold the position until opposite color comes.
2.Short when BAR become Black and BackGround Red Exit when opposite color come.
3.Yellow Back Ground : Risk Trade Zone : When Red BARs Cautious Short , Yellow Zone LightGreen Bars (Avoid Trade) .In Yellow Zone Close the previous Entered postions.
Time Frame : Lesser Time Frame and holding for longer time will give Good Result . 1min-1Hrs . This will not work >1Hr Strategy and Candle will disappear >1hr TimeFrame.
Strategy Tester : Choose any Date Month Year to Current Date and check the results below in the Strategy Tester.
REPAINT/NO REPAINT : No Repaint ,Previous candles and Background Color wont change. In the current candle position wait for the candle to close to see the stability.Current candle color might oscillate bit However it will not change from Blue to Black or Black to Blue or Black to Red.
Note : Last Bar will be a actual Green or Red Bar by Default Do not Confuse with this.It is trading view default strategy design working way.Once Bar closes actual strategy color will appear.
ALERT /AUTOVIEW capabilities : Strategy Tester does not support ALERT by default as you all know.In the Indicator version Alert will be added for all Buy Sell and cover entries.
Test the strategy.
SCRIPT : Access must be given by me to test this .Once access given you can test ,Request for access .Without access Study Not Auth error will come.
Review and Feedback.Thank you!
Refer the Release notes for any updates and my posts below and in my idea page for more details. Thank you!
Any issues report to me to Fix.Thank you!

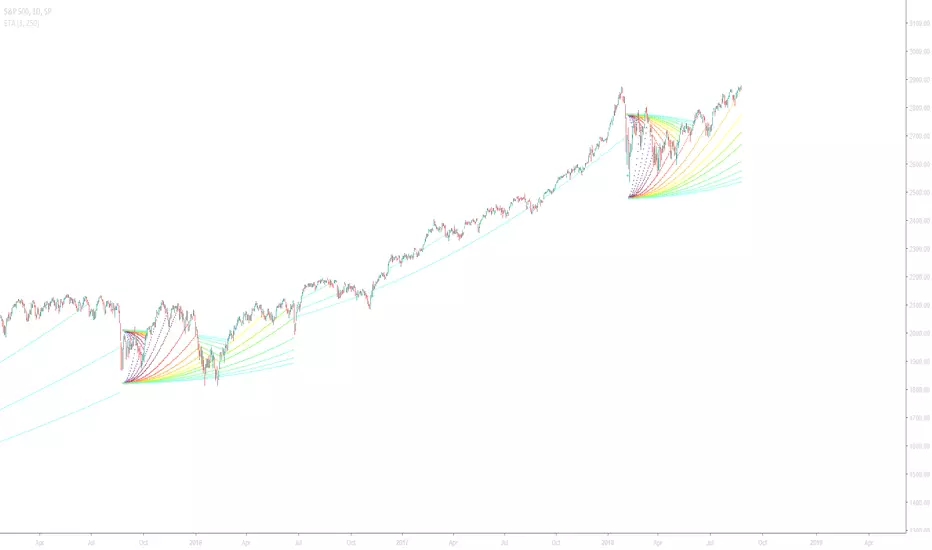
Extreme Trend Amplifier (ETA)Introduction
This indicator was created in V3 Pinescript and all projections will be displayed in real-time for active trading use.
This indicator has been designed so that it can be used across a range of securities such as equities, bonds, FX and cryptocurrencies.
All time-stamps are supported.
Comment and Like to try it out!
Understanding the Extreme Trend Amplifier
Extreme price changes are often result in a change of trend. This indicator not only allows you to identify the breakout, but to follow the direction of the change. Below is an example of the indicator using normal input values and the Dark TradingView Theme.
The Extreme Trend Amplifier is an indicator that measures the rate of change within a bar of the time stamp and plots a function when the user-defined threshold has been breached. The plot projects parabolic lines that squeeze towards the market price at an ever-increasing rate. The acceleration can also be defined in the indicator settings panel.
Indicator Utility
The first example below is the forex pair, AUD/USD using a rate threshold of 1% and an acceleration factor of three and the second using a rate threshold of 0.8% and an acceleration factor of nine.
We can observe that an increased rate threshold results in fewer instances and that a higher acceleration factor results in the instance projecting farther.
Notice that the acceleration factor is inversely related.
Input Values
Select the “ Format ”, button located next to the indicator label to adjust the input values and the style.
Rate of change (ROC) is the percentage rise/fall of the security within the time stamp. If ROC is set to 1, this is directly proportionate to 1%.
Securities such as cryptocurrencies are very volatile and will require an increased threshold.
Forex pairs will require a reduced threshold in order to produce an output as volatility is far less.
The line color, thickness and style can also be personalised to customise the strategy even further.
In this example, I have adjusted the projected instance that appears below the bars blue and above the bars red, indicating an uptrend or downtrend.
It is also possible to change specific bars in order to identify the extent to which a trend has continued as seen below.
If you would to find out more about this indicator, visit www.kenzing.com
Merykatoji Strategy on SPX500 USIdea from Moving average + William Fractal + ATR
This script is backtested from 01/01/2017 till now with a profit of 0.57% and loss of 0.56%.
The strategy is running in real-time on the hourly chart
Explanation
Green-dot: Price of take profit
Purple-dot: Price of stop loss
==> Help you be a tiny bit more discipline :D
Possible leverage ( if you are risky as me) = 1 :1 - 1:50
At the time posting there is a long signal coming up
Want to understand more ??? feel free to give me a message or comment directly below
I also wrote the same strategy for other 15 pairs of fx :) give me a like and ill start posting more :'O
Happy trading => M E R Y K A T O J I
