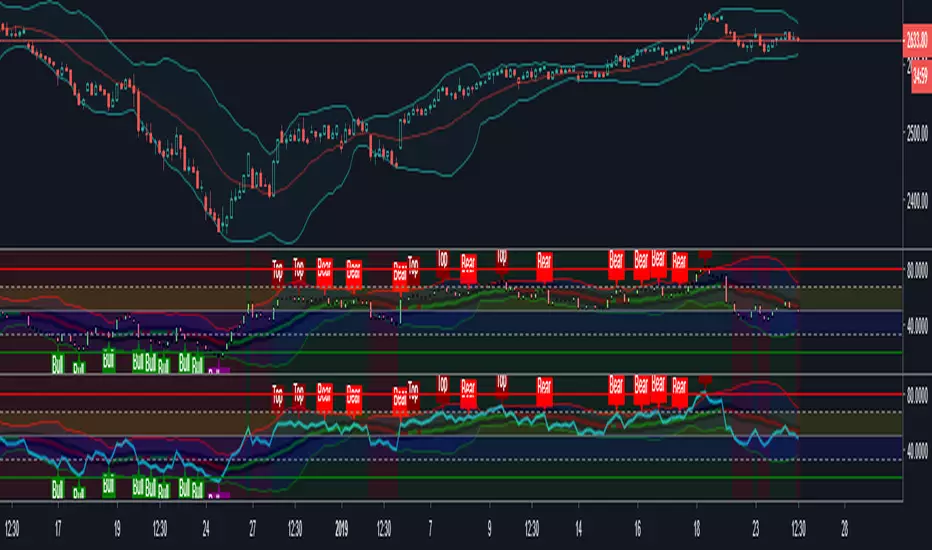
S&P 500 (SPX500)

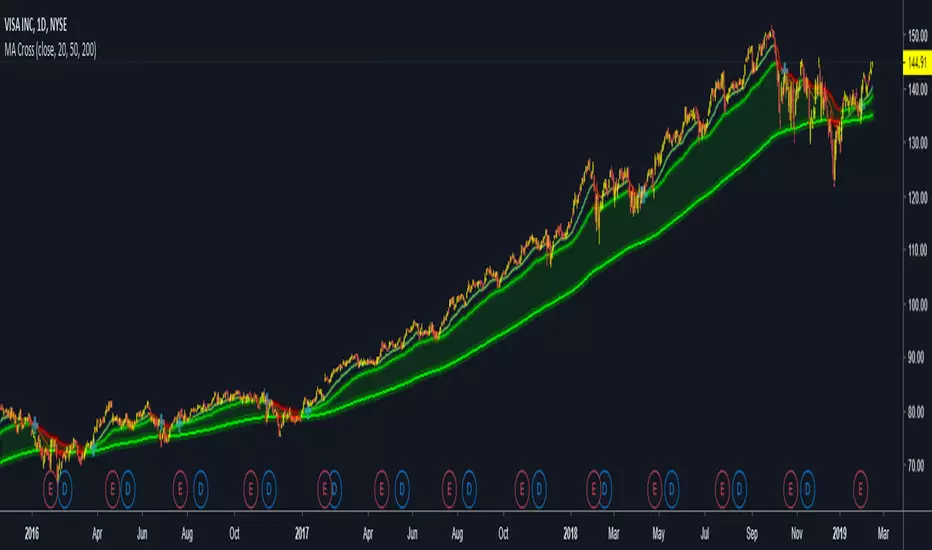
PpSignal Korean Strategysimple trading system for any time not exceeding 4 hours or D in stock.
configuration:
for futures, forex, bitcoin and assets that operate 24 hours, put the candle converter in D if you are in a chart less than 1H, for 4H charts and daily put candle coverter in W.
IF YOU ARE GOING TO OPERATE STOCK BONDS ETC. ONLY ONE-DAY ACTIVITIES DAY, USE THE CANDLE CONVERTER IN D ...
Operative
If the background is green, only take buy positions, the bars will be painted in lime color.
If the background is dark red, only take the beams of sell, the bars will be red
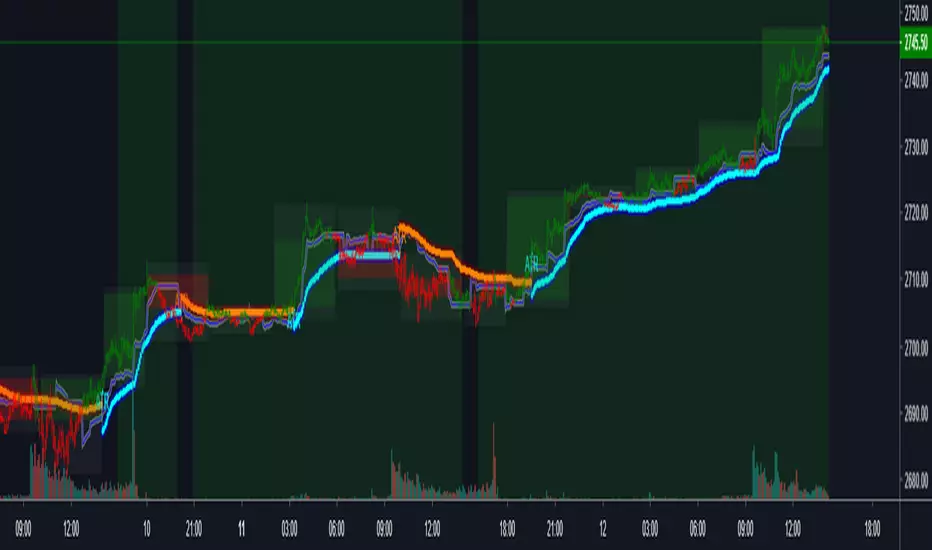
PpSignal Super Trend Smooth Trend Trader StrategySuper trend scalp system, buy when the bar is green and sell when the candle is red.
you can use in all time frame

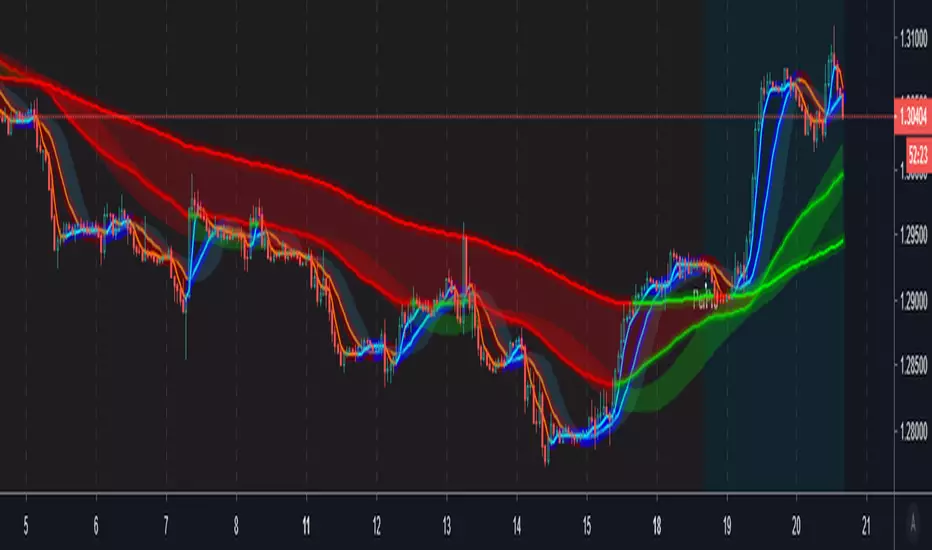
PpSignal SuperTrendPpSignal supertrend channel is calculated with eldher super smooth system.
we added PpSignal CFB move average
PpSignal Golden Cross V2In this version added CFB and move out Vidya, cfd is more and quickly for anticipate the change trend.
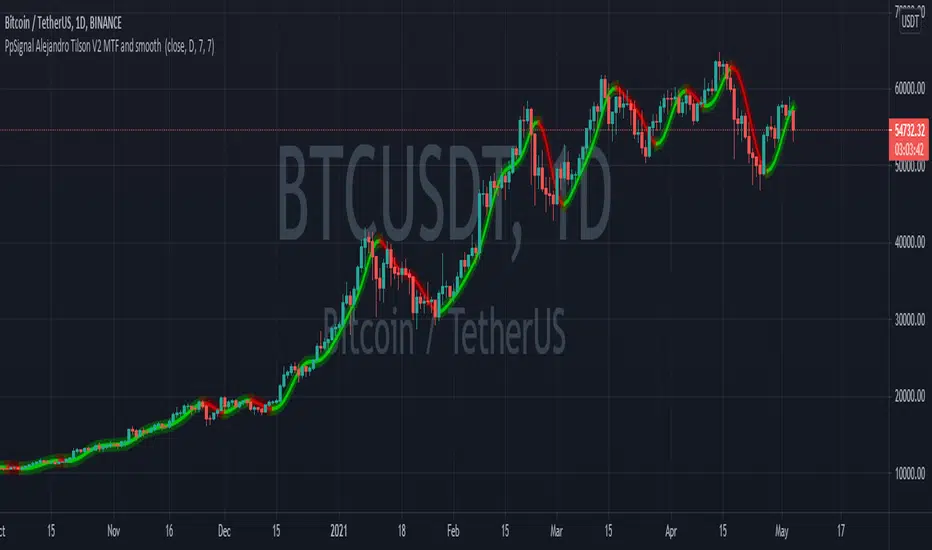
Alejandro Tilson T3 V2 MTFTilson Move average with John Ehlers smooth system adn buy or sell signal trade.
enjoy
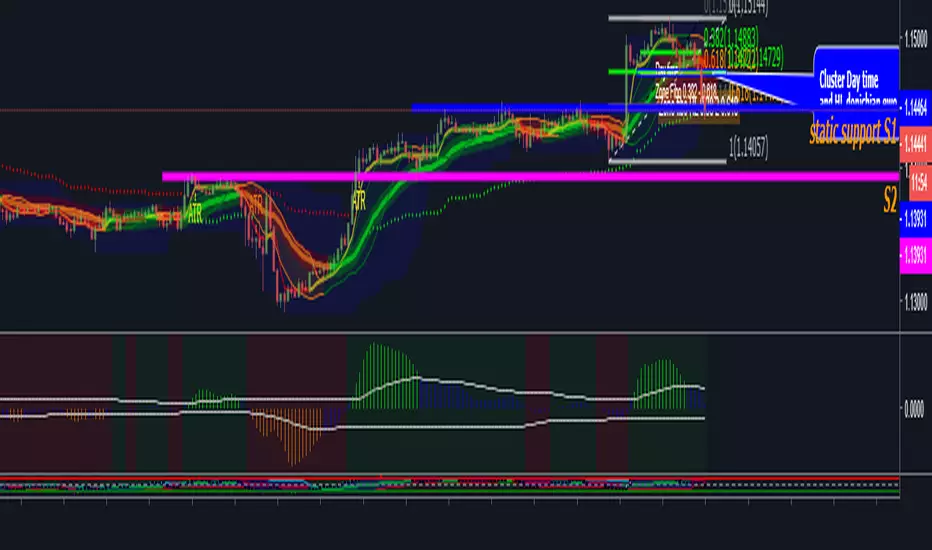
PpSignal Personal TemplateThis is my personal template strategy, I follow the tendency, with
-Donichian: I can se the high and low price.
-CFB: ha can see the trend short.
-Tigger MA: i can see the long trend.
-BB: I can see the short trend and the volatily.
-Ewo break band and Rsi Donicihan channel, the trend and oversold and overbought.
-PPSignal Scalper Double Cross Signal and EWO Smooth V4.0 for the background trend.
PpSignal Candle converter and psignal golden fibo zone.
PPSignal Scalper Double Cross Signal and EWO Smooth V4.0Recomendation
-for grafic 4h and D use
PPS W Signal
EWO W Signal
-For signal 30 min to 3H
PPS D and W signal
EWO D Signal
For signal < 30 Min
PPS 1H and $h
EWO 1H


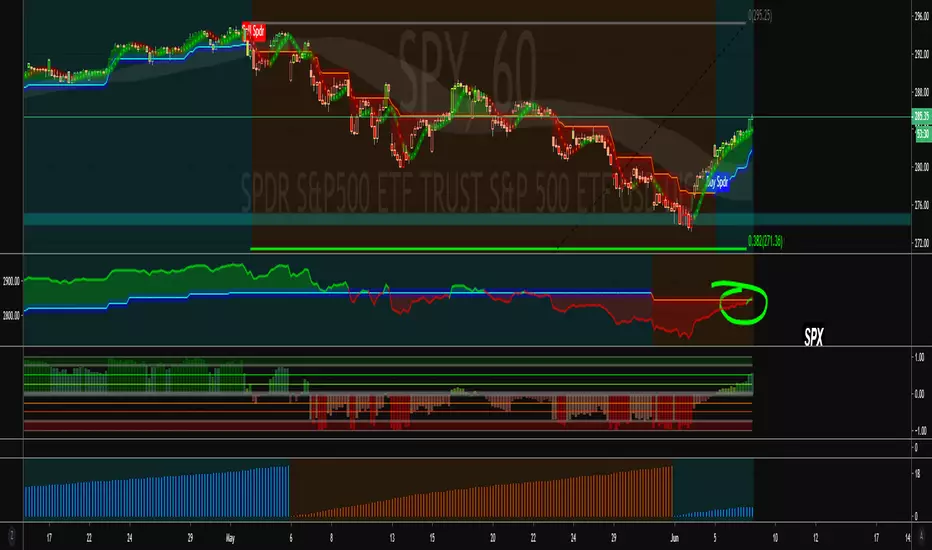
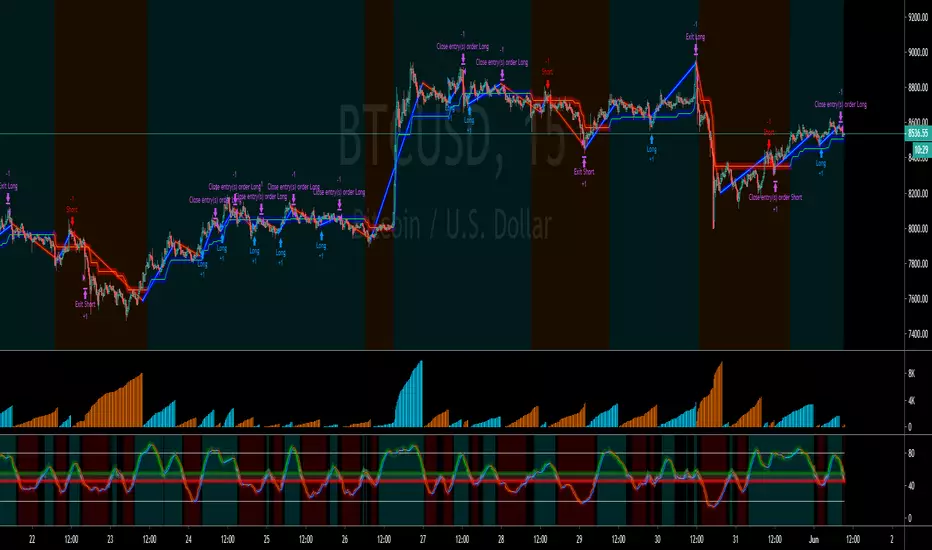
PpSignal Donchian Channels CFB and BB StrategyHere we are combine cfb with bollinger band and donichian midle line channel estrategy
This technique is for those who want the most simple method that is very effective. The best trade are during the busiest trading hours, 3am to 12am EST NY time. This method does not work in sideways markets, only in volatile trending markets.
Time Frames: 1, 5, 10, 15, 30 min.
Currency pairs: majors and btc
Essential chart indicator
-Ppsignal EWO BB, ( )
Other Chart indicators:
- Awesome Oscillator. ( )
- Optionally Add Squeeze Indicator ( )
- Bollinguer band period 13 desviation 1.
BUY SIGNAL
-Ewo above 0
-CFB crosses the middle donichian channel.
-CFB crosses ariiba from the upper band of bollinguer band.
SELL SIGNAL
- Ewo below 0
- CFB crosses below the middle channel
- CFB crosses below the signal bb.
Wath is CFB?
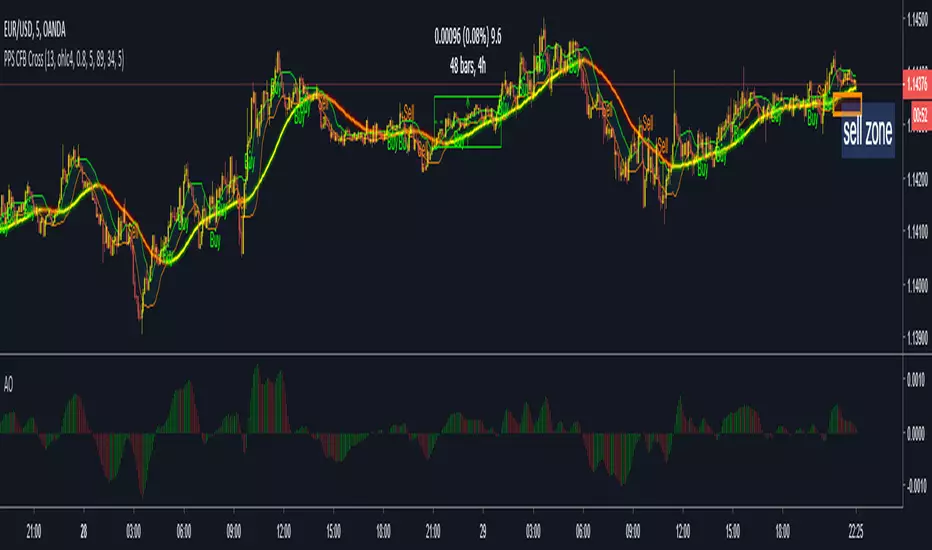
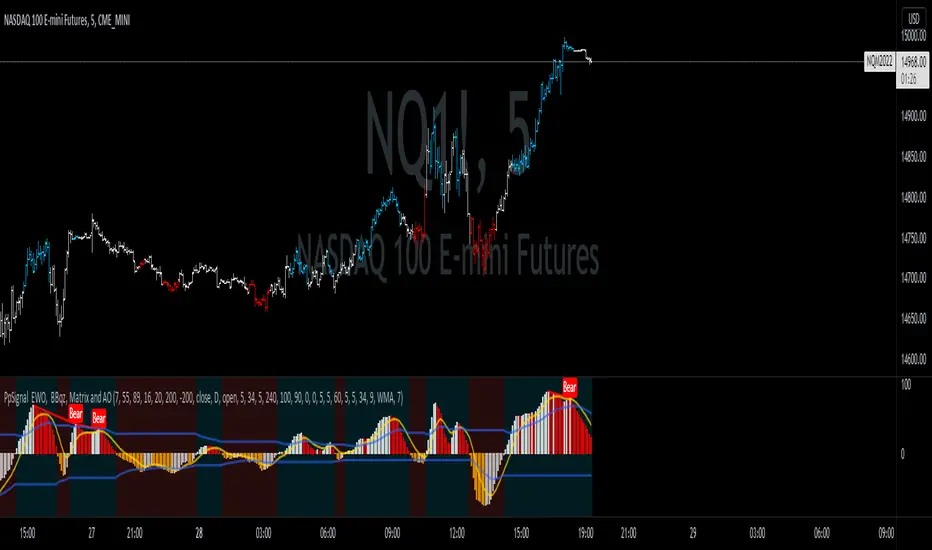
PPSignal BB-EWO BB $ CFB Strategy ScalpThis indicator is an implementation of the Bollinger Band, CFB and EWO Oscillator Scalping system.
This technique is for those who want the most simple method that is very effective. It is BEST traded during the busiest trading hours, 3am to 12am EST NY time. This method doesn't work in sideways markets, only in volatile trending markets.
-Time Frames: 1, 5, 10, 15 ,30 min.
-Currency pairs: majors, btc , futures and volatile stock.
Other Chart indicators:
Add EWO bb.
Optionally Add Squeeze Indicato or bbsqueeze .
Here's the strategy:
// Going LONG:
Enter a long position when CFB has crossed up through the Bollinger upper band (lime) . At the same time, the EWO BB or BBqueeze should be approaching or crossing it's zeroline, going up. This is indicated by "Buy" alert.
// Going SHORT:
Enter a short position when CFB has crossed down through the low Bollinger red. At the same time, the EWO BB or BBqueeze should be approaching or crossing it's zero line, going down. This is indicated by the "Sell" Alert.
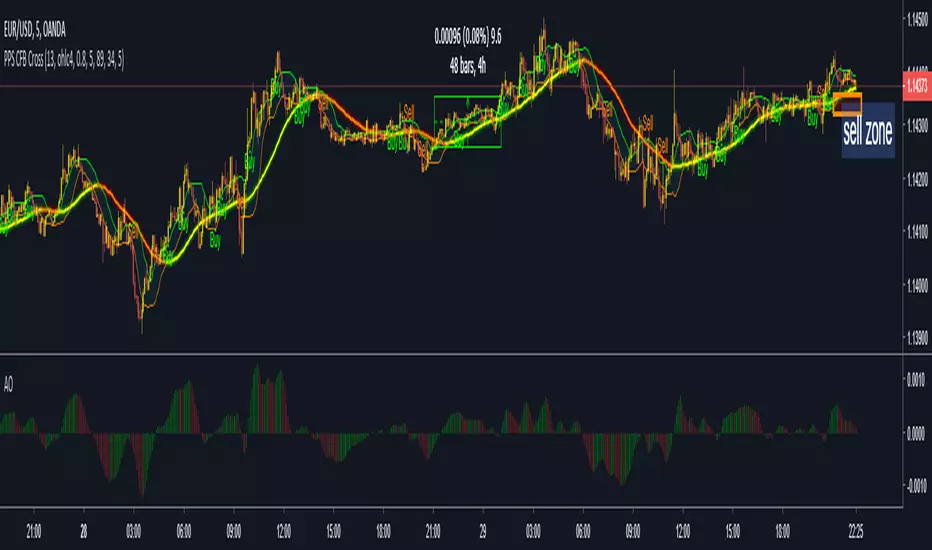
// Take profit:
// 10-20 pips depending on pair or When Awesome Oscillator turns a different color.
// HINTS: Best trades tend to occur when price reversing bounce off outer band and and outside Optional Bollinger Squeeze indication.
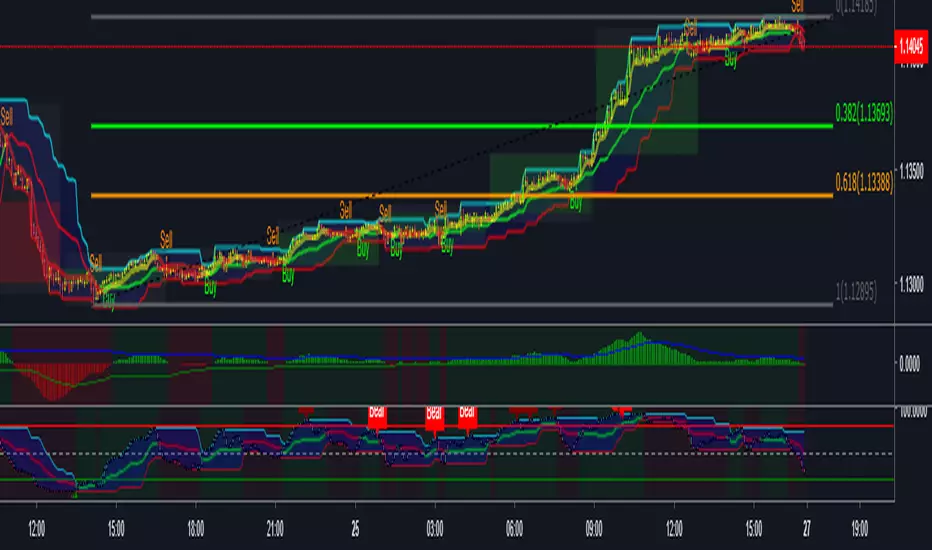
PpSignal Donchian Channels Gann HILO SmootheStrategy based on the growth of cfb and the middle donichian channel softened and ewo cross 0 signal.
- when cfb crosses up the middle donichian channel and ewo is up to 0 is buy
- when cfb crosses down the donichian middle channel and the ewo is below 0 , sell.
Attention: This strategy is recommended to be used in periods of volatility, see (). You can use btc, forex, futures, and penny stock.
PPSignal BB-EWO BB $ CFB Strategy ScalpThis indicator is an implementation of the Bollinger Band and EWO Oscillator and CFB Scalping system.
This technique is for those who want the most simple method that is very effective. It is BEST traded during the busiest trading hours, 3am to 12am EST NY time. This method doesn't work in sideways markets, only in volatile trending markets.
-Time Frames: 1, 5, 10, 15 ,30 min.
-Currency pairs: majors, btc , futures and volatile stock.
Other Chart indicators:
Add EWO bb.
Optionally Add Squeeze Indicato or bbsqueeze .
Here's the strategy:
// Going LONG:
Enter a long position when CFB has crossed up through the Bollinger upper band (lime) . At the same time, the EWO BB or BBqueeze should be approaching or crossing it's zeroline, going up. This is indicated by "Buy" alert.
// Going SHORT:
Enter a short position when CFB has crossed down through the low Bollinger red. At the same time, the EWO BB or BBqueeze should be approaching or crossing it's zero line, going down. This is indicated by the "Sell" Alert.
// Take profit:
// 10-20 pips depending on pair or When Awesome Oscillator turns a different color.
// HINTS: Best trades tend to occur when price reversing bounce off outer band and and outside Optional Bollinger Squeeze indication.
// References:
https://www.forexstrategiesresources.com...

PPSignal BB and EWO BB Strategy ScalpDescription:
This indicator is an implementation of the Bollinger Band and EWO Oscillator Scalping system.
This technique is for those who want the most simple method that is very effective. It is BEST traded during the busiest trading hours, 3am to 12am EST NY time. This method doesn't work in sideways markets, only in volatile trending markets.
-Time Frames: 1, 5, 10, 15 ,30 min.
-Currency pairs: majors, btc, futures and volatile stock.
Other Chart indicators:
Add EWO bb.
Optionally Add Squeeze Indicato or bbsqueeze .
Here's the strategy:
// Going LONG:
Enter a long position when Curve Slope has crossed up through the Bollinger upper band (lime) . At the same time, the EWO BB or BBqueeze should be approaching or crossing it's zeroline, going up. This is indicated by "Buy" alert.
// Going SHORT:
Enter a short position when Curve Slope has crossed down through the low Bollinger red. At the same time, the EWO BB or BBqueeze should be approaching or crossing it's zero line, going down. This is indicated by the "Sell" Alert.
// Take profit:
// 10-20 pips depending on pair or When Awesome Oscillator turns a different color.
// HINTS: Best trades tend to occur when price reversing bounce off outer band and and outside Optional Bollinger Squeeze indication.
// References:
www.forexstrategiesresources.com


PpSignal Donchian Channels Gann HILO SmootheThe traditional donchian channel with Gan Hilo smooth moving average.
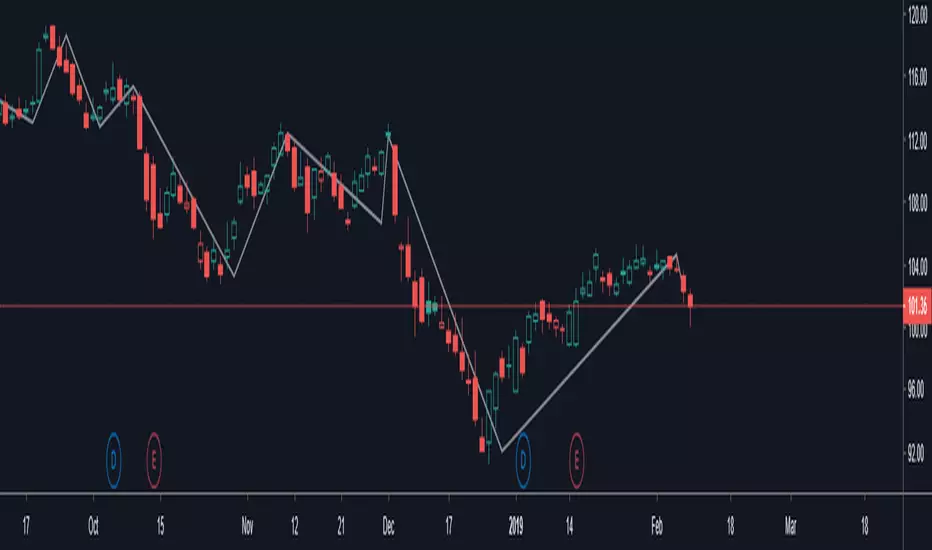
PpSignal AK_TREND ID// in a up or down trend.
// For SPX or SPY ONLY, Time Frame = Monthly, weekly or daily
// Created by Algokid 7/23/2014
// Toronto, Canada

SPY SECTOR MONEY FLOW ANALYTICSSPY AND DJI SECTOR VOLUME ADVANCE AND DECLINE
THIS CONTAINS THE KEY CONSTITUENTS OF SPY AND DJI TO HELP TRADERS TO PROVIDE HOW UNDERLYING VOLUME AFFECTS THE REVERSAL
