[_ParkF]Linreg & Trendlines* The script has been uploaded again.
Linear regression and trendline not only facilitate trend identification,
but also identify support and resistance within it,
and linear regression and trendline departure can detect trend changes, which are useful in trading.
Linear regression and trend lines are shown in the chart.
It offers a variety of options, length, color, thickness, on/off switch, etc.
I hope it will help you with your trading.
hope you become rich!
---------------------------------------------------------------------------------------------------------------------------
* 스크립트가 다시 업로드 되었습니다.
선형 회귀(채널) 및 추세선은 추세 식별을 용이하게 할 뿐만 아니라,
또한 그 안에서 지지와 저항을 식별하고,
선형 회귀(채널) 및 추세선 이탈은 거래에 유용한 추세 변화를 감지할 수 있습니다.
선형 회귀(채널) 및 추세선이 차트에 표시됩니다.
길이, 색상, 두께, 온/오프 스위치 등 다양한 옵션을 제공합니다.
거래에 도움이 되셨으면 합니다.
부자되세요!
---------------------------------------------------------------------------------------------------------------------------
* I would like to express my gratitude to zdmre for revealing the linear regression source.
Pesquisar nos scripts por "trendline"

ALMA TrendlineThis is a simple indicator to make ALMA Trendline to be used as STOP LOSS guidance in trending market. The trendline will change color from GREEN to RED and vice versa once price crossing down or crossing up the trendline.

[astropark] Support Resistance Trendlines Swing PointDear Followers,
I'm very happy to publish this new tool, which will help you easily find
basic trend momentum (red if a bearish momentum is found, green viceversa)
Support Levels (where you can place your buy orders or short targets)
Resistance Levels (where you can place your sell orders or long targets)
Trendlines , known as diagonal supports and resistances (if price breaks a green one, then it's time to buy/long! otherwise if price breaks a red one, then it's time to sell/short)
Donchian Channel , which will memorize for you latest highs and lows, which may get retested for example
Swing Point , very useful point where to open a position while price holding above or below it
This script:
works on all timeframes
lets you edit each support-resistance cloud settings
lets you activate a third support-resistance cloud if you like
lets you choose if enable only one or disable all of them or whatever combination...
lets you choose to enable or disable trendlines, basic trend, donchian channel, swing point, etc... So very customizable user experience!
This is a premium indicator , so send me a private message in order to get access to this script.

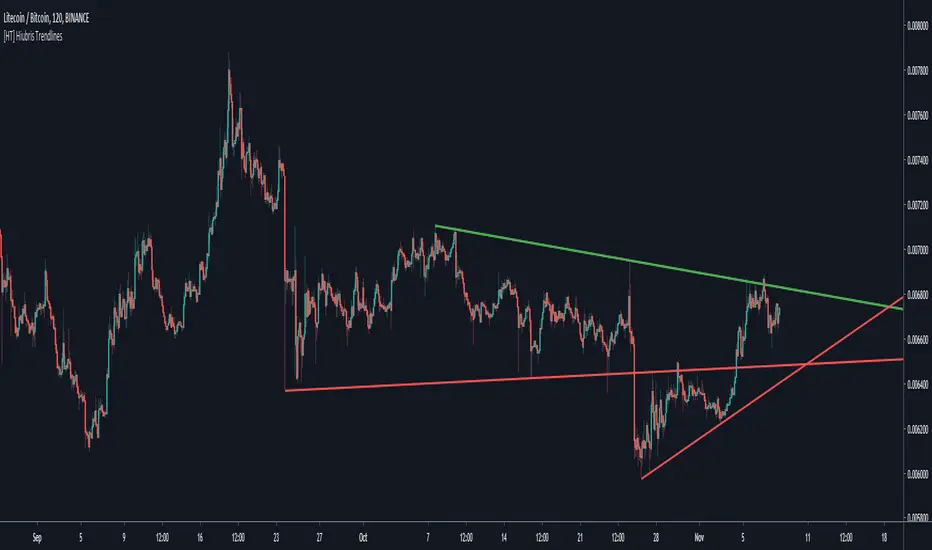
[HT] Hiubris TrendlinesHOW IT WORKS
This script automatically draws the last 2 TrendLines based on pivot points on the chart (wick to wick)
- Users can adjust the lookback length of those pivot points
NOTES
This Script is meant to help traders easily identify Trends and Trendlines
* This indicator does NOT Repaint! None of our published indicators repaint!
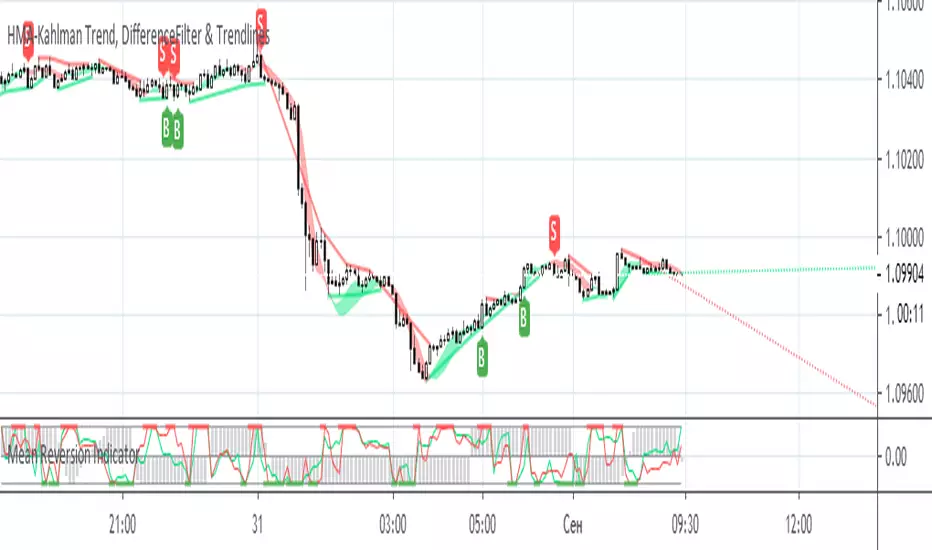
HMA-Kahlman Trend, DifferenceFilter & TrendlinesThis update to the previous HMA-Kahlman Trend, Clipping & Trendlines script features the same structure with the three modules:
- Trendlines module,
- NEW Winsorizing submodule using difference-based filtering.
- HMA-Kahlman Trend module.
The Winsorizing submodule filters signals by a volume level, eliminating the ones with the volume below a threshold. This module substitutes the previous 'low-level' filtering implementation. This time it filters out based on difference between scaled volume and its moving average.
Tested with BTCUSD.
HMA-Kahlman Trend, Clipping & TrendlinesThis script utilizes three modules:
- Trendlines module (by Joris Duyck),
- Winsorizing submodule and
- HMA-Kahlman Trend module.
The Trendlines module produces crossovers predictive of the next local trend. The Winsorizing (clipping) submodule filters signals by a volume level, eliminating the ones with the volume below a threshold. The last feature obviously does not work with the assets not supporing Volume, so set the Winsorizing submodule to false. The Winsorizing and Trendlines modules can be turned off.

HMA-Kahlman Trend & TrendlinesThis script utilizes two modules, Trendlines module (by Joris Duyck) and HMA-Kahlman Trend module. Trendlines module produces crossovers predictive of the next local trend.

Fibonacci TrendlinesCOINBASE:ETHUSD
This indicator is bested with the 4 hour time frame.
This indicator shows 4 EMA trendlines based on the Fibonacci Sequence (8, 13, 21, 55). If the 8, 13, 21 trendlines crosses above the 55 and the volume is high, this is an indication for a long position. If the 8, 13, 21 crosses below the 55 (volume doesn't matter), this is an indication to exit the long position or an indication for a short position.

Auto trendline (Spicytrader) DESCENDING
Real time identification of trend lines
Get ready before the next breakout.
The trend lines are formed by two adjacent troughs in a bearish or bullish market.
You don’t need to draw the trend lines by hand anymore.
GET ACCESS : spicytrader.com

Auto trendline (Spicytrader) ASCENDING
Real time identification of trend lines
Get ready before the next breakout.
The trend lines are formed by two adjacent troughs in a bearish or bullish market.
You don’t need to draw the trend lines by hand anymore.
GET ACCESS : spicytrader.com

SMC + FVG + EMA + TrendlinesSMC + FVG + EMA + Trendlines legRange = math.abs(structureHigh - structureLow) // <-- เปลี่ยนชื่อจาก range -> legRange
if showCurrentStruct and not na(structureHigh) and not na(structureLow)
if na(curHighLine) == false
line.delete(curHighLine)
if na(curLowLine) == false
line.delete(curLowLine)
curHighLine := line.new(sHighIdx, structureHigh, bar_index, structureHigh, xloc.bar_index, color=currentStructColor, style=currentStructStyle, width=currentStructWidth)
curLowLine := line.new(sLowIdx, structureLow, bar_index, structureLow, xloc.bar_index, color=currentStructColor, style=currentStructStyle, width=currentStructWidth)
// ---------- Fibonacci on current leg ----------
if showFibo and legRange > 0
for k = 0 to array.size(fLevels) - 1
lvl = array.get(fLevels, k)
price = sDir == 1 ? structureHigh - (legRange - legRange * lvl)
: structureLow + (legRange - legRange * lvl)
l = line.new(sDir == 1 ? sHighIdx : sLowIdx, price, bar_index, price, xloc.bar_index, color=fiboColorMain, style=fiboStyle, width=fiboWidth)
label.new(bar_index + 10, price, str.tostring(lvl) + " (" + str.tostring(price) + ")", style=label.style_none, textcolor=fiboColorMain)

Click Draw TrendLine [UhoKang] v2
This is an indicator that directly draws a trend line by clicking on the candle.
Click to Create Trend lines !!
Create a trend line by connecting A, B, and C with three vertices.
1. Draw Bear Trend line
Click pivot high : First pivothigh of the downtrend line
Click pivot low : pivotlow of the downtrend line
Click pivot high : Second pivothigh of the downtrend line
2. Draw Bull Trend line
Click pivot low : First pivotlow of the uptrend line
Click pivot high : pivothigh of the uptrend line
Click pivot low : Second pivotlow of the uptrend line
Modefiy Trendlines
1. Edit Bear Trend line
Drag Red , ,
2. Edit Bull Trend line
Drag Green , ,

Support & Resistance Trendlines with PP + Fib. Channel█ Support & Resistance Trendlines with Pivot Points + Fibonacci Channel
This script automatically draw support and resistance trend lines based on pivot points and add a fibonacci channel.
It will show potential patterns with the help of support and resistance lines as well as breakout target and pullback entry with the fibonacci extension and retracement levels.
It is based on atolelole's script, I only made it more configurable so please check out his script.
I added the possibility to change values and add additional retracement and extension levels.
I also made it customizable with the possibility to change lines color, width and style.

[PX] Level & TrendlinesThe indicator identifies the intermediate fractal pattern, where neighboring fractals are either higher or lower. It plots horizontal level and trendlines based on those fractals and comes with a variety of settings.
If you are looking for someone to develop your on indicator or trading strategy, don't hesitate to get in touch with me here on TradingView or below.
Contact:
www.pascal-simon.de
info@pascal-simon.de

Fibonacci Trendlines 8-200In my opinion best EMA Trendlines there is, simple yet very reliable on any time frame, i found the version that had 8-13-21-55, so i decided to add 100 and 200 for higher time frames enjoy please share and like

Spicytrader [BUY and SELL signals + Breakouts + Trendline]
BUY and SELL signals (with alerts)
Support and resistant breakout (with alerts)
Auto trendlines : Bullish and bearish market (with alerts)
100% Compatible with Autoview bot (Buy, Sell, Takeprofit, Stop loss)
TRY IT FOR FREE : spicytrader.com

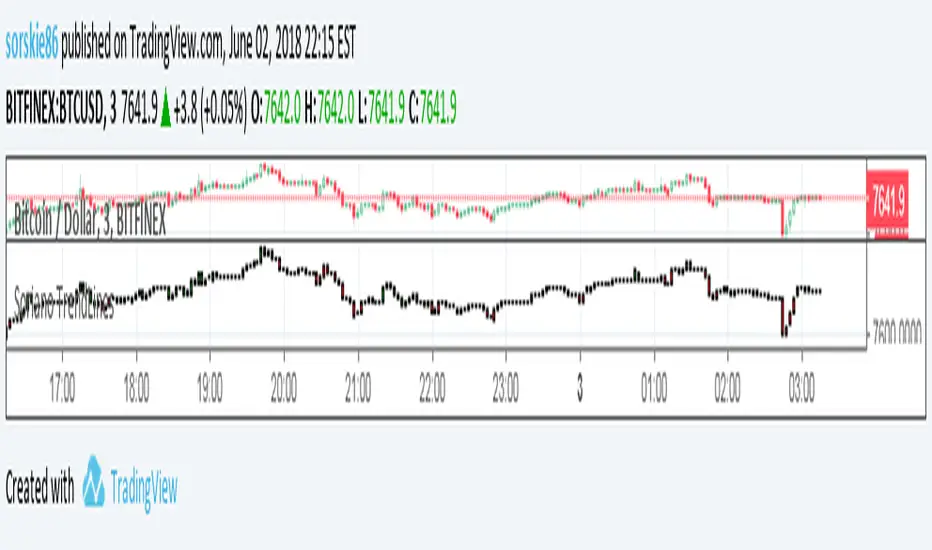
Soriano TrendLinesSoriano TrendLines is charting system where you can buy once candles goes green and sell or short ones candles are red.
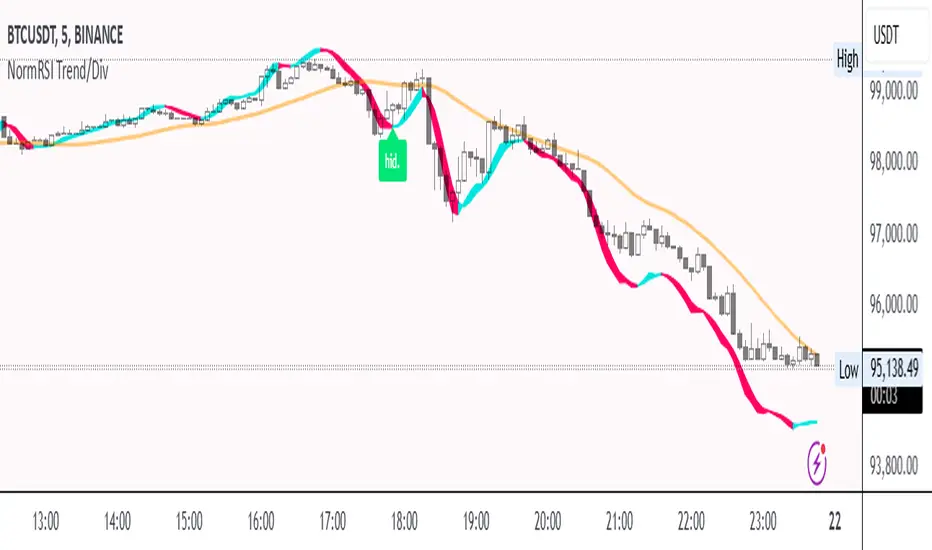
Normalized RSI Trendline with DivergencesNormalized RSI Trendline with Divergences
🔹 Overview
The Normalized RSI Trendline with Divergences indicator enhances traditional RSI analysis by normalizing RSI values within a defined range and applying a trend-following approach. It also detects bullish and bearish divergences to highlight potential trend reversals.
🔹 Features
✔ Normalized RSI Calculation – The RSI values are normalized between -1 and 1 to provide a clearer representation of market momentum.
✔ Trend & Center Lines – A trendline based on linear regression and an adaptive moving average (ALMA) for smoother trend visualization.
✔ Divergence Detection – Identifies regular and hidden divergences, displaying signals directly on the chart.
✔ Customizable Parameters – Users can adjust the signal period, lookback range, trend length, and divergence sensitivity to fit different trading strategies.
🔹 How to Use
Trend Following: The trendline helps identify the overall market direction.
Divergence Signals:
🟢 Bullish Divergence (Potential upward reversal)
🔴 Bearish Divergence (Potential downward reversal)
🟩 Hidden Bullish Divergence (Trend continuation signal)
🟧 Hidden Bearish Divergence (Trend continuation signal)
This script is suitable for trend traders, swing traders, and divergence-based strategies. Customize the settings to match your preferred trading style. 🚀
📌 Disclaimer: This script is for educational purposes only and does not constitute financial advice. Always conduct your own analysis before making trading decisions.
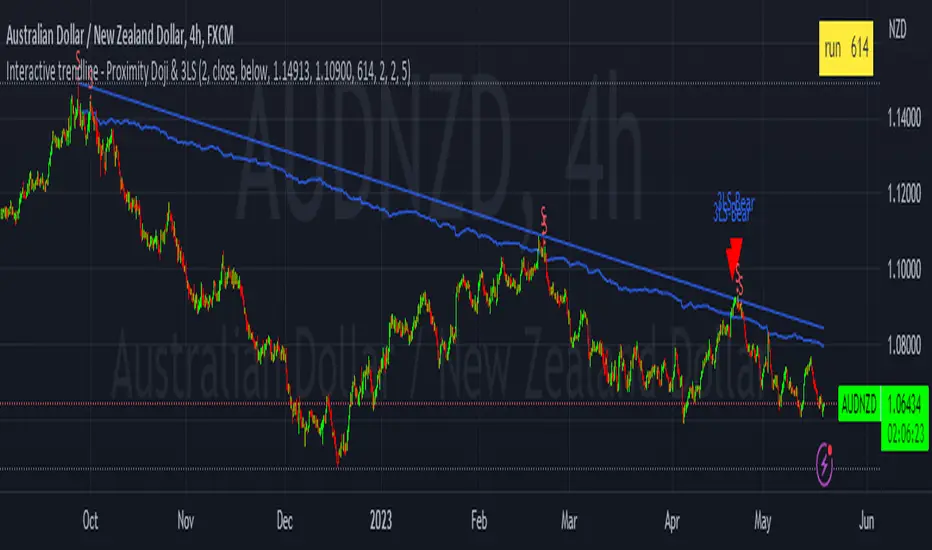
Interactive trendline - Proximity Doji & 3LSThis script was developed with Blockhead305 (seriously talented) and uses 1) the Three Line Strike from The Moving Average as well as 2) an original doji script written for me and 3) the Interactive Trendline as developed by Blockhead305. The basic premise is that should a doji or Three Line Strike occur within a customizable ATR distance from your trendline, an on-chart notification will appear or you could set an alarm to warn you if this has happened.
How to set this up:
Step 1 - Find a a trend
Step 2 - Identify the candles that touches the trendline
Step 3 - Click on the indicator
Step 4 - Set the X1 and Y1 coordinates for the start of the trend
Step 5 - Set the X2 and Y2 coordinates for the last relevant candle of the trend
Step 6 - Write the number in the yellow box down (in this case 880)
Step 7 - Open the settings of the indicator
Enter the number from the yellow box into the box titled "Run" - Press "OK"
Step 8 - Chart should/could now show Buy/Sell Signals for the Dojis and/or Bullish or Bearish Three Line Strikes
Notes
1. If your trendline is bearish (X1/Y1 is higher than X2/Y2) only bearish signals will appear and vice versa
2. You can change the ATR multiples from trendline in the settings - I prefer 2 (which is also the default)
3. You can toggle Big Engulfing and/or Three Line Strike on or off (exact functionality as per The Moving Average functionality)
4. You can construct the type of doji you would like to see at the bottom of the settings screen - I prefer the following settings:
Dominant Wick Multiple - 2
Recessive Wick Multiple - 2
Body Multiple - 5
5. I place my SL above last high (shorts) or last low (longs) but could also use the trendline for this
6. I use TP with RRR off 1:2 but much more is obviously possible.
7. ONLY ONE INTERACTIVE TRENDLINE CAN BE USED ON THE SAME CHART
8. THE NUMBER IN THE YELLOW BOX IS RELEVANT TO THE TIMEFRAME THAT THE TRENDLINE WAS CREATED ON. IF YOU CHANGE
TIMEFRAMES IT WILL NOT WORK
Happy to receive constructive criticism and/or suggestions for improvements on the settings.
[blackcat] L2 Ehlers Instantaneous TrendlineLevel: 2
Background
John F. Ehlers introuced Instantaneous Trendline (IT) in his "Rocket Science for Traders" chapter 10. Dr. Ehlers hope IT can enable us to compute a continuous trendline from which we can rapidly assess market action.
Function
blackcat L2 Ehlers Instantaneous Trendline (IT) is used to follow trend. IT is important because the dominant cycle component is always notched out. It follows that if the composite analytic waveform consists of only a trend component and a cycle component, and if we remove the cycle component, the residual must be the trend. Of course, this is not precisely true in reality, because there will always be components other than the dominant cycle present. However, this is a workable solution for trading purposes because the secondary cycles usually have a small amplitude.
Key Signal
Smooth --> 4 bar WMA w/ 1 bar lag
Detrender --> The amplitude response of a minimum-length HT can be improved by adjusting the filter coefficients by
trial and error. HT does not allow DC component at zero frequency for transformation. So, Detrender is used to remove DC component/ trend component.
Q1 --> Quadrature phase signal
I1 --> In-phase signal
Period --> Dominant Cycle in bars
SmoothPeriod --> Period with complex averaging
DCPeriod ---> Dominant Cycle Period
Trendline ---> IT fast line
SmoothPrice ---> IT slow line
Pros and Cons
100% John F. Ehlers definition translation of original work, even variable names are the same. This help readers who would like to use pine to read his book. If you had read his works, then you will be quite familiar with my code style.
Remarks
The 9th script for Blackcat1402 John F. Ehlers Week publication.
Readme
In real life, I am a prolific inventor. I have successfully applied for more than 60 international and regional patents in the past 12 years. But in the past two years or so, I have tried to transfer my creativity to the development of trading strategies. Tradingview is the ideal platform for me. I am selecting and contributing some of the hundreds of scripts to publish in Tradingview community. Welcome everyone to interact with me to discuss these interesting pine scripts.
The scripts posted are categorized into 5 levels according to my efforts or manhours put into these works.
Level 1 : interesting script snippets or distinctive improvement from classic indicators or strategy. Level 1 scripts can usually appear in more complex indicators as a function module or element.
Level 2 : composite indicator/strategy. By selecting or combining several independent or dependent functions or sub indicators in proper way, the composite script exhibits a resonance phenomenon which can filter out noise or fake trading signal to enhance trading confidence level.
Level 3 : comprehensive indicator/strategy. They are simple trading systems based on my strategies. They are commonly containing several or all of entry signal, close signal, stop loss, take profit, re-entry, risk management, and position sizing techniques. Even some interesting fundamental and mass psychological aspects are incorporated.
Level 4 : script snippets or functions that do not disclose source code. Interesting element that can reveal market laws and work as raw material for indicators and strategies. If you find Level 1~2 scripts are helpful, Level 4 is a private version that took me far more efforts to develop.
Level 5 : indicator/strategy that do not disclose source code. private version of Level 3 script with my accumulated script processing skills or a large number of custom functions. I had a private function library built in past two years. Level 5 scripts use many of them to achieve private trading strategy.

Spicytrader V4 [LONG and SHORT signals + Trendline]NEW VERSION : JUNE 2018
LONG and SHORT signals (with alerts)
Trendline : Bullish and bearish market (with alerts)
Compatible with Autoview bot (Open Long/Short)
Working with 1min* interval and more (1min to Month)
TRY IT FOR FREE : spicytrader.com
* Market has to be enough volatile to use it with 1min interval (Ok with ETHER for instance).
Use these scripts together to maximize profit
Spicytrader V4
Squeeze Momentum Indicator
Pivot Point High Low
How to use the script
Add the scripts to your chart
Select a time interval from 1min to 1 month which shows great trends (Multiple following colored candles)
Don't go if trends are not well defined
LONG position
The BLUE* candle is CLOSED and BULLISH (Green candle)
Squeeze Momentum Indicator is BULLISH
Trendline is BULLISH (Green)
Candle close above Trendline
Pivot Points are below or far enough
Don't go if trends are not well defined
* Dark blue is a strong buy signal
* Ligh blue is a weak buy signal but can be ok depending of the market
SHORT position
The YELLOW candle is CLOSED and BEARISH (Red candle)
Squeeze Momentum Indicator is BEARISH
Trendline is BEARISH (Red)
Candle close bellow Trendline
Pivot Points are above or far enough
Don't go if trends are not well defined
When to close a trade ?
Trend is over (New closed candle is NOT colored)
or Market direction is changing
or Pivot Point is reached and failed to cross
or You feel it
WARNING :
The purpose of these signals is to HELP/SUPPORT you to take a decision.
You need to analyse the general trend before placing an order.
Don't trust FOMO or FUD and do your own research
TRY IT FOR FREE : spicytrader.com
TRY IT FOR FREE : spicytrader.com
TRY IT FOR FREE : spicytrader.com
How to use it with Autoview
Add an alert (OPEN LONG or OPEN SHORT) and set it to "Once Per bar Closed" in order to place an order after the confirmation.
Refer to the official website (Autoview) bit.ly to get more information.

Mirror Trendline ToolThis indicator is an interactive mirror‑trendline drawing tool that uses three draggable points to build two related lines. Point One and Point Two define the primary (blue) trendline; Point Three defines the starting anchor for the mirrored line, which always has the opposite slope to the blue line and updates live as you move the anchor, giving continuous visual feedback while you drag it .
A color‑invert option automatically generates the mirrored line’s color by mathematically inverting the chosen base color while preserving its opacity, with a checkbox to disable inversion so both lines can share the same appearance . When “Stop at Intersection” is checked, both lines terminate exactly at their intersection, creating a clean V‑shaped construction that highlights the symmetry point between the reference move and its mirror . When the box is unchecked, both lines extend beyond that intersection, but their total duration is capped at no more than twice the original blue segment’s length, keeping projections proportionate and preventing excessively long rays from cluttering the chart .

