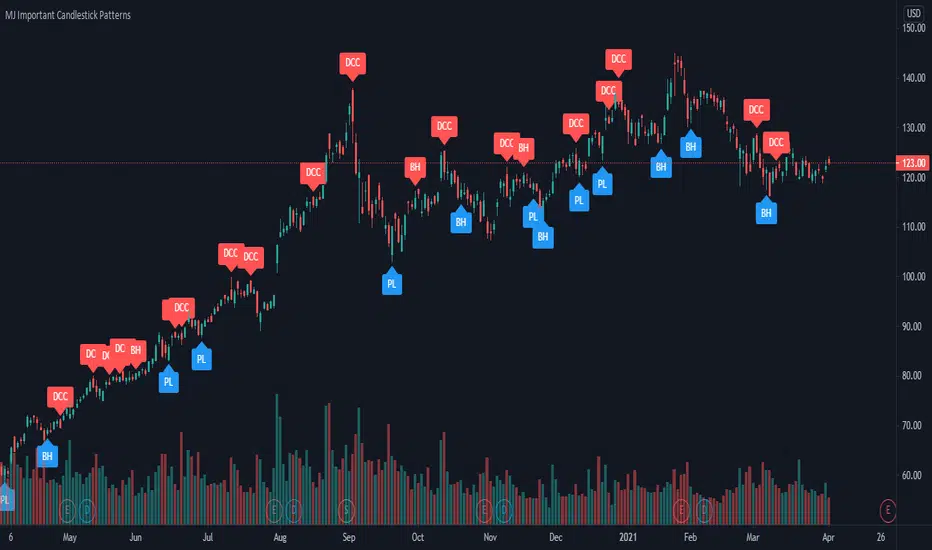
MJ Important Candlestick Patterns + Smart TrendThis script detects 6 important candlestick patterns defined by the author and puts chart labels on your chart for your attention. It also includes a smart trend checking algorithm to detect trends.
The six candlestick patterns covered are:
Bullish Engulfing
Bearish Engulfing
Piercing Line
Dark Cloud Cover
Bullish Harami
Bearish Harami
*** Smart feature of this indicator is that it can detect uptrends or downtrends before alerting you regarding the bullish or bearish reversal candlestick pattern. This is achieved by comparing the typical price (high+low+close divided by 3) of today's candle versus three days ago.
Pesquisar nos scripts por "smart"
Strategy Smart Forex Buy Sell Signal by LukasHi, I just convert my Smart Forex Buy Sell Signal into strategy.
BUY and SELL signal base on Price action, RSI , and Correlation between Forex Major Pairs.
It's only work for Forex Major Pairs because I only took their data.
Included alert : Spec, Buy, Strong
Recommended to wait for double signal :
Spec Buy > Buy or Spec Sell > Sell
Buy > Strong Buy or Sell > Strong Sell
So execute after the second signal triggered.
On this strategy I exclude Spec Sell/Buy on strategy test.
I use simple Profit/Loss 200/100 and 5 pyramid, you can play around with the setting.
And to improve the odds, simply use my Currency Strength Indicator to pick what pairs to trade. Choose Strong Vs. Weakness to get maximal profit. It help me to stay away from ranging pairs.
Any feedback are welcome :)

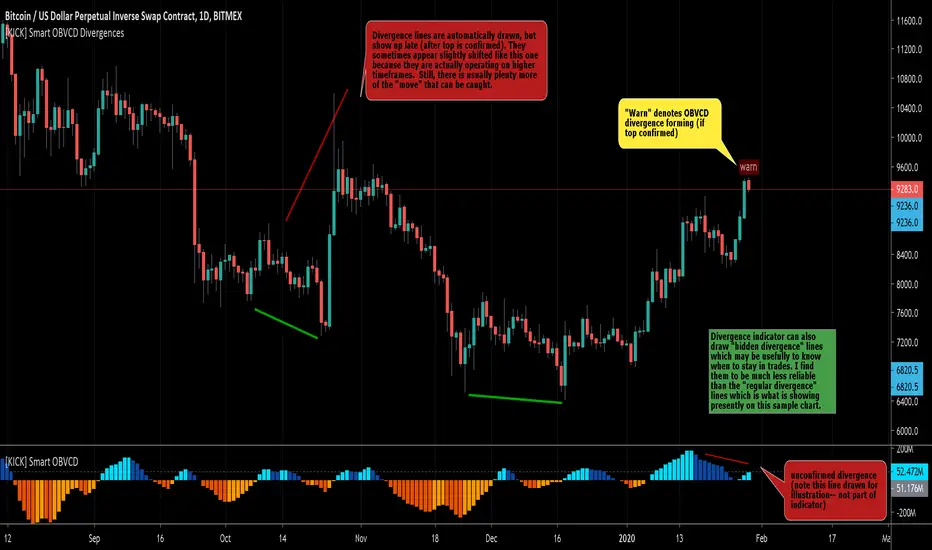
[KICK] Smart OBVCD DivergencesThis indicator is part of a pair of indicators that make it easier to spot divergences in On Balance Volume , but make the calculations using a unique method. THIS ONE IS IN THE UPPER (PRICE ACTION) PANE OF THE SAMPLE CHART.
Volume is segmented into buy or sell volume by analyzing smaller timeframes (down to 1 minute)
The sell vs. buy volume is calculated as a running total (as per normal OBV calculations)
The Convergence/Divergence of the OBV Buy and Sell volumes are calculated and smoothed with 3rd generation averaging methods
The Smart OBVCD indicator (THE RELATED INDICATOR) visualizes the above calculation on a histogram to make it easier to see the values and how they relate to the price action.
The Smart OBVCD Divergence indicator (THIS ONE) plots Regular and Hidden Bullish and Bearish divergence on higher timeframes based on the calculations and also provides early “warnings” for unconfirmed divergences forming (note: these are unconfirmed because the higher high or lower low have now yet been confirmed on the higher timeframe).
Use the link below to watch a tutorial video, request a trial, or purchase for access.

[KICK] Smart OBVCDThis indicator is part of a pair of indicators that make it easier to spot divergences in On Balance Volume, but make the calculations using a unique method. THIS ONE IS IN THE LOWER PANE OF THE SAMPLE CHART.
Volume is segmented into buy or sell volume by analyzing smaller timeframes (down to 1 minute)
The sell vs. buy volume is calculated as a running total (as per normal OBV calculations)
The Convergence/Divergence of the OBV Buy and Sell volumes are calculated and smoothed with 3rd generation averaging methods
The Smart OBVCD indicator (THIS ONE) visualizes the above calculation on a histogram to make it easier to see the values and how they relate to the price action.
The Smart OBVCD Divergence indicator (THE RELATED INDICATOR) plots Regular and Hidden Bullish and Bearish divergence on higher timeframes based on the calculations and also provides early “warnings” for unconfirmed divergences forming (note: these are unconfirmed because the higher high or lower low have now yet been confirmed on the higher timeframe).
Use the link below to watch a tutorial video, request a trial, or purchase for access.
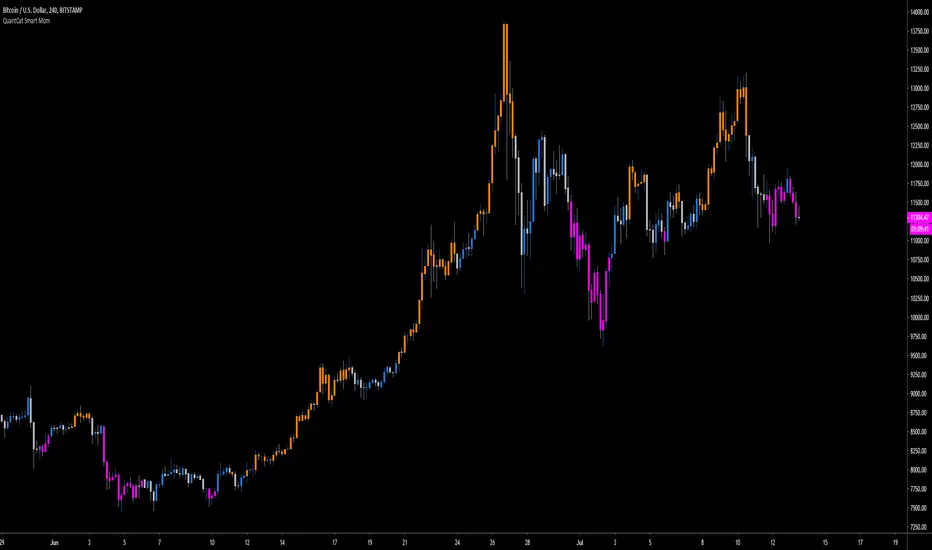
QuantCat Smart MomQuantCat Smart Mom
Our proprietary indicator "Smart Mom" gives signals based on a strong confluence of momentum based indicators.
When the signal prints the candle colour will changed to reflect the sentiment of either bullish or bearish momentum-
Bullish Momentum - Orange
Bearish Momentum - Pink
This can be used in confluence with many other trading methods to create an overall conclusion, such as price action, momentum based strategies or trend analysis.
The indicator is easy to use and useful with the majority of charts in Forex and crypto. It is entirely free, and there will be more free QuantCat releases in the near future to supplement and enhance your trading results.
Be sure to follow us so you're kept up with our projects and any updates to the script!
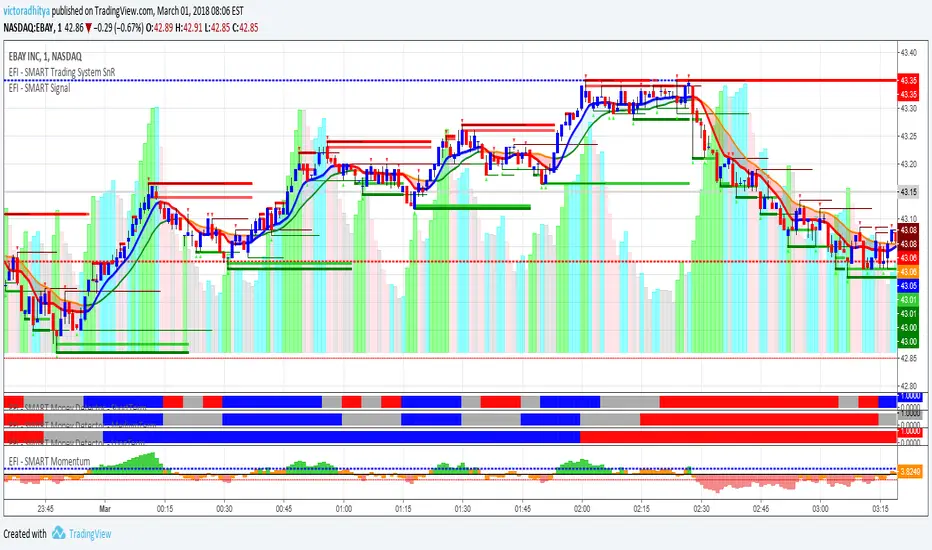
EFI - SMART Buy&Sell Power//EFI - SMART Trading System
//This is an invite and private SMART Trading System for EFI (Edukasi Finansial Internasional) group members.
//Risk Disclosure :
//Futures, Forex, Stock, Crypto and Derivative trading contains substantial risk and is not for every investor.
//An investor could potentially lose all or more than the initial investment.
//We are not responsible for any financial losses you may incur by using this script!

EFI-SMART Trend Daily//EFI - SMART Trading System
//This is an invite and private SMART Trading System for EFI (Edukasi Finansial Internasional) group members.
//Risk Disclosure :
//Futures, Forex, Stock, Crypto and Derivative trading contains substantial risk and is not for every investor.
//An investor could potentially lose all or more than the initial investment.
//We are not responsible for any financial losses you may incur by using this script!

EFI - SMART Money Detector Daily//EFI - SMART Trading System
//This is an invite and private SMART Trading System for EFI (Edukasi Finansial Internasional) group members.
//Risk Disclosure :
//Futures, Forex, Stock, Crypto and Derivative trading contains substantial risk and is not for every investor.
//An investor could potentially lose all or more than the initial investment.
//We are not responsible for any financial losses you may incur by using this script!

EFI - SMART Analysis Advance//EFI - SMART Trading System
//This is an invite and private SMART Trading System for EFI (Edukasi Finansial Internasional) group members.
//Risk Disclosure :
//Futures, Forex, Stock, Crypto and Derivative trading contains substantial risk and is not for every investor.
//An investor could potentially lose all or more than the initial investment.
//We are not responsible for any financial losses you may incur by using this script!

EFI - SMART Momentum//EFI - SMART Trading System
//This is an invite and private SMART Trading System for EFI (Edukasi Finansial Internasional) group members.
//Risk Disclosure :
//Futures, Forex, Stock, Crypto and Derivative trading contains substantial risk and is not for every investor.
//An investor could potentially lose all or more than the initial investment.
//We are not responsible for any financial losses you may incur by using this script!

EFI - SMART Money Detector - LongTerm//EFI - SMART Trading System
//This is an invite and private SMART Trading System for EFI (Edukasi Finansial Internasional) group members.
//Risk Disclosure :
//Futures, Forex, Stock, Crypto and Derivative trading contains substantial risk and is not for every investor.
//An investor could potentially lose all or more than the initial investment.
//We are not responsible for any financial losses you may incur by using this script!

EFI - SMART Money Detector - MediumTerm//EFI - SMART Trading System
//This is an invite and private SMART Trading System for EFI (Edukasi Finansial Internasional) group members.
//Risk Disclosure :
//Futures, Forex, Stock, Crypto and Derivative trading contains substantial risk and is not for every investor.
//An investor could potentially lose all or more than the initial investment.
//We are not responsible for any financial losses you may incur by using this script!

EFI - SMART Money Detector - ShortTerm//EFI - SMART Trading System
//This is an invite and private SMART Trading System for EFI (Edukasi Finansial Internasional) group members.
//Risk Disclosure :
//Futures, Forex, Stock, Crypto and Derivative trading contains substantial risk and is not for every investor.
//An investor could potentially lose all or more than the initial investment.
//We are not responsible for any financial losses you may incur by using this script!

EFI - SMART Signal//EFI - SMART Trading System
//This is an invite and private SMART Trading System for EFI (Edukasi Finansial Internasional) group members.
//Risk Disclosure :
//Futures, Forex, Stock, Crypto and Derivative trading contains substantial risk and is not for every investor.
//An investor could potentially lose all or more than the initial investment.
//We are not responsible for any financial losses you may incur by using this script!

EFI - SMART Trading System//EFI - SMART Trading System
//This is an invite and private SMART Trading System for EFI (Edukasi Finansial Internasional) group members.
//Risk Disclosure :
//Futures, Forex, Stock, Crypto and Derivative trading contains substantial risk and is not for every investor.
//An investor could potentially lose all or more than the initial investment.
//We are not responsible for any financial losses you may incur by using this script!
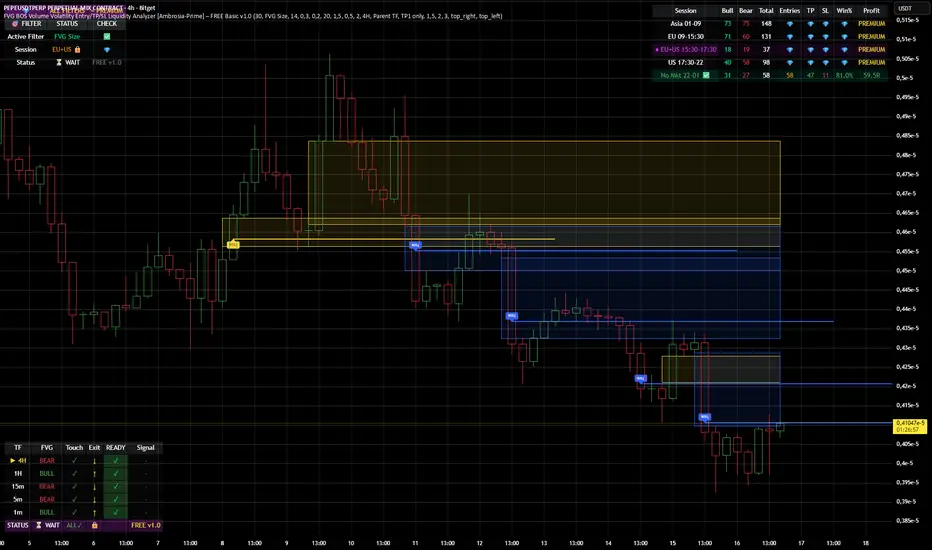
FVG BOS SMC Liquidity Analyzer - Ambrosia-Prime - Basic v1.0# 📘 USER GUIDE
# FVG BOS Volume Volatility Entry/TP/SL Liquidity Analyzer
## 🆓 FREE Basic v1.0 | by Ambrosia-Prime
---
## 📋 TABLE OF CONTENTS
1. (#what-is-this-indicator)
2. (#settings-explained)
3. (#understanding-the-tables)
4. (#your-first-trade)
5. (#free-vs-premium)
6. (#faq)
---
## 🎯 WHAT IS THIS INDICATOR?
The **FVG Analyzer** is a professional trading tool based on **Smart Money Concepts (SMC)** and **ICT strategies**. It automatically detects:
✅ **Fair Value Gaps (FVG)** - Market imbalances
✅ **Break of Structure (BOS)** - Trend confirmations
✅ **Multi-Timeframe Analysis** - 4H, 1H, 15m, 5m, 1m
✅ **Entry, Stop-Loss & Take-Profit** - Automatic level calculation
### The Debug Table shows you everything:
| TF | FVG | Touch | Exit | READY | Signal |
|-----|------|-------|------|-------|--------|
| ► 4H| BULL | ✓ | ↑ | ✓ | LONG |
| 1H | BULL | ✓ | ↑ | ✓ | LONG |
| 15m | BULL | ✓ | ↑ | ✓ | LONG |
When all timeframes show **READY** → **ENTRY SIGNAL!**
---
## ⚙️ SETTINGS EXPLAINED
### 👁 DISPLAY SETTINGS
| Setting | Description |
|---------|-------------|
| Show Bullish FVG | Display yellow FVG boxes |
| Show Bearish FVG | Display blue FVG boxes |
| Show BOS lines | Break of Structure lines |
| Show Session Stats | Statistics table (top right) |
| Show Debug Table | Cascade status (bottom left) |
| Show Entry/SL/TP | Entry lines on signals |
### 🎯 BASIC FILTER (Choose ONE)
In the **FREE Version** you can only activate **1 filter** at a time:
| Filter | What it does |
|--------|--------------|
| **None** | No filter active |
| **FVG Size** | Only FVGs larger than X × ATR |
| **Volume** | Only on above-average volume |
| **Volatility** | Only on normal volatility (not too wild) |
| **BOS only with FVG** | BOS only when open FVG exists |
| **Fill Delete** | FVG disappears when completely filled |
> 💎 **PREMIUM:** Use all 15+ filters simultaneously!
### 🔄 TOUCH + EXIT CASCADE
| Setting | Options | Recommendation |
|---------|---------|----------------|
| Cascade Parent TF | 4H, 1H, 15m | **4H** for Swing |
| Confirm EXIT by WICK | ON/OFF | **ON** for more signals |
| Entry Trigger Level | Lowest/Middle/Parent | **Parent TF** |
| Require ALL TFs | ON/OFF | **ON** for quality |
### 📊 TP SETTINGS
| Setting | Description |
|---------|-------------|
| TP Mode | TP1 only / TP1+TP2 / TP1+TP2+TP3 |
| TP1 Risk:Reward | e.g. 1.5 = 1.5× your risk |
| TP2 Multiplier | e.g. 2.0 = 2× TP1 |
| TP3 Multiplier | e.g. 3.0 = 3× TP1 |
---
## 📈 UNDERSTANDING THE TABLES
### 📍 Filter Status (Top Left)
```
┌─────────────────────────────────────┐
│ 💎 │ ALL FILTERS │ = PREMIUM │
├─────────────────────────────────────┤
│ Active Filter │ FVG Size │ ✅ │
│ Session │ EU 🔒 │ 💎 │
│ Status │ ⏳ WAIT │FREE v1.0│
└─────────────────────────────────────┘
```
- **Active Filter:** Your selected filter
- **Session:** Current trading session
- 🔒 = Locked (PREMIUM only)
- ✅ = Unlocked (No Market 22-01 CET)
- **Status:** WAIT / 🟢 LONG / 🔴 SHORT
### 📊 Session Stats (Top Right)
```
┌──────────────────────────────────────────────────────────┐
│ Session │Bull│Bear│Total│Entries│TP│SL│Win%│Profit│
├──────────────────────────────────────────────────────────┤
│ Asia 01-09 │173 │161 │ 334 │ 💎 │💎│💎│ 💎 │PREMIUM│
│ EU 09-15:30 │131 │146 │ 277 │ 💎 │💎│💎│ 💎 │PREMIUM│
│ EU+US 15:30-17:30│ 37 │ 42 │ 79 │ 💎 │💎│💎│ 💎 │PREMIUM│
│ US 17:30-22 │ 95 │106 │ 201 │ 💎 │💎│💎│ 💎 │PREMIUM│
│ No Mkt 22-01 ✅ │ 42 │ 52 │ 94 │ 14 │14│ 0│100%│ 9.8R │
└──────────────────────────────────────────────────────────┘
```
**In FREE you see:**
- ✅ Bull/Bear/Total FVGs for **ALL** sessions
- ✅ Complete stats only for **No Market (22-01 CET)**
- 💎 Other sessions = **PREMIUM**
### 🔍 Debug Table (Bottom Left)
Shows the **live status** of the cascade:
| Symbol | Meaning |
|--------|---------|
| ► | Parent timeframe (selected) |
| BULL/BEAR | FVG direction |
| ✓ (Touch) | Price touched the zone |
| ↑/↓ (Exit) | Price exited the zone |
| ✓ (READY) | Timeframe is ready |
| LONG/SHORT | Signal direction |
---
## 🚀 YOUR FIRST TRADE
### Preface - Why this Indicator is Different
This indicator can filter so **aggressively** that you receive few or almost no signals. **That was exactly my goal!**
I don't need 500 entries per day staring at a chart all day long.
**I only need 1-3 signals per day - and they should work.**
That was the goal. Quality over quantity.
---
### Step-by-Step Guide:
**1. Create a Watchlist**
- Create a watchlist in TradingView
- Add as many charts as your account allows
- Add the indicator to all charts
**2. Set up Alerts**
- Go to the **4H chart**
- Set up the alert:
- **FREE:** Only "No Market" session (22-01 CET)
- **PREMIUM:** All sessions available
- Select "Any Entry Signal"
**3. React to Alert Signal**
- When an alert comes → Switch to the chart
- Check the **Session Stats Table** (top right)
- There you see: Entry, TP, SL, Win%, Profit
**4. Optimize Entry**
- Open the **Settings** (gear icon)
- Adjust the **TP** until you win all trades
- *(Sometimes profit is higher when you lose one trade but have a higher TP)*
- When you've found the best profit result:
- **Take the set TP minus 10-20%**
- *(We don't want to be greedy, but we want to win!)*
**5. Manage Trade**
- The **SL price** is already provided
- The **TP price** adjusts to your settings
- Set your trade accordingly
**6. Done!**
- Start the trade
- Wait for the next signal on another chart
- Repeat!
---
### ⚠️ Important Note
> Remember: A trade can always hit SL!
> Only trade with money you can afford to lose.
>
> I wish you great success and let me know how successful you were.
> **I will read every comment and answer to the best of my ability.**
---
## 💎 FREE vs PREMIUM
### *Coming soon - Currently in Release Testing*
### What you get with FREE:
| Feature | FREE 🆓 |
|---------|---------|
| FVG Detection (all TFs) | ✅ |
| BOS Detection | ✅ |
| Cascade Logic | ✅ |
| Debug Table | ✅ |
| Session Stats Table | ✅ |
| Entry/SL/TP Lines | ✅ |
| Filters | **1 at a time** |
| Trading Sessions | **Only No Market (22-01)** |
| Alerts | **Only No Market** |
### What you get with PREMIUM:
| Feature | PREMIUM 💎 |
|---------|------------|
| Everything from FREE | ✅ |
| **15+ filters simultaneously** | ✅ |
| **All sessions unlocked** | ✅ |
| → Asia (01-09) | ✅ |
| → EU (09-15:30) | ✅ |
| → EU+US Overlap (15:30-17:30) | ✅ |
| → US (17:30-22) | ✅ |
| **Alerts for all sessions** | ✅ |
| **Session-based TP optimization** | ✅ |
| **HTF Zone Confluence Filter** | ✅ |
| **Structure Filter (HH/HL/LH/LL)** | ✅ |
| **RR Filter** | ✅ |
| **Trend EMA Filter** | ✅ |
| **Candle Quality Filter** | ✅ |
| **Cooldown Filter** | ✅ |
| **FVG Age Filter** | ✅ |
### 🚀 PREMIUM EDITION (Exclusive!)
The Premium version has **two different entry logics** - that's why the testing phase is still ongoing.
Finds setups with **10-100% potential!**
---
## ❓ FAQ
### "Why don't I see any entries?"
**Possible reasons:**
1. **Wrong session:** FREE only works 22:00 - 01:00 CET
2. **Cascade not READY:** All TFs must show ✓
3. **Filter blocking:** Check your active filter
4. **Already in trade:** "Single Trade" allows only 1 trade
### "What do the colors mean?"
| Color | Meaning |
|-------|---------|
| 🟡 Yellow | Bullish FVG / Entry line |
| 🔵 Blue | Bearish FVG |
| 🟢 Green | TP line / Positive |
| 🔴 Red | SL line / Negative |
| 🟣 Purple | EU+US Overlap Session |
### "Which timeframe should I use?"
| Your Style | Chart TF | Cascade Parent |
|------------|----------|----------------|
| Scalping | 1m - 5m | 15m |
| Daytrading | 5m - 15m | 1H |
| Swing | 15m - 1H | 4H |
### "Can I change the sessions?"
- **FREE:** No, only No Market (22-01) is available.
- **PREMIUM:** Yes, all sessions + session-based TP values!
---
## 📞 WANT MORE?
### Unlock PREMIUM:
- ✅ All Sessions
- ✅ All Filters
- ✅ 2 Entry Logics
- ✅ Priority Support
### Contact & Support:
📊 **TradingView:** (www.tradingview.com)
---
## 📜 CHANGELOG
### v1.0 FREE (December 2024)
- Initial Release
- Multi-TF FVG Detection
- BOS Detection
- Cascade Logic
- 1 Filter (Dropdown)
- No Market Session (22-01)
- Session Statistics
- Debug Table
---
## ⚠️ DISCLAIMER
This indicator is an **analysis tool** and not financial advice.
Trading involves risks. Past results do not guarantee future profits.
Only trade with capital you can afford to lose.
---
**Good luck with your trading! 🚀**
*Your Ambrosia-Prime*
---
*© 2024 Ambrosia-Prime. All rights reserved.*
BALANCED Strategy: Intraday Pro + Smart DashboardWelcome to the BALANCED Strategy: Intraday Pro.
This all-in-one indicator is designed for Intraday traders looking to capture trend movements while effectively filtering out sideways market noise. It combines the power of Supertrend for direction, EMA 100 for the baseline trend, and rigorous validation via RSI and ADX.
The script also integrates a complete Risk Management system with targets based on the Golden Ratio (Fibonacci) and a real-time Dashboard.
⏳ Recommended Timeframes
This algorithm is optimized for Intraday volatility:
M5 (5 Minutes) ⭐️: Ideal for quick Scalping. The ADX filter is crucial here to avoid false signals.
M15 (15 Minutes) 🏆: The "Sweet Spot." It offers the best balance between signal frequency and trend reliability.
M30 / H1: For a "Swing Intraday" approach—calmer, fewer signals, but higher precision.
Not recommended for M1 (1 Minute) with default settings (too much noise).
🚀 How It Works
The algorithm follows a strict 3-step logic to generate high-quality signals:
1. Trend Identification (The Engine)
Supertrend: Determines the immediate direction.
EMA 100: Acts as a background trend filter. We only buy above and sell below the EMA.
2. Noise Filtering (Safety)
ADX (Average Directional Index): The signal is only validated if there is sufficient volatility (Configurable threshold, default 12) to avoid "chop markets" (flat markets).
RSI (Relative Strength Index): Strict momentum filter. Buy only if RSI > 50, Sell if RSI < 50.
3. Entry Confirmation (The Trigger)
The script doesn't just rely on a crossover. It waits for "Price Action" confirmation: the candle must close higher than the previous one (for Long) or lower (for Short) to validate the entry.
🛡️ Risk Management (Money Management)
This is the core strength of this tool. Upon signal validation, the script automatically calculates and plots:
Stop Loss (SL): Based on volatility (ATR). It places the stop at the recent Low/High with a safety padding.
Take Profit (TP): Two modes available:
Fibonacci Mode (Default): Targets the 1.618 extension (Golden Ratio) of the risk taken.
Fixed Ratio Mode: Targets a manual Risk/Reward ratio (e.g., 2.0).
📊 The Dashboard
Located at the bottom right, the smart dashboard provides vital info at a glance:
Signal Time: To check if the alert is fresh.
Type (LONG/SHORT): Color-coded (Green/Pink).
Tech Data: RSI and ADX values at the moment of the signal.
Exact Prices: Entry Level, Target (TP), and Stop Loss (SL).
⚙️ Configurable Settings
Sensitivity: Adjust the Supertrend factor (Default 2.0).
Filters: Toggle the RSI filter ON/OFF or adjust the ADX threshold.
Execution: Choose between Fibonacci Target (1.618) or a Manual Ratio.
⚠️ Disclaimer: This tool is a technical decision aid and does not constitute financial investment advice. Always use prudent risk management and backtest the indicator on your preferred assets before live use.

TRADING.COM.VN Pro V43 (Pivot & Smart Target D)TRADING.COM.VN – Professional Trend Following System
TRADING.COM.VN is an advanced trend-following toolkit designed to capture major market moves with institutional-grade precision, optimized for both Swing and Position trading.
KEY FEATURES:
Trend Lock Technology: Utilizes HLC3 & Pivot Breakout logic to "lock" the trend color, eliminating noise and fake signals during consolidation.
Smart Target Engine: Automatically scans multi-timeframe data to determine the best Take Profit level:
Safe Mode: Targets strong Daily Resistance levels.
ATH Mode: Switches to Fibonacci Extension when price breaks All-Time Highs to maximize profits.
Pro Risk Management: Features an automatic Swing Low Stoploss (5-candle lookback) and an integrated Trailing Stop to secure gains as price rallies.
Macro Trend Filter: Built-in EMA 200 warning system to prevent trading against the long-term trend.
Clean Chart Mode: Option to display only the Last Active Signal, keeping your chart clutter-free for focused execution.
Engulfing Failed Zone Detector by RWBTradeLabEngulfing Failed Zone Detector by RWBTradeLab
A clean, non-repainting tool that focuses on one thing only: showing where strong engulfing patterns failed and the market broke through their base.
What this indicator does
This script automatically scans for confirmed engulfing patterns (Regular & E-Regular) and then tracks where those structures are invalidated.
It highlights two types of failure zones:
1. Buy Engulfing Failed
* A bullish engulfing pattern forms (Regular or E-Regular).
* Later, a bearish candle closes below the base low of that engulfing.
* The zone from the base candle to the failure candle is marked as Buy EG Failed .
2. Sell Engulfing Failed
* A bearish engulfing pattern forms (Regular or E-Regular).
* Later, a bullish candle closes above the base high of that engulfing.
* The zone from the base candle to the failure candle is marked as Sell EG Failed .
Only the first clear failure after each engulfing is drawn, keeping the chart clean and readable.
Visuals on chart
1. A rectangle (box) is drawn from the engulfing base candle to the failure candle.
2. Labels are placed automatically:
* Buy EG Failed (below the zone)
* Sell EG Failed (above the zone)
3. Label distance from the zone is controlled by Text Offset from Box (%).
4. Separate color controls for:
* Buy Engulfing Failed Box Color
* Sell Engulfing Failed Box Color
The label style matches Engulfing Detector by RWBTradeLab for a consistent visual experience.
Alerts
Built-in alerts trigger only on confirmed bar close when a new failure completes:
* Buy EG Failed
* Sell EG Failed
Each alert message includes:
* Brand prefix: RWBTradeLab
* Price
* Time
* Ticker
Perfect for linking with bots, webhooks or alert-based trade management.
Key settings
Candle Length (closed candles)
* Defines how many recent confirmed candles are scanned (the live bar is excluded).
Display toggles
* Buy Engulfing Failed
* Sell Engulfing Failed
* Text
Turn each element ON/OFF to control how much information you want on the chart.
Text Offset from Box (%)
* Controls how far the label is placed from the failed zone, with a safe minimum to keep labels clear and readable.
Non-repainting confirmation
* All detection and alerts are based on closed candles only.
* No signals from the running candle, no repaint tricks.
* Once a failure zone appears, it stays fixed.
Best use
Failed engulfing zones can reveal:
* Broken demand/supply zones
* Liquidity grabs where “smart money” flushed traders out
* Strong momentum shifts after a failed reversal attempt
* Levels where continuation or clean retests often occur
Works on any symbol and timeframe. For best results, combine with:
* Higher timeframe structure
* Key support/resistance or supply/demand mapping
* Your own confirmation tools and risk management
Disclaimer
This indicator is a technical pattern-detection tool, not financial advice. Trading involves risk. Always confirm signals with your own analysis and use proper risk management.
Creator: RWBTradeLab
If this script adds value to your trading, please leave a ⭐ and share your feedback.

Paneksu Smart Liquidity & SessionsOVERVIEW:
This indicator is designed for ICT/SMC traders. It visualizes key trading
sessions (Asia, London, New York) and automatically marks significant
High/Low liquidity pools.
KEY FEATURES:
1. Smart Liquidity: Liquidity lines extend into the future and automatically
stop drawing (cut off) once the price sweeps the level. This ensures
only untested liquidity is shown.
2. Precision Anchoring: Lines originate exactly from the pivot High/Low
timestamp for maximum accuracy on higher timeframes.
3. Main Session Focus: Allows you to hide the background box of your
active trading session for the current day to keep the chart clean,
while still showing historical data.
4. Auto-Timeframe: Visuals are automatically disabled on timeframes
higher than 5 minutes to prevent clutter.
SETTINGS:
- Main Trading Session: Select the session you trade to hide its current box.
- Show History: Toggle to keep old swept lines or show only fresh ones.

NC-ALPHA INDEX [Pro Pane] - Smart Money Flow01. THE PROBLEM: MARKET CAP IS A LAGGING INDICATOR
Standard crypto indices (like Coin50 or Total Market Cap) are weighted by capitalization. This is a flawed model for active traders because it prioritizes "Dino Coins"—older assets with massive supplies but very little active volume or price discovery. They are heavy, slow, and hide the real story.
02. THE SOLUTION: VOLUME-VELOCITY WEIGHTING
The NC-ALPHA INDEX is designed for SMC (Smart Money Concepts) traders who need to see where the real liquidity is flowing right now.
Instead of static weighting, this script dynamically adjusts the influence of each asset based on its Real-Time Dollar Volume.
High Volume = High Impact: If a specific asset (e.g., SOL, HYPE, or PEPE) is attracting massive liquidity inflow, its weight in the index increases instantly.
Low Volume = Low Impact: Assets with no volume ("Zombie coins") have minimal impact on the index line, preventing false signals.
03. THE "MARKET DRIVERS" BASKET
The index tracks a curated basket of 10 high-velocity assets representing the current market meta:
1 - Kings: BTC, ETH
2 - Market Leaders: SOL, BNB
3 - High Beta / L1s: SUI
Sector Proxies: DOGE (Memes), HYPE (DEX/Perps), AAVE (DeFi), LINK (Infra), XRP.
04. HOW TO TRADE WITH IT
A. The Divergence (Trap Detector) If Bitcoin is making a Higher High (HH) at a Key Resistance, but the NC-ALPHA Index is making a Lower High (LH) or stagnating:
Signal: The pump is unsupported by broad liquidity. It is likely a "Fake Pump" driven by wash trading or isolated manipulation. High probability of an SFP (Swing Failure Pattern).
B. The HUD (Heads-Up Display) The dashboard on the chart shows you exactly what is moving the market.
Look at the "W%" (Weight) column.
Signal: If an Altcoin (like SUI or HYPE) suddenly exceeds 15-20% weight, a Sector Rotation is occurring. Stop watching BTC and focus on that asset.
05. TECHNICAL NOTES
Crash Proof: Built with advanced nz() data handling to prevent the "disappearing line" bug common in composite indices.
Usage Rule: For accurate calculation, use this indicator on 24/7 Crypto Charts (BTC, ETH, SOL) rather than Traditional Finance charts (VIX, SPX) to avoid weekend data gaps.
Built by KheopsCrypto for the SMC Community.

Triple Screen Scalper [Pro] + Dynamic Risk Engine + Smart DCA🚀 Strategy Concept
This algorithm utilizes a Triple Screen methodology to filter market noise and align trades with the path of least resistance. Instead of relying on a single timeframe, it analyzes market structure across three distinct "horizons" to ensure high-probability execution:
The Tide (Long-Term): Analyzes the dominant directional flow and market bias on higher timeframes.
The Wave (Medium-Term): Measures the strength of the current momentum and pauses trading during weak or "choppy" market phases.
The Ripple (Short-Term): Pinpoints precise entry zones by detecting over-extended price action and mean-reversion opportunities within the larger trend.
The system is fortified with a Smart DCA (Dollar Cost Averaging) Engine that adapts to volatility. It does not blindly add to positions; it calculates "Risk Room" and "Trend Stability" before every additional entry, ensuring capital is deployed efficiently rather than recklessly.
⚙️ Configuration Guide (Variable Explanations)
💰 Position & Leverage
Trade Direction: Choose between Long, Short, or Auto. In "Auto," the system trades both directions based on the dominant trend.
Target Entry Leverage (x): The desired leverage for your initial entry.
Base Order Size (% of Equity): How much of your account balance is allocated to the very first trade of a sequence.
DCA Size Multiplier: Controls how much larger each subsequent order is compared to the previous one. A value of 1.0 means flat sizing; values above 1.0 increase the size of recovery orders.
KILL SWITCH: Max Effective Lev: A safety ceiling. If your total position's effective leverage exceeds this value, the strategy will force-close the position to prevent liquidation.
🚀 Profit Settings (Dynamic Exits)
Use Dynamic Profit?: If enabled, the take-profit target acts like a breathing lung—expanding during high volatility (to catch bigger moves) and contracting during quiet periods.
Gain Volatility Length: The lookback period used to measure recent market volatility.
Gain Multiplier: Scales the profit target. Higher numbers require a larger price move to hit profit; lower numbers take profit sooner.
Minimum Profit Floor %: A hard limit ensuring the target never drops below this percentage, even in extremely low-volatility markets.
📉 Trend & Momentum Filters
Trend Strength Threshold: Defines the minimum "velocity" required to trade. This filters out flat, ranging markets where trends are not established.
Momentum Sensitivity (K/D/Smooth): These variables tune the sensitivity of the entry trigger.
Lower numbers = Faster entries (more trades, potentially more noise).
Higher numbers = Slower, more confirmed entries.
Overbought / Oversold Levels: The specific zones (0-100) where price is considered statistically over-extended, triggering a reversal signal.
🛡️ Risk & DCA Settings
Enable Hard Stop Loss: A traditional safety stop based on a fixed percentage.
Max DCA Orders: The maximum number of times the strategy is allowed to "average down" on a position.
Require Trend for DCA?: If TRUE, the strategy will only add to a losing position if the broader market trend is still valid. If the trend breaks, it stops buying.
DCA Volatility Length/Multiplier: Controls the spacing between buy orders.
High Multiplier = Orders are spread far apart (safer for crashes).
Low Multiplier = Orders are closer together (faster recovery in normal dips).
Risk Scaling: A unique feature that pushes DCA orders further away as your leverage increases, protecting you from adding too much risk too quickly.
Base DCA %: The minimum distance required between orders, regardless of volatility.
⏱️ Timers & Cooldowns
Fast / Slow Cooldown: The minimum time (in seconds) the strategy must wait between realizing a profit and opening a new trade. This prevents "revenge trading" or entering twice on the same candle.
Position Cooldown: A specific timer applied after a large position is closed to let the market settle.
🎯 Daily S/R Targets
Enable Daily S/R: If enabled, the strategy will attempt to "snipe" exits at calculated daily support and resistance pivots.
Proximity Threshold: How close the price must get to a daily level to trigger an early exit.
⚠️ Risk Disclaimer
This script is an automated tool for analysis and execution assistance. It employs averaging techniques (DCA) which involve calculated risk. While the "Kill Switch" and "Risk Scaling" features are designed to mitigate exposure, users should thoroughly backtest and understand the "Multiplier" settings before deploying real capital. Past market structure is not a guarantee of future performance.

VB Sigma Smart Momentum IndicatorVB Sigma Smart Momentum Indicator (VBSSMI)
The VBSSMI provides a consolidated decision-support framework that surfaces market participation, trend integrity, and liquidity conditions in a single visual environment. The tool integrates four analytical modules: MCDX Flow Mapping, Donchian Regime Layers, Banker Flow Modeling, and Chop Zone Trend Classification. Together, these components convert raw price movement into an actionable interpretation of who is in control, whether momentum is durable, and what phase the instrument is currently cycling through.
How to Use the Indicator (Practical Workflow)
1. Start with Institutional / Banker Flow (Pink/Red/Yellow/Green Candles)
This is the primary signal layer. It tells you when high-capacity participants are increasing, reducing, or reversing risk.
Yellow Candle — Entry Bias
Indicates a potential institutional initiation when their trend metric crosses above their accumulation threshold.
Operational signal: instrument enters “monitor for entry” state.
Green Candle — Accumulation State
Fund-trend > bullbearline.
Operational signal: trend integrity improving; pullbacks are generally buyable.
White Candle — Distribution / Cooling
Fund-trend weakening but not broken.
Operational signal: tighten stops; momentum deteriorating.
Red Candle — Exit / Trend Failure
Fund-trend < bullbearline.
Operational signal: momentum regime invalidated; avoid long risk.
Blue Candle — Weak Rebound
A temporary uptick within broader weakness.
Operational signal: do not mistake this for a durable reversal.
2. Validate alignment with Flow Chips (Retail / Trader / Institutional)
These three flow columns (MCDX layers) answer: who is actually participating?
Retailer Flow (Locked Chips – Green)
High values imply retail conviction, often late-cycle.
Good for confirming trend strength, not timing entries.
Trader Zone Flow (Float Chips – Yellow)
When this spikes, volatility and tactical positioning increase.
Signal: strong short-term engagement, supports breakout/trend continuation.
Institutional Flow (Profitable Chips – Red/Pink)
This is the “true north” of momentum.
Rising values = institutions controlling price discovery.
Signal: long setups have statistical tailwind.
The operational guidance is straightforward:
Institutional Flow > Trader Flow > Retail Flow
is the healthiest configuration for sustainable upside momentum.
3. Confirm Breakout / Breakdown Conditions with Donchian Regime Columns
The vertical Donchian stack illustrates trend regime in a time-compressed format.
Bright Blue/Cyan
Structure expanding upward (breakout cluster).
Dark Purple/Red
Structure breaking downward (breakdown cluster).
Mixed Columns
Transitional or indecisive conditions.
Interpret it as a “momentum backdrop”:
If Donchian columns and Banker Flow candles disagree, avoid entries.
4. Consult the Chop Zone Strip Before Committing Capital
The Chop Zone uses EMA angle to determine whether the market is trending or congested.
Greens/Blues → Trend phase (favorable environment for continuation trades).
Yellows/Oranges/Reds → High noise probability; expect false signals.
Operationally:
Never enter breakout setups during yellow/orange/red chop.
5. Final Decision Framework (Checklist)
A long setup typically requires:
Green or Yellow Banker Flow Candle
Institutional Flow rising
Donchian columns in bullish regime colors
Chop Zone in a trend color (not red/yellow/orange)
A short setup is the exact inverse.
Recommended Use Cases
Momentum trading
Swing position building
Institutional-flow confirmation
Trend-filtering before deploying breakout systems
Screening for strong/weak symbols in multi-asset rotation strategies
