Smart Money Concepts by Rakesh Sharma🎯 SMART MONEY CONCEPTS - TRADE WITH INSTITUTIONS
Reveal where banks, hedge funds, and institutional traders enter the market. Trade alongside smart money, not against them!
✨ FEATURES:
- Order Blocks (OB) - Institutional buying/selling zones
- Fair Value Gaps (FVG) - Market inefficiencies to exploit
- Break of Structure (BOS) - Trend continuation signals
- Change of Character (ChoCh) - Early reversal detection
- Liquidity Sweeps - Stop hunt identification
- Premium/Discount Zones - Buy cheap, sell expensive
- Live Dashboard - Real-time market structure
🎯 HOW TO USE:
✓ BUY in Discount Zone at Bullish Order Blocks
✓ SELL in Premium Zone at Bearish Order Blocks
✓ Wait for ChoCh or BOS confirmation
✓ Follow institutional footprints for high-probability setups
📊 PERFECT FOR:
All markets - Nifty, Bank Nifty, Stocks, Forex, Crypto
All timeframes - 5m (scalping), 15m (intraday), Daily (swing)
⚡ TRADING EDGE:
Stop trading like retail. Start trading like institutions. See where smart money accumulates and distributes. Catch reversals early with ChoCh signals.
Created by: Rakesh Sharma | Version 1.0
Pesquisar nos scripts por "smart"

Smart MACD Crossover█ OVERVIEW
Smart MACD Crossover is an indicator designed for traders who trade based on MACD line crossovers. It significantly reduces the number of false crossover signals by adding a breakout-box confirmation mechanism. Price must close outside the box created at the moment of the MACD crossover for a signal to trigger. The script also includes optional scaled MACD lines on the price chart, candle coloring, multi-layer “fog” visualization, fully customizable entry signals, automatic Take Profit / Stop Loss levels and a real-time table.
█ CONCEPTS
Standard MACD crossovers frequently produce noise, especially in ranging markets. Smart MACD Crossover attempts to solve this issue: a horizontal box is drawn at the exact bar where the crossover occurs, and a trade signal is generated only when price actually breaks out of that box. By default, the show_only_matching filter is enabled — signals are shown only when the breakout direction matches the original MACD crossover direction (bullish box → long only, bearish box → short only).
█ FEATURES
Fully configurable classic MACD (default 12/26/9)
Optional MACD & Signal lines scaled and plotted directly on the price chart (show_macd_overlay)
Trend-based candle coloring
One-Side Histogram Fog:
- 6 layers above and 6 layers below hl2
- layer height based on average candle size × offset_mult (default 0.7)
- increasing transparency (base 80 + increment 4) for depth effect
- fully customizable colors
Breakout Boxes:
- created on every MACD crossover
- default height = high-low of the signal candle
- optional extension using average candle size × box_multiplier
- semi-transparent fill (85) with colored borders, extended right until breakout
Signals:
- Triangles or “BUY” / “SELL” labels
- show_only_matching filter (enabled by default) — only direction-consistent breakouts generate signals
- when disabled, every box breakout generates a signal according to breakout direction
- Built-in alerts: BUY and SELL
Take Profit / Stop Loss:
- TP1, TP2, TP3 and SL levels drawn automatically after each confirmed signal
- two modes: Candle Multiplier (based on average candle size) or Percentage
- all multipliers/percentages fully adjustable in “Risk Management Settings”
- real-time table in the top-right corner showing current TP/SL prices
█ HOW TO USE
Add via Pine Editor → paste code → Add to Chart.
Settings overview:
- MACD Settings: lengths and source
- Risk Management Settings: TP/SL mode, multipliers/percentages, average candle period
- MACD Overlay Lines: toggle scaled MACD lines on price chart
- Fog: enable/disable, adjust height and transparency
- Visual Settings: candle coloring
- Boxes: optional size multiplier (use_box_multiplier)
- Signals: choose Triangles or Labels, enable/disable direction filter
Signal meaning:
- Triangle below bar / “BUY” label → upward breakout from a box created after bullish MACD crossover
- Triangle above bar / “SELL” label → downward breakout from a box created after bearish MACD crossover
- Open boxes = pending breakout zones
- Fog below price = bullish pressure, fog above price = bearish pressure
█ APPLICATIONS
The indicator reduces false signals coming from plain MACD crossovers. For additional trend confirmation, the scaled MACD lines can be enabled.
Entry into a position is triggered by the BUY/SELL signal generated after the breakout. The TP1–TP3 and SL levels are drawn automatically only for convenience and as a quick reference – they are fully optional and traders can (and usually should) use their own preferred exit strategies, trailing stops, partial closes, or other money-management methods.
█ NOTES
- Due to MACD line scaling onto the price chart, classic MACD divergences cannot be identified

"Smart Dashboard" for Institutional Price Targets.This script is designed to create a "Smart Dashboard" for Institutional Price Targets.
Think of it as a tool that asks, "What does Wall Street think this stock is worth?" and then draws specific "Buy Zones" on your chart based on those professional valuations.
Here is a breakdown of how it works in plain English for an investor:
1. The Core Concept: Wall Street Consensus
The indicator doesn't use standard technical analysis (like RSI or Moving Averages). Instead, it looks at Fundamental Data. It pulls the average Price Target set by institutional analysts (banks, hedge funds, research firms).
Example: If Goldman Sachs, Morgan Stanley, and JP Morgan all agree that NVDA is worth $150, this tool grabs that $150 number.
2. The "Data Engine" (The Smart Part)
The code includes a sophisticated "search engine" (Section 2 & 3 of the code) to ensure it finds the most accurate price target.
The Problem: Sometimes data feeds are empty, or they are in the wrong currency (e.g., a Canadian stock showing a price target in USD, which makes the chart look broken).
The Solution: This script follows a "Waterfall" priority list to find data:
Priority 1: It checks NASDAQ data first (often the most accurate for tech stocks like Apple or Tesla).
Priority 2: If the local currency data is missing, it forces a search for USD data (this is the "USD Fix" in the title).
Priority 3: It checks NYSE data.
Backup: If all else fails, it uses the generic TradingView average.
In short: It works very hard to make sure it doesn't give you a blank screen or a currency error.
3. The "Institutional Buy Zones" (The Strategy)
Once the tool finds the "Fair Value" (the Analyst Target), it calculates deep discount levels where an institutional investor might want to buy the dip.
It draws four colored lines below the current price:
Target (Dashed Line): This is the Fair Value. (The goal).
Level 1 (Green Line - 90%): This is 10% below fair value. A standard "buy the dip" zone.
Level 2 (Blue Line - 70%): This is 30% below fair value. This is considered a "Value Buy" or a "Deep Discount."
Level 3 (Orange Line - ~66.5%): A specific Fibonacci-style extension of the deep discount.
Level 4 (Red Line - 63%): The "Crash" buy zone. If price hits this, the stock is trading massively below what analysts think it is worth.
4. The Dashboard
On the screen (top right by default), there is a clean table that summarizes everything:
Target: Tells you the exact price analysts are aiming for.
Dist %: Tells you how far away the current price is from that target (e.g., "+20%" means the stock needs to rise 20% to hit the target).
Source: Tells you where it found the data (e.g., "Nasdaq FQ"), so you know if the data is trustworthy.
How an Investor Uses This:
Validation: You want to buy a stock, but you check this tool. If the price is above the dashed Target line, the tool is telling you the stock is effectively "overpriced" compared to Wall Street's expectations.
Entry Points: You are waiting to enter a position. You set limit orders at the Green (90%) or Blue (70%) lines, knowing these are math-based discount levels relative to the company's fundamental valuation.
Summary: It automates the research process of looking up analyst price targets and draws "Sale Price" lines on your chart automatically.

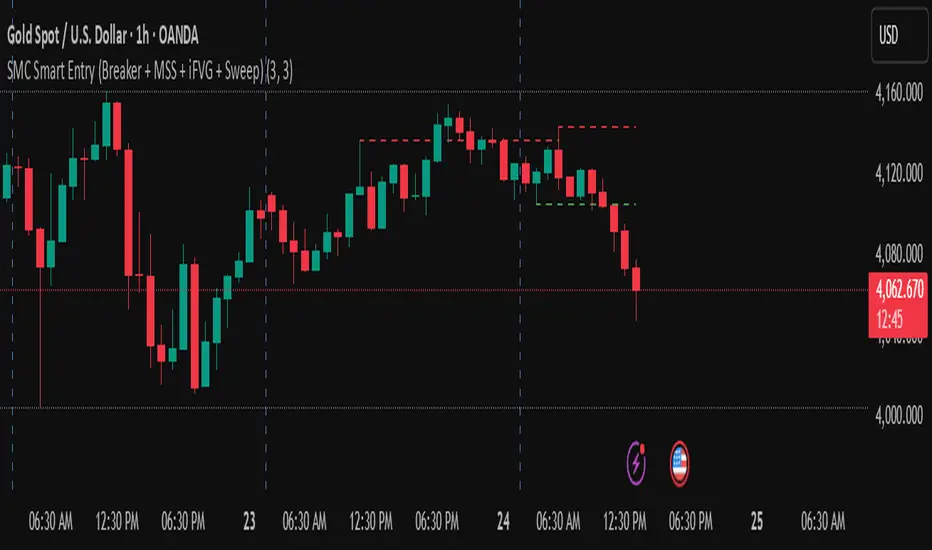
Smart Money Decoded [GOLD]Title: Smart Money Decoded
Description:
Introduction
Smart Money Decoded is a comprehensive, institutional-grade visualization suite designed to simplify the complex world of Smart Money Concepts (SMC). While many indicators flood the chart with noise, this tool focuses on clarity, precision, and high-probability structure.
This script is built for traders who follow the "Inner Circle Trader" (ICT) methodologies but struggle to identify valid Zones, Displacement, and Liquidity Sweeps in real-time.
💎 Key Features & Logic
1. Refined Market Structure (BOS & CHoCH)
Instead of marking every minor pivot, this script uses a filtered Swing High/Low detection system.
HH/LL/LH/HL Labels: Only significant structure points are mapped.
BOS (Break of Structure): Marks trend continuations in the direction of the bias.
CHoCH (Change of Character): Marks potential trend reversals.
2. Advanced Order Blocks (with "Strict Mode")
Not all down-candles before an up-move are Order Blocks. This script separates the weak from the strong.
Standard OBs: Visualized with standard transparency.
⚡ SWEEP OBs (High Probability): Order Blocks that explicitly swept liquidity (Stop Hunt) before the reversal are highlighted with a thicker border, brighter color, and a ⚡ symbol. These are your high-probability "Turtle Soup" entries.
Strict Mode Toggle: In the settings, you can choose to hide all weak OBs and only see the ones that swept liquidity.
3. Dynamic Breaker Blocks
A true ICT Breaker is a failed Order Block that trapped liquidity.
This script automatically detects when a valid OB is mitigated (broken through) and projects it forward as a Breaker Block.
This ensures you are trading off valid flipped zones (Support becomes Resistance, Resistance becomes Support).
4. Fair Value Gaps (FVG)
Automatically detects Imbalances (Imbalance/Inefficiency).
Includes an ATR Filter to ignore tiny, insignificant gaps, keeping your chart clean.
Option to show the Consequent Encroachment (50% CE) level for precision entries.
5. Liquidity Zones (BSL / SSL)
Automatically plots Buy Side Liquidity (BSL) and Sell Side Liquidity (SSL) at key swing points.
Once price sweeps these levels, the zone is removed or marked as "Swept," helping you identify when the draw on liquidity has been met.
6. Institutional Data Panel
A dashboard in the top right corner displays:
Market Bias: Bullish/Bearish/Neutral based on structure.
Premium/Discount: Tells you if price is in the expensive (Premium) or cheap (Discount) part of the current dealing range.
Active Zones: Counts of current open arrays.
⚙️ How To Use This Indicator
Identify Bias: Look at the Structure Labels (HH/LL) and the Panel. Are we making Higher Highs?
Wait for the Trap: Look for a Liquidity Sweep (BSL/SSL taken) or a ⚡ Sweep OB.
Entry Confirmation: Watch for a return to a Fair Value Gap (FVG) or a retest of a Breaker Block (BRK).
Manage Risk: Use the visuals to place stops above/below invalidation points.
Customization:
Go to the settings to toggle "Strict Mode" for Order Blocks, change colors to match your theme, or adjust the lookback periods to fit your specific asset (Forex, Crypto, or Indices).
📚 Credits & Acknowledgments
This script is an educational tool based on the public teachings of Michael J. Huddleston (The Inner Circle Trader - ICT).
Concepts used: Order Blocks, Breakers, FVGs, Market Structure, Liquidity Pools.
Credit is fully given to ICT for originating these concepts and sharing them with the world.
⚠️ Disclaimer
This script is NOT affiliated with, endorsed by, or connected to Michael J. Huddleston (ICT) in any way. It is an independent coding project intended for educational purposes and visual assistance.
Trading involves substantial risk. This indicator does not guarantee profits. Always use proper risk management. Trust your analysis first, and use indicators as confluence.
#Smart Money Concepts, #SMC, #ICT,#Liquidity, #Market Structure, #Trend, #Price Action.

Smart RSI Composite [DotGain]Summary
Do you want to know the "True Direction" of the market without getting distracted by noise on a single timeframe?
The Smart RSI Composite simplifies market analysis by aggregating momentum data from 10 different timeframes (5m to 12M) into a single, easy-to-read Histogram.
Instead of looking at 10 separate charts or dots, this indicator calculates the Average RSI of the entire market structure. It answers one simple question: "Is the market predominantly Bullish or Bearish right now?"
⚙️ Core Components and Logic
This indicator works like a consensus mechanism for momentum:
Data Aggregation: It pulls RSI values from 10 customizable slots (Default: 5m, 15m, 1h, 4h, 1D, 1W, 1M, 3M, 6M, 12M). All slots are enabled by default.
Smart Averaging: It calculates the arithmetic mean of all active timeframes. If the 5m chart is bearish but the Monthly chart is bullish, this indicator balances them out to show you the net result.
Histogram Visualization: The result is plotted as a histogram centered around the 50-line (Neutral).
🚦 How to Read the Histogram
The histogram bars indicate the aggregate strength of the trend based on the Average RSI:
🟩 DARK GREEN (Strong Bullish)
Condition: Average RSI > 60.
Meaning: The market is in a strong uptrend across most timeframes. Momentum is firmly on the buyers' side.
🟢 LIGHT GREEN (Weak Bullish)
Condition: Average RSI between 50 and 60.
Meaning: Slight bullish bias. The bulls are in control, but momentum is not yet extreme.
🔴 LIGHT RED (Weak Bearish)
Condition: Average RSI between 40 and 50.
Meaning: Slight bearish bias. The bears are taking control.
🟥 DARK RED (Strong Bearish)
Condition: Average RSI < 40.
Meaning: The market is in a strong downtrend across most timeframes. Momentum is firmly on the sellers' side.
Visual Elements
Center Line (50): This acts as the Zero-Line. Above 50 is bullish, below 50 is bearish.
Zone Lines (30/70): Dashed lines indicate the traditional Overbought/Oversold levels applied to the aggregate average.
Key Benefit
The Smart RSI Composite acts as a powerful Macro Trend Filter .
Pro Tip: Never go long if the Histogram is Dark Red, and avoid shorting when it is Dark Green. Use this tool to align your trades with the overall market momentum.
Have fun :)
Disclaimer
This "Smart RSI Composite" indicator is provided for informational and educational purposes only. It does not, and should not be construed as, financial, investment, or trading advice.
The signals generated by this tool (both "Buy" and "Sell" indications) are the result of a specific set of algorithmic conditions. They are not a direct recommendation to buy or sell any asset. All trading and investing in financial markets involves substantial risk of loss. You can lose all of your invested capital.
Past performance is not indicative of future results. The signals generated may produce false or losing trades. The creator (© DotGain) assumes no liability for any financial losses or damages you may incur as a result of using this indicator.
You are solely responsible for your own trading and investment decisions. Always conduct your own research (DYOR) and consider your personal risk tolerance before making any trades.

Smart OI & Funding + Market RefSmart OI & Funding + Market Ref is a professional-grade tool designed for crypto perpetual traders who need accurate, real-time sentiment data without the hassle of manual configuration. It solves the common "Symbol Not Found" and NaN errors by using an intelligent symbol detection engine.
This indicator plots the Open Interest (OI) and Funding Rates for your current chart while simultaneously monitoring the broader market sentiment by displaying real-time funding rates for BTC and ETH on the dashboard.
Key Features
🧠 Smart Symbol Detection : automatically detects your current exchange (Binance, Bybit, OKX, etc.) and tries multiple ticker formats (e.g., .P, _OI, _FR) to find valid data. No more manual ticker searching.
📊 Dual-Pane Visualization :
Open Interest (Line): Displayed as a smoothed line area to visualize market participation and trend strength.
Funding Rate (Columns): Color-coded columns (Teal/Red) to instantly spot bullish or bearish sentiment extremes.
⚡ Real-Time Dashboard : A clean, non-intrusive table in the top-right corner displays:
Current Stats : Exact OI (formatted in Millions/Billions) and Funding Rate % for the coin you are viewing.
Market Reference : Live Funding Rates for BTCUSDT and ETHUSDT from your specific exchange to use as a baseline for market sentiment.
How to Use
1. Add to Chart: Apply the indicator to any Crypto Perpetual Futures chart (e.g., BTCUSDT.P, SOLUSDT.P).
2. Scale Setup (Important): Since Open Interest (Millions) and Funding Rates (0.01%) have vastly different values, you must separate their scales:Right-click the Blue Line (OI) $\rightarrow$ Select Pin to Scale Right.Right-click the Columns (Funding) $\rightarrow$ Select Pin to Scale Left.
3. Interpret the Data:High OI + Positive Funding: Strong Bullish sentiment (Longs paying Shorts). Watch for Long Squeezes.High OI + Negative Funding: Strong Bearish sentiment (Shorts paying Longs). Watch for Short Squeezes.Dashboard Ref: Compare your coin's funding to BTC/ETH. If your coin has 0.1% funding while BTC is 0.01%, your crypto is significantly "hotter" than the market average.

Smart RSI Money Flow - Core Bands V1.01SMART RSI – Money Flow Bands (Technical Overview)
1. Background: RSI and Its Behavior on Lower Timeframes
The Relative Strength Index (RSI) originally is a momentum oscillator calculated from average gains and losses over a selected period. In its standard form, RSI is derived solely from price changes; it does not incorporate volume data or order-flow information in its formula.
Because RSI is price-based, its interpretation depends strongly on the timeframe:
• On higher timeframes, each bar aggregates more trading activity, and RSI tends to behave more smoothly.
• On lower timeframes (1-hour down to intraday scalping intervals), price fluctuations are quicker, and RSI becomes more sensitive to short-term noise.
This does not imply that RSI becomes invalid, but that its signals on fast charts can be more reactive and may benefit from additional context such as volume behavior or structural information.
2. Purpose of This Indicator
This indicator extends the classical RSI by adding information that RSI does not include:
• Mapping RSI values into price-based bands instead of the 0–100 oscillator space.
• Retrieving lower timeframe volume data and separating it into buy and sell components.
• Comparing the slope (angle) of price movement with the slope of buy and sell volume.
The goal is to provide a structural interpretation of where price sits relative to RSI conditions and how volume is behaving on a lower timeframe.
3. Technical Differences Compared to Classical RSI
A) Classical RSI
• Input: price only (usually close).
• Output: normalized oscillator between 0 and 100.
• Does not incorporate intra-bar volume distribution.
• Does not separate buy/sell volume.
B) SMART RSI – Money Flow Bands
1) RSI-to-Price Mapping
Converts RSI values into upper/lower price bands using recent price extremes.
2) Lower Timeframe Volume Decomposition
Retrieves LTF data and splits each bar’s volume into buy (close>open) and sell (close

Smart MA Crossover█ OVERVIEW
"Smart MA Crossover" is a technical analysis indicator designed to enhance the effectiveness of strategies based on MA crossovers, combining classic moving average crossovers with breakouts from boxes and dynamic trend visualizations. The indicator is fully customizable—you can freely adjust both parameters and graphical elements.
█ CONCEPTS
Trading approaches based solely on moving average crossover moments generate a large number of false signals. Smart MA Crossover was created to improve this statistic. That's why boxes are added, which are formed from the candle where the MA crossover occurred and generate signals only upon breakout from them. The boxes have bullish (green) and bearish (red) colors. By default, the show_only_matching filter is enabled, displaying entry signals only when the breakout direction matches the box color (e.g., only upward for a bullish box). Boxes are by default the size of the candle on which the crossover occurred, but their size can be adjusted to suit your strategy via an optional average candle size multiplier.
█ FEATURES
- Moving Averages: Two configurable MAs (fast_length, default 10; slow_length, default 30) with selectable type (SMA, EMA, WMA, HMA, VWMA). Optionally displayed with gradient fill between them (color depends on trend: green for uptrend, red for downtrend).
- MA Gradient and Candle Coloring: Enable gradient fill between MAs (transparency: gradient_opacity, default 85) and dynamic candle coloring based on trend (green/red).
- Fog Gradient Trend: Multi-layered gradient "fog" around hl2, consisting of 5 levels up and down, with offset based on average candle size (offset_mult, default 0.7) and increasing transparency (base_transp, default 80; transp_inc, default 4). Fog colors are dynamic (green/red).
- Breakout Boxes: Created at the moment of MA crossover, extending to the right. Box height optionally multiplied by average candle size (use_box_multiplier, box_multiplier, default 1.0). Boxes close and generate a signal when price breaks out beyond the top/bottom edge.
Signals:
- Triangles: Green downward triangles (buy breakout) below the bar, red upward triangles (sell breakout) above the bar—only on breakouts matching direction (if show_only_matching = true). When the matching filter is disabled, every box generates a signal based not on the MA crossover, but on the breakout direction.
- Labels: “BUY” (green, below bar) and “SELL” (red, iabove bar) with transparent background (transparency 40).
- Matching Filter: The show_only_matching option limits signals to breakouts consistent with box direction (bullish box → only buy, bearish → only sell).
- Visualization: Gradient MA lines, fill between MAs, multi-layered fog with increasing transparency, boxes with transparent background (85) and colored borders, dynamic trend colors.
- Alerts: Built-in alerts for BUY and SELL signals (with message including ticker and timeframe).
█ HOW TO USE
Add to Chart: Apply the indicator via Pine Editor or the Indicators menu on TradingView.
Configure Settings:
- MA Settings: Adjust fast (fast_length, default 10) and slow (slow_length, default 30) MA lengths and type (ma_type, default SMA).
- Visualization: Enable/disable MA lines (show_ma_lines), MA gradient (use_gradient_ma), fog trend (show_fog), candle coloring (color_candles).
- Boxes and Breakouts: Enable candle size multiplier (use_box_multiplier) and set value (box_multiplier, default 1.0). Enable signal filter (show_only_matching).
- Signals: Choose type (signal_type): Triangles or Labels (Buy/Sell).
- Fog Trend: Adjust offset (offset_mult), base transparency (base_transp), and increment (transp_inc). Select trend colors (col_up, col_dn).
Signal Interpretation:
- Buy Signals: Green triangles below the bar or “BUY” label—on upward breakout from a bullish box (after bull cross).
- Sell Signals: Red triangles above the bar or “SELL” label—on downward breakout from a bearish box (after bear cross).
- Fog and Gradient: green fog/fill = uptrend; red = downtrend.
- Boxes: Active boxes indicate potential breakout zones; their closure confirms the move.
Signal Confirmation: Use with other tools, such as support/resistance levels, volume, or additional MAs to filter false crossovers.
█ APPLICATIONS
- MA Cross Strategies: Replace classic crossovers—boxes and breakouts eliminate many false signals, thereby increasing effectiveness. Confirm with other indicators, e.g., RSI, Fibonacci, FVG, pivot levels.
- Trend Following: Can be used as a classic trend indicator, especially with larger MA values.
█ NOTES
- Test the indicator across different timeframes and assets, adjusting MA lengths and box multiplier to market volatility.
- In consolidating markets, the indicator generates more false signals.

Smart Liquidity 📊 # 💎 Smart Liquidity Indicator - User Guide
## 📋 Overview
**Smart Liquidity Indicator** is an advanced technical analysis tool for analyzing liquidity and volume in financial markets. It combines several powerful analytical tools to help you make informed trading decisions.
---
## 🎯 Main Components
### 1. 📊 Volume Profile
- **Function**: Displays volume distribution across different price levels
- **Benefit**: Identify strong support and resistance zones based on trading activity
- **Elements**:
- Colored boxes representing volume density at each level
- Labels showing HIGH/LOW of the price range
- PEAK FLOW line indicating the strongest volume level
### 2. 📦 Order Blocks
- **Function**: Identify bullish and bearish Order Block zones
- **Benefit**: Potential areas for price reversal or trend continuation
- **Displayed Information**:
- Delta %: Zone strength (difference between buying and selling pressure)
- Liquidity: Accumulated liquidity in the zone
- Buy/Sell ratios within the zone
### 3. 📈 SuperTrend (Market Direction)
- **Two lines for confirmation**:
- **🎯 Current SuperTrend** (Green/Red): Current timeframe direction
- **🔄 MTF SuperTrend** (Light Green/Red): Higher timeframe direction (4H default)
- **Benefit**: Trade with the overall market trend
### 4. 📊 Dashboard (Information Panel)
- Display current market status
- Trend and momentum information
- Active Order Blocks statistics
---
## 🚀 How to Use
### 1️⃣ **Reading Volume Profile**
- **Dense boxes** = High volume accumulation areas = Strong support/resistance
- **PEAK FLOW line** = Strongest price level (POC - Point of Control)
- **HIGH/LOW Labels** = Boundaries of the analyzed price range
### 2️⃣ **Analyzing Order Blocks**
- **Positive Delta (+)** = Strong buying pressure → Reliable bullish zone
- **Negative Delta (-)** = Strong selling pressure → Reliable bearish zone
- **Delta near 0** = Balance → Weak zone, avoid it
### 3️⃣ **Using SuperTrend**
- **Current TF (Green bullish / Red bearish)**: Current timeframe direction
- **MTF (Light Green bullish / Light Red bearish)**: Higher timeframe direction
- **Best Trading**: When both lines agree on the same direction
### 4️⃣ **Suggested Strategy**
```
✅ Strong Entry Signal:
1. Order Block with strong Delta (>30% or <-30%)
2. Current SuperTrend and MTF in the same direction
3. Volume Profile confirms the level (dense box or PEAK)
4. Price tests the zone for the first time
❌ Avoid Entry When:
- Weak Delta (between -10% and +10%)
- Conflict between Current and MTF SuperTrend
- Zone tested multiple times (weakened)
```
---
## 🎨 Understanding Colors
### Order Blocks
- 🟢 **Green**: Bullish Order Block
- 🔴 **Red**: Bearish Order Block
### SuperTrend
- 🟢 **Green**: Current SuperTrend bullish (same color as Order Blocks)
- 🔴 **Red**: Current SuperTrend bearish (same color as Order Blocks)
- 🟢 **Light Green**: MTF SuperTrend bullish
- 🔴 **Light Red**: MTF SuperTrend bearish
**Note**: Each SuperTrend has different transparency levels based on trend strength
### Volume Profile
- **Gradient from light to dark**: Represents volume density (darker = higher volume)
---
## ⚡ Performance Tips
### For Maximum Speed (Current Settings):
✅ **Enabled**:
- Order Blocks: 2 zones per side
- Volume Profile: 20 levels
- SuperTrends: Both active
- Strength Delta: Displayed
❌ **Disabled** (for speed):
- Gradient Fill
- Predictive Zones
- Background Fill
- MTF Calculations (in internal calculations)
### If Indicator is Slow:
1. Reduce `Profile Rows` from 20 → 15
2. Reduce `Lookback Period` from 50 → 40
3. Reduce `Max Zones` from 2 → 1
4. Turn off `Show OB Labels` if not needed
---
## 🔄 Additional Tools
### ♻️ Reset Now
- **Location**: Visual Tweaks
- **Usage**: If Volume Profile is cluttered, enable it to redraw
- **Note**: Disable after use
### 🎯 Draw Mode
- **Live**: Direct drawing on the last candle
- **Confirmed**: Draw only on closed candles (more stable)
---
## ⚠️ Disclaimer
### 🚨 Important Notice
**This indicator is a technical analysis tool only and is not considered financial advice or a trading recommendation.**
#### 📌 Please Note:
1. **Just an Analytical Tool**:
- The indicator provides technical information based on historical data
- Past results do not guarantee future results
2. **Personal Responsibility**:
- You are solely responsible for your own trading decisions
- Conduct your own research before making any investment decision
- Use appropriate risk management (Stop Loss, Position Sizing)
3. **No Guarantees**:
- There is no guarantee of profit or success in trading
- Financial markets carry high risks
- You may lose your entire invested capital
4. **Consult a Professional**:
- Consult a licensed financial advisor before making important investment decisions
- Ensure you fully understand the risks associated with trading
5. **Proper Use**:
- The indicator is designed as an assistive tool, not an automated trading system
- Preferably combine it with your own analysis and other tools
- Do not rely on a single signal alone
#### ⚖️ Acceptance:
By using this indicator, you acknowledge and agree that:
- The indicator developer is not responsible for any financial losses
- All trading decisions are your personal responsibility
- You understand the risks associated with trading in financial markets
---
## 💡 Final Advice
**"The best traders use tools wisely, not blindly"**
- Learn how the indicator works before relying on it
- Test settings on a demo account first
- Always use Stop Loss
- Don't risk more than you can afford to lose
---
## 📞 Contact and Support
**If you need any help or have any questions, feel free to contact me.**
I'm here to help you understand and use the indicator correctly! 🤝
---
**Good Luck & Trade Safe! 🚀📈**

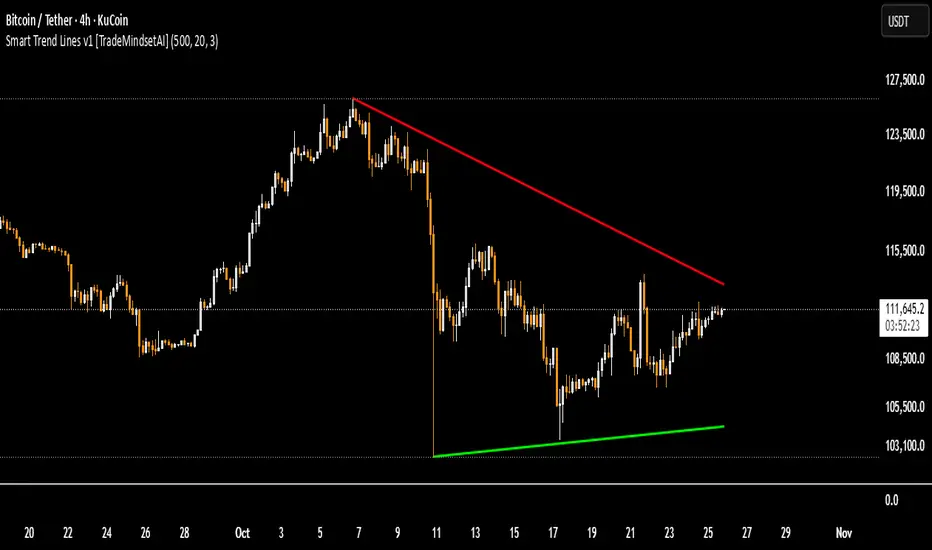
Smart Trend Lines v.1 [TradeMindsetAI]
✅ " 🚀 Smart Trend Lines V.1 🚀 " is an advanced Pine Script indicator that automatically detects and draws dynamic trend lines based on real pivot points from candle shadows (wicks).
✅ Key Features:
• Accurately identifies pivot highs and lows using customizable lookback periods
• Draws support/resistance trend lines only if price has respected them (via pullback or bounce validation)
• Validates lines by ensuring price doesn't cross the projected line in its path
• Limits the number of displayed lines to keep the chart clean
• Auto-removes outdated lines (older than 500 bars)
• Fully customizable line colors, styles (solid/dashed/dotted), and widths
✅ Ideal for traders seeking reliable, reactive trend lines across all timeframes.
✅ Note: Lines are calculated only after analyzing at least 1000 candles for maximum accuracy.
✅ Recommended Settings:
`Lookback Candles: 500` | `Pivot Period: 20` | `Pivot Points: 3`
`Lookback Candles: 500` | `Pivot Period: 17` | `Pivot Points: 3`
`Lookback Candles: 500` | `Pivot Period: 11` | `Pivot Points: 3`
🎯Built for traders who demand **pixel-perfect accuracy**.
⭐Like & Follow for more elite tools!
#trendline #smart #support #resistance #pivot #crypto #forex
✅ این اندیکاتور🚀"Smart Trend Lines V.1" 🚀 به صورت خودکار خطوط روند صعودی (حمایتی) و نزولی (مقاومتی) را بر اساس پیوتهای واقعی سایه کندلها شناسایی و رسم میکند.
✅ ویژگیهای کلیدی:
• تشخیص خودکار پیوتهای کف و سقف با دوره قابل تنظیم
• رسم خطوط روند تنها در صورتی که قیمت به آنها واکنش نشان داده باشد
• اعتبارسنجی دقیق خطوط با بررسی عدم نفوذ قیمت در مسیر روند
• محدود کردن تعداد خطوط نمایش داده شده برای جلوگیری از شلوغی چارت
• حذف خودکار خطوط قدیمی (بیش از ۵۰۰ کندل)
• قابلیت تنظیم رنگ، سبک و ضخامت خطوط حمایتی و مقاومتی
✅ مناسب برای تحلیلگرانی که به دنبال خطوط روند معتبر و پویا در تایمفریمهای مختلف هستند.
✅ نکته: خطوط فقط پس از بررسی حداقل ۱۰۰۰ کندل رسم میشوند تا از دقت بالا اطمینان حاصل شود.
✅ تنظیمات پیشنهادی:
`Lookback Candles: 500` | `Pivot Period: 20` | `Pivot Points: 3`
`Lookback Candles: 500` | `Pivot Period: 17` | `Pivot Points: 3`
`Lookback Candles: 500` | `Pivot Period: 11` | `Pivot Points: 3`
🎯 برای معاملهگرانی که دقت پیکسلبهپیکسل میخواهند.
⭐ لایک و فالو کنید تا ابزارهای حرفهای بیشتری ببینید!
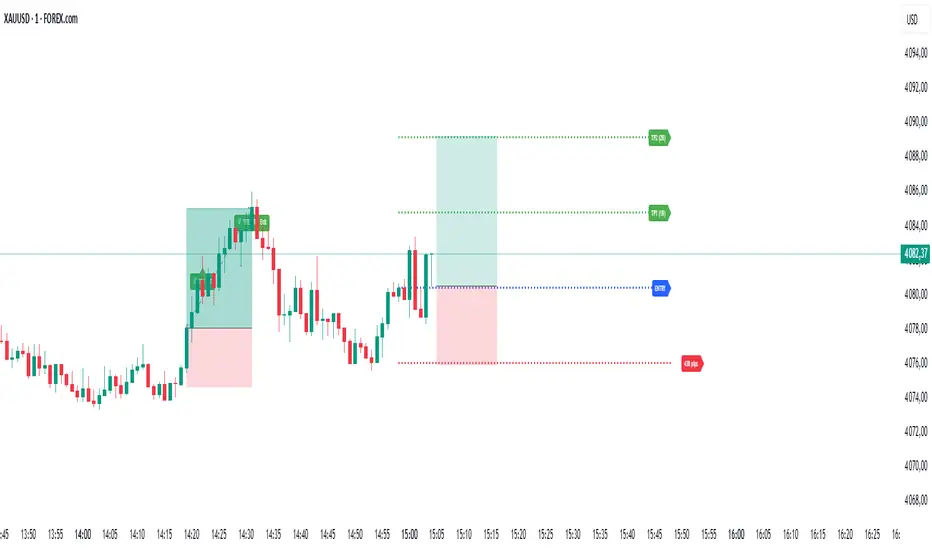
golden smart entrySmart Money Concepts (SMC) is a trading methodology that focuses on understanding and following the behavior of institutional investors—often referred to as "smart money." The goal is to identify high-probability trade setups by analyzing how these large players move the market.
Smart Money Concepts [varshitAlgo]🚀 Smart Money Concept (SMC) – Varshit Algo Indicator
The Varshit Algo Indicator is built for traders who want to trade like institutions and understand the true market structure behind the charts. It combines multiple Smart Money Concepts into one powerful tool to help identify high-probability trade setups.
🔹 Key Features:
Automatically detects Order Blocks, Break of Structure (BOS), and Market Structure Shifts (MSS)
Highlights Fair Value Gaps (FVG) for precise entry points
Identifies liquidity zones and reversal areas where market makers trap retail traders
Multi-timeframe confirmation for stronger signals
Clean, user-friendly, and professional visual design
🔹 Best For:
Scalping, intraday, and swing trading
Traders who want to apply institutional trading concepts
Beginners to learn SMC + Advanced traders to execute strategies with confidence
⚠️ Disclaimer: This indicator is for educational and analytical purposes only. It is not financial advice. Always trade with proper risk management.

Smart CRT Indicator📌 Smart CRT Indicator – Spot Trend Reversals and Continuations with Precision
The Smart CRT Indicator is a versatile price action tool that identifies Candle Range Trap (CRT) patterns—powerful setups that often precede either trend reversals or breakout continuations.
It detects and visualizes market conditions where price gets "trapped" within a prior range or breaks out deceptively, giving traders early insight into potential directional moves.
🔍 Key Features:
✅ Bullish & Bearish CRT Signals
Accurately spots both reversal and continuation setups using CRT logic across three core patterns.
✅ Flexible Range Close Filter
Customize how deeply the second candle closes within the first candle's range to fine-tune signal quality.
✅ Trend Filter (Optional)
Choose whether to only show signals aligned with the dominant trend, using a customizable SMA filter.
✅ Visual Range Mapping
Automatically draws range lines to mark key price zones for CRT patterns. Adjustable style, color, and width.
✅ Real-Time Alerts
Get notified instantly when a new CRT pattern appears on your chart.
🧠 CRT Pattern Types Detected:
Inside Bar CRT: A compression pattern inside a larger range that signals potential breakout or reversal.
Multi-Candle CRT: A group of smaller candles shrinking inside an anchor candle—often a sign of building momentum.
Purge CRT: A deceptive breakout beyond the previous candle’s range, followed by an immediate reversal.
⚙️ Best For:
Traders seeking trend continuation breakout setups
Traders looking to fade false moves or catch reversals
Price action traders who rely on candle structure and traps
Swing, intraday, or even scalping strategies
🧩 Tip:
Combine CRT signals with Key Levels, FVG, support/resistance or order block zones for high-probability confluence entries.

Smart TP Manager V.1.1 (SL trail par TP)🔹 Smart TP Manager V1.1 – Trade Management Advanced
A powerful TradingView tool designed to enhance trade management and protect profits.
Features:
Automatically detect Long/Short signals using EMA crossovers, RSI filter, higher-timeframe EMA trend, and ADX strength.
Calculate and display a dynamic Stop Loss based on ATR.
Automatically set TP1, TP2, TP3 with advanced Breakeven management:
SL moves to Entry after TP1 hit
SL moves to TP1 after TP2 hit, securing partial profits
Track your performance with a comprehensive statistics table (Win/Loss, BE, win rate, net profit in R).
Clear visual display of entries, SL, and TPs using colored lines and labels.
Receive automatic alerts for every signal and target reached.
Optional SL trailing feature to secure profits progressively as targets are hit.
📊 Smart TP Manager V1.1 is your assistant for risk control, trade optimization, and profit protection on TradingView.
Smart Index Levels — GSK-VIZAG-AP-INDIA📌 Smart Index Levels — GSK-VIZAG-AP-INDIA
Smart Index Levels is a versatile support and resistance plotting tool designed for intraday, weekly, and monthly analysis.
It automatically generates key price zones based on user-defined step sizes, helping traders visualize important market levels more clearly.
🔹 Features
Daily / Weekly / Monthly Modes
Switch easily between daily, weekly, or monthly reference levels.
Customizable Level Steps
Choose step intervals of 50 or 100 points for cleaner index-based zones.
Support & Resistance Zones
Auto-draws multiple support and resistance levels around the opening base price.
Mid-Level Marking
Highlights the nearest “mid” price level for balance reference.
Weekly High/Low Tracking (Optional)
Plots dynamic weekly high & low levels with dotted lines.
Monthly High/Low Tracking (Optional)
Displays monthly high & low levels for broader market context.
Custom Market Session Timing
Define your own market open and close times.
Line Style & Colors
Fully customizable line styles (solid, dashed, dotted) and colors.
⚙️ How It Works
At the start of the selected session (daily, weekly, or monthly), the script identifies the opening reference price.
From this base, it calculates and draws support and resistance levels at fixed step intervals.
Optionally, it overlays weekly and monthly high/low levels for additional perspective.
This provides a structured price map that helps you quickly spot potential reaction zones, without cluttering the chart.
🖥️ Best Use Cases
Intraday index traders who want quick reference levels (Nifty, BankNifty, etc.)
Swing traders who prefer weekly and monthly zones for context.
Anyone looking for clean, rule-based support/resistance plotting.
⚠️ Disclaimer
This indicator is for educational and informational purposes only.
It does not provide financial advice or trading signals. Always use in combination with your own analysis and risk management.

✨Smart Option MACD: Bullish, Bearish, Neutral Logic by AKM ✨The **Smart Option MACD: Bullish, Bearish, Neutral Logic by AKM** is an advanced indicator designed for TradingView, tailored for option traders on indices like NIFTY. It automates options trend scanning by applying MACD analysis to both Call (CE) and Put (PE) options near the ATM (At-The-Money) strike, providing actionable market states—Bullish, Bearish, or Neutral—using distinct logic for both strikes and overall market context.
***
### Core Features
- **Option Selection Logic:** The script dynamically calculates ATM, CE, and PE strike prices based on the underlying index spot price and customizable user inputs for expiry, strike distance, and OTM/ITM shift.
- **MACD on Option Prices:** For both CE and PE symbols, the indicator computes the MACD (Moving Average Convergence Divergence) and Signal lines. It uses standard MACD settings: 12-period EMA (fast), 26-period EMA (slow), and 9-period Signal.
- **Strike Status Classification:**
- AZL 🔼: Indicates MACD > 0 for that option, signifying positive momentum.
- BZL 🔽: Indicates MACD 0 & crossover up), PE is bearish (MACD<0 & crossover down).
- **Bearish:** PE is bullish & crossover up, CE is bearish & crossover down.
- **Neutral:** All other scenarios—including mixed or undefined signals.
***
### Table Output
A real-time table is displayed on the chart (top-right) with key option and market details:
- Spot price
- ATM Strike
- CE/PE strike status (momentum + crossover logic)
- Option prices
- Overall market state, color-coded for clarity
***
### How to Use This Indicator
- **Entry Signal:** Use the Bullish/Bearish status for directional trades or option strategies. Bullish calls for buying or selling upward momentum options; Bearish favors downside trades. Neutral advises caution or range-bound trades.
- **Customizability:** Expiry, strike width, OTM/ITM offset, and chart resolution are user-controlled, allowing adaptation to different market contexts.
- **Best Practice:** Use alongside price action, support/resistance zones and other indicators to confirm options momentum, as MACD is powerful yet not infallible.
***
### Who Is It For?
- **Option traders** who want to automate trend/momentum detection for CE/PE strikes instead of manual chart switching.
- **Index traders** (NIFTY, BANKNIFTY...) seeking systematic edge in intraday/positional strategies tied to option momentum.
- **Technical analysts** interested in visual, rule-based signals combining options data and classic MACD logic.
***
The Smart Option MACD indicator streamlines multi-strike, multi-option momentum analysis and presents clear actionable logic directly on your chart for enhanced decision-making. Use it as a core part of your TradingView toolkit for options-focused market views.

Smart Trend Signals [QuantAlgo]🟢 Overview
The Smart Trend Signals indicator is created to address a fundamental challenge in technical analysis: generating timely trend signals while adapting to varying market volatility conditions. The indicator distinguishes itself by employing volatility-adjusted calculations that automatically modify signal sensitivity based on current market conditions, rather than using fixed parameters that perform inconsistently across different market environments. By processing Long and Short signals through separate dynamic calculation engines, each optimized for its respective directional bias, the indicator reduces the common issue of delayed or conflicting signals that plague many traditional trend-following tools. Additionally, the integration of linear regression-based trend confirmation adds another layer of signal validation, helping to filter market noise while maintaining responsiveness to genuine price movements. This adaptive approach makes the indicator practical for both traders and investors across different asset classes and timeframes, from short-term forex/crypto scalping to long-term equity position analysis.
🟢 How It Works
The indicator uses a straightforward calculation process that combines volatility measurement with momentum detection to generate directional signals. The system first calculates Average True Range (ATR) over a user-defined period to measure current market volatility. This ATR value is then multiplied by the Smart Trend Multiplier setting to create dynamic reference levels that expand during volatile periods and contract during calmer market conditions.
For signal generation, the indicator maintains separate calculation paths for Long/Buy and Short/Sell opportunities. Long signals are generated when price moves above a dynamically calculated level below the current price, confirmed by an exponential moving average crossover in the same direction. Short signals work in reverse, triggering when price moves below a calculated level above the current price, also requiring EMA confirmation. This dual-path approach allows each signal type to operate with parameters suited to its directional bias.
🟢 How to Use
Long Signals (Green Labels): Appear as "Long" labels below price bars when the indicator detects upward price momentum above the calculated reference level, confirmed by EMA crossover. These signals identify moments when price action demonstrates bullish characteristics based on the volatility-adjusted calculations.
Short Signals (Red Labels): Display as "Short" labels above price bars when downward price momentum below the reference level is detected and confirmed by EMA crossover. These signals highlight instances where price action exhibits bearish characteristics according to the indicator's mathematical framework.
Customizable Bar Coloring: This feature colors individual price bars to match the current signal direction. When enabled, each bar reflects the indicator's current directional bias, creating a continuous visual representation of trend periods across the chart timeline.
Built-in Alert System: Provides automatic notifications for new signals with detailed exchange and ticker information. The alert system monitors the indicator's calculations continuously and triggers notifications when new long or short signals are generated, allowing traders/investors to track multiple instruments simultaneously.
🟢 Pro Tips for Trading and Investing
→ Parameter Adjustment: Higher Smart Trend Multiplier settings generate fewer signals that may be more selective, while lower settings produce more frequent signals that may include more false positives. Test different settings to find what works for your trading style and market conditions.
→ Timeframe Analysis: Using higher timeframes for general trend direction and lower timeframes for entry timing is a common approach.
→ Risk Management: No indicator eliminates the need for proper risk management. Use appropriate position sizing and stop-loss strategies regardless of signal quality or frequency.
→ Market Conditions: The indicator may perform differently in trending versus ranging markets. Frequent signal changes might indicate choppy conditions. Backtest and paper trade before risking real capital.

Smart Order Blocks [Pro Version]Here’s a **clear, detailed "How It Works" explanation** for this indicator:
---
## ✅ **Smart Order Blocks \ – How It Works**
### **Purpose**
This indicator detects **Order Blocks (OBs)** based on **pivot highs and lows**, and automatically marks **Bullish** and **Bearish OB zones** on the chart with optional extensions and alerts. It is designed to help traders identify **institutional price levels** where liquidity is often engineered for future price moves.
---
### **Customization Options**
✔ **Source** → Choose between Wicks or Bodies for OB calculation.
✔ **Pivot Settings** → Adjust sensitivity for detecting pivots.
✔ **Extend OBs** → Keep zones visible until tapped, or fix a specific width.
✔ **Show Labels** → Displays OB type and strength on chart.
✔ **Colors** → Configure Bullish, Bearish, and Invalid OB colors.
---
### **Practical Usage**
* **Entry Strategy**:
* Wait for price to **revisit a Bullish OB** in an uptrend → Long entry.
* Wait for price to **revisit a Bearish OB** in a downtrend → Short entry.
* Combine with:
* **Market Structure (HH/HL or LH/LL)**.
* **Confirmation signals** (e.g., candlestick pattern, break of structure).
* **Risk Management** → Stop loss outside OB zone.
---
### ✅ **Summary in One Sentence**
The indicator automatically identifies **institutional OB zones**, shows their strength, extends them until mitigated, and alerts you when price interacts with these key liquidity levels, helping you trade like Smart Money.
---

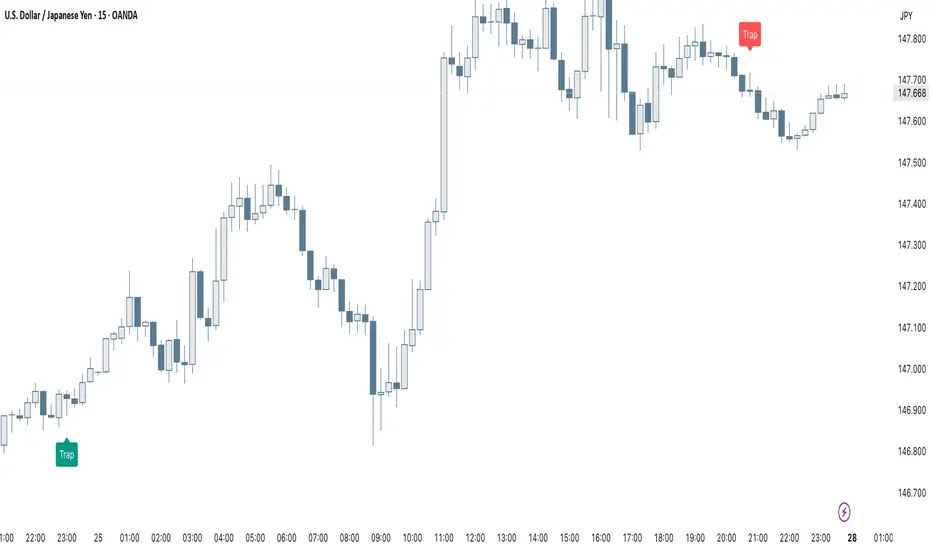
Smart Trap Candle Detector [Pro]Purpose
The Smart Trap Candle Detector is designed to identify common fakeout scenarios in the market, where price breaks a key swing high or low and quickly reverses. These “trap candles” often mislead breakout traders and are commonly used by smart money to induce liquidity before reversing.
How It Works
The script detects potential trap candles using these conditions:
A bearish trap is identified when price breaks above a recent swing high and closes back below it.
A bullish trap is identified when price breaks below a recent swing low and closes back above it.
Optional confirmation from the previous candle’s direction can be enabled.
Swing highs/lows are calculated dynamically using a configurable lookback window.
Once a trap candle is confirmed, a signal is displayed on the chart along with optional labels and alert conditions.
Features
Detects fake breakouts of swing highs and lows
Configurable swing lookback period
Optional confirmation candle filter
Optional label display on trap bars
Built-in alerts for bullish and bearish trap signals
Lightweight, real-time signal detection
Usage Tips
Best used on intraday timeframes such as 15m, 30m, or 1H
Use around key support/resistance zones or liquidity areas
Combine with other confluence signals such as order blocks or RSI divergence
Adjust the swing lookback period depending on the volatility of the asset
Smart MTF S/R Levels[BullByte]
Smart MTF S/R Levels
Introduction & Motivation
Support and Resistance (S/R) levels are the backbone of technical analysis. However, most traders face two major challenges:
Manual S/R Marking: Drawing S/R levels by hand is time-consuming, subjective, and often inconsistent.
Multi-Timeframe Blind Spots: Key S/R levels from higher or lower timeframes are often missed, leading to surprise reversals or missed opportunities.
Smart MTF S/R Levels was created to solve these problems. It is a fully automated, multi-timeframe, multi-method S/R detection and visualization tool, designed to give traders a complete, objective, and actionable view of the market’s most important price zones.
What Makes This Indicator Unique?
Multi-Timeframe Analysis: Simultaneously analyzes up to three user-selected timeframes, ensuring you never miss a critical S/R level from any timeframe.
Multi-Method Confluence: Integrates several respected S/R detection methods—Swings, Pivots, Fibonacci, Order Blocks, and Volume Profile—into a single, unified system.
Zone Clustering: Automatically merges nearby levels into “zones” to reduce clutter and highlight areas of true market consensus.
Confluence Scoring: Each zone is scored by the number of methods and timeframes in agreement, helping you instantly spot the most significant S/R areas.
Reaction Counting: Tracks how many times price has recently interacted with each zone, providing a real-world measure of its importance.
Customizable Dashboard: A real-time, on-chart table summarizes all key S/R zones, their origins, confluence, and proximity to price.
Smart Alerts: Get notified when price approaches high-confluence zones, so you never miss a critical trading opportunity.
Why Should a Trader Use This?
Objectivity: Removes subjectivity from S/R analysis by using algorithmic detection and clustering.
Efficiency: Saves hours of manual charting and reduces analysis fatigue.
Comprehensiveness: Ensures you are always aware of the most relevant S/R zones, regardless of your trading timeframe.
Actionability: The dashboard and alerts make it easy to act on the most important levels, improving trade timing and risk management.
Adaptability: Works for all asset classes (stocks, forex, crypto, futures) and all trading styles (scalping, swing, position).
The Gap This Indicator Fills
Most S/R indicators focus on a single method or timeframe, leading to incomplete analysis. Manual S/R marking is error-prone and inconsistent. This indicator fills the gap by:
Automating S/R detection across multiple timeframes and methods
Objectively scoring and ranking zones by confluence and reaction
Presenting all this information in a clear, actionable dashboard
How Does It Work? (Technical Logic)
1. Level Detection
For each selected timeframe, the script detects S/R levels using:
SW (Swing High/Low): Recent price pivots where reversals occurred.
Pivot: Classic floor trader pivots (P, S1, R1).
Fib (Fibonacci): Key retracement levels (0.236, 0.382, 0.5, 0.618, 0.786) over the last 50 bars.
Bull OB / Bear OB: Institutional price zones based on bullish/bearish engulfing patterns.
VWAP / POC: Volume Weighted Average Price and Point of Control over the last 50 bars.
2. Level Clustering
Levels within a user-defined % distance are merged into a single “zone.”
Each zone records which methods and timeframes contributed to it.
3. Confluence & Reaction Scoring
Confluence: The number of unique methods/timeframes in agreement for a zone.
Reactions: The number of times price has touched or reversed at the zone in the recent past (user-defined lookback).
4. Filtering & Sorting
Only zones within a user-defined % of the current price are shown (to focus on actionable areas).
Zones can be sorted by confluence, reaction count, or proximity to price.
5. Visualization
Zones: Shaded boxes on the chart (green for support, red for resistance, blue for mixed).
Lines: Mark the exact level of each zone.
Labels: Show level, methods by timeframe (e.g., 15m (3 SW), 30m (1 VWAP)), and (if applicable) Fibonacci ratios.
Dashboard Table: Lists all nearby zones with full details.
6. Alerts
Optional alerts trigger when price approaches a zone with confluence above a user-set threshold.
Inputs & Customization (Explained for All Users)
Show Timeframe 1/2/3: Enable/disable analysis for each timeframe (e.g., 15m, 30m, 1h).
Show Swings/Pivots/Fibonacci/Order Blocks/Volume Profile: Select which S/R methods to include.
Show levels within X% of price: Only display zones near the current price (default: 3%).
How many swing highs/lows to show: Number of recent swings to include (default: 3).
Cluster levels within X%: Merge levels close together into a single zone (default: 0.25%).
Show Top N Zones: Limit the number of zones displayed (default: 8).
Bars to check for reactions: How far back to count price reactions (default: 100).
Sort Zones By: Choose how to rank zones in the dashboard (Confluence, Reactions, Distance).
Alert if Confluence >=: Set the minimum confluence score for alerts (default: 3).
Zone Box Width/Line Length/Label Offset: Control the appearance of zones and labels.
Dashboard Size/Location: Customize the dashboard table.
How to Read the Output
Shaded Boxes: Represent S/R zones. The color indicates type (green = support, red = resistance, blue = mixed).
Lines: Mark the precise level of each zone.
Labels: Show the level, methods by timeframe (e.g., 15m (3 SW), 30m (1 VWAP)), and (if applicable) Fibonacci ratios.
Dashboard Table: Columns include:
Level: Price of the zone
Methods (by TF): Which S/R methods and how many, per timeframe (see abbreviation key below)
Type: Support, Resistance, or Mixed
Confl.: Confluence score (higher = more significant)
React.: Number of recent price reactions
Dist %: Distance from current price (in %)
Abbreviations Used
SW = Swing High/Low (recent price pivots where reversals occurred)
Fib = Fibonacci Level (key retracement levels such as 0.236, 0.382, 0.5, 0.618, 0.786)
VWAP = Volume Weighted Average Price (price level weighted by volume)
POC = Point of Control (price level with the highest traded volume)
Bull OB = Bullish Order Block (institutional support zone from bullish price action)
Bear OB = Bearish Order Block (institutional resistance zone from bearish price action)
Pivot = Pivot Point (classic floor trader pivots: P, S1, R1)
These abbreviations appear in the dashboard and chart labels for clarity.
Example: How to Read the Dashboard and Labels (from the chart above)
Suppose you are trading BTCUSDT on a 15-minute chart. The dashboard at the top right shows several S/R zones, each with a breakdown of which timeframes and methods contributed to their detection:
Resistance zone at 119257.11:
The dashboard shows:
5m (1 SW), 15m (2 SW), 1h (3 SW)
This means the level 119257.11 was identified as a resistance zone by one swing high (SW) on the 5-minute timeframe, two swing highs on the 15-minute timeframe, and three swing highs on the 1-hour timeframe. The confluence score is 6 (total number of method/timeframe hits), and there has been 1 recent price reaction at this level. This suggests 119257.11 is a strong resistance zone, confirmed by multiple swing highs across all selected timeframes.
Mixed zone at 118767.97:
The dashboard shows:
5m (2 SW), 15m (2 SW)
This means the level 118767.97 was identified by two swing points on both the 5-minute and 15-minute timeframes. The confluence score is 4, and there have been 19 recent price reactions at this level, indicating it is a highly reactive zone.
Support zone at 117411.35:
The dashboard shows:
5m (2 SW), 1h (2 SW)
This means the level 117411.35 was identified as a support zone by two swing lows on the 5-minute timeframe and two swing lows on the 1-hour timeframe. The confluence score is 4, and there have been 2 recent price reactions at this level.
Mixed zone at 118291.45:
The dashboard shows:
15m (1 SW, 1 VWAP), 5m (1 VWAP), 1h (1 VWAP)
This means the level 118291.45 was identified by a swing and VWAP on the 15-minute timeframe, and by VWAP on both the 5-minute and 1-hour timeframes. The confluence score is 4, and there have been 12 recent price reactions at this level.
Support zone at 117103.10:
The dashboard shows:
15m (1 SW), 1h (1 SW)
This means the level 117103.10 was identified by a single swing low on both the 15-minute and 1-hour timeframes. The confluence score is 2, and there have been no recent price reactions at this level.
Resistance zone at 117899.33:
The dashboard shows:
5m (1 SW)
This means the level 117899.33 was identified by a single swing high on the 5-minute timeframe. The confluence score is 1, and there have been no recent price reactions at this level.
How to use this:
Zones with higher confluence (more methods and timeframes in agreement) and more recent reactions are generally more significant. For example, the resistance at 119257.11 is much stronger than the resistance at 117899.33, and the mixed zone at 118767.97 has shown the most recent price reactions, making it a key area to watch for potential reversals or breakouts.
Tip:
“SW” stands for Swing High/Low, and “VWAP” stands for Volume Weighted Average Price.
The format 15m (2 SW) means two swing points were detected on the 15-minute timeframe.
Best Practices & Recommendations
Use with Other Tools: This indicator is most powerful when combined with your own price action analysis and risk management.
Adjust Settings: Experiment with timeframes, clustering, and methods to suit your trading style and the asset’s volatility.
Watch for High Confluence: Zones with higher confluence and more reactions are generally more significant.
Limitations
No Future Prediction: The indicator does not predict future price movement; it highlights areas where price is statistically more likely to react.
Not a Standalone System: Should be used as part of a broader trading plan.
Historical Data: Reaction counts are based on historical price action and may not always repeat.
Disclaimer
This indicator is a technical analysis tool and does not constitute financial advice or a recommendation to buy or sell any asset. Trading involves risk, and past performance is not indicative of future results. Always use proper risk management and consult a financial advisor if needed.

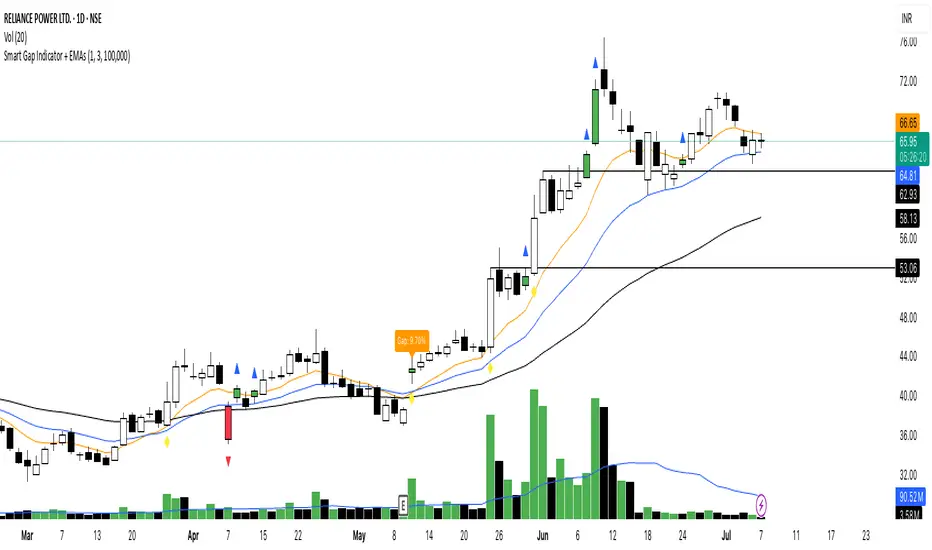
Smart Gap Indicator + EMAs📈 Smart Gap Indicator + EMAs
Spot high-impact gaps with precision and confidence.
🔍 What it does:
This tool identifies and highlights strategic price gaps that often precede strong directional moves. It filters out noise by combining advanced logic with volume activity and trend bias, helping you focus on the most relevant setups.
📊 Key Features:
Smart Gap Detection – Automatically detects meaningful gap up/down events based on dynamic thresholds.
EMA Trend Filter – Optional multi-EMA filter (10, 21, 50) to help align trades with the prevailing market trend.
Volume Spike Signal – Highlights volume surges that may indicate institutional involvement.
Clean Visuals – Configurable labels, shapes, and optional gap fill lines to aid quick interpretation.
Gap Performance Table – Summarizes recent gap activity to assess directional bias.
⚠️ Built-in Alerts:
Gap Up
Gap Down
Gap + Volume Spike
💡 Made by a trader, for traders.
Whether you're a swing trader, gap hunter, or momentum follower—this tool was crafted to give you an edge where it matters most: timing.
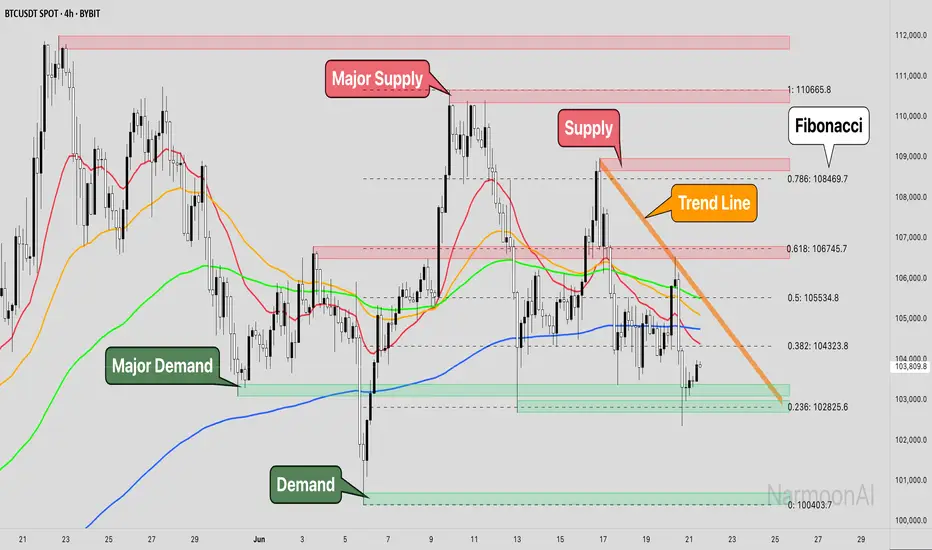
Smart Money Concepts + Fibonacci + EMA - AI Enhanced Analysis### █ OVERVIEW
This indicator is not just another "all-in-one" tool; it's a **specialized data visualization layer designed for the new era of AI-driven chart analysis**. The primary purpose of the **"NarmoonAI"** indicator is to structure and display key market information in a clean, consistent, and machine-readable format.
Standard charts can be noisy and ambiguous for AI Vision models (like Google's Gemini or OpenAI's GPT-4). This script solves that problem by consolidating the most crucial technical analysis concepts—Smart Money Concepts, Trend Analysis, and Key Levels—into a clear visual language that an AI can easily interpret from a single screenshot.
This approach allows traders to leverage the power of artificial intelligence for faster, more objective, and deeper market analysis. It's designed to work seamlessly with our custom AI assistant, the **NarmoonAI Telegram Bot**, but can be used with any modern AI vision tool.
---
### █ CORE COMPONENTS & LOGIC
This indicator is a "mashup" with a clear purpose: to create a comprehensive yet clean analytical framework. Here is how each component contributes to the overall goal of AI-enhanced analysis:
**1. Smart Money Concepts (Supply & Demand Zones):**
* **How it works:** The script automatically identifies significant market turning points by detecting swing highs and lows using `ta.pivothigh` and `ta.pivotlow` over a user-defined `Swing Length`. These pivots form the basis of our Supply (resistance) and Demand (support) zones.
* **The "Smart" Edge:** To filter out weaker zones, the indicator analyzes the volume profile. Zones that are formed during periods of high volume (defined as >1.5x the 20-period simple moving average of volume) are highlighted in a stronger, more vibrant color. This signals areas of high institutional interest, a key concept in Smart Money analysis.
**2. Multi-Layered Trend Analysis (Exponential Moving Averages - EMAs):**
* **How it works:** We've included a customizable suite of four essential EMAs (20, 50, 100, and 200). These are not just random lines; they provide an instant visual reference for short, medium, and long-term trend direction and dynamic support/resistance.
* **Why it's useful for AI:** An AI can instantly parse the order and slope of these EMAs. For example, it can identify a strong uptrend when the price is above the 20 EMA, which is above the 50 EMA, and so on.
**3. Automatic Fibonacci Retracement:**
* **How it works:** Manually drawing Fibonacci levels is subjective and time-consuming. This script automates the process by identifying the highest high and lowest low over a `Fibonacci Lookback Period` (defaulting to 100 bars) and automatically plots the key retracement levels (0.236, 0.382, 0.5, 0.618, 0.786).
* **Why it's useful for AI:** It provides objective, universally recognized potential support and resistance levels without any manual drawing, ensuring a clean and consistent chart for analysis.
**4. Dynamic Trend Channels:**
* **How it works:** The indicator automatically draws trend channels by connecting the two most recent significant pivot highs (for a downtrend channel) or pivot lows (for an uptrend channel).
* **The "Dynamic" Edge:** The width of the channel is not fixed. It's dynamically calculated using the Average True Range (ATR), allowing the channel to expand and contract based on the market's current volatility. This provides a much more adaptive and realistic view of the trend's boundaries.
---
### █ HOW TO USE THIS INDICATOR
There are two primary ways to use the NarmoonAI indicator:
**A) For AI-Powered Analysis (Recommended):**
1. Apply the **NarmoonAI** indicator to any chart.
2. Take a clean screenshot of your chart.
3. Upload the image to your preferred AI Vision model (e.g., Gemini, ChatGPT) or, for the best results, use our specialized **NarmoonAI Telegram bot**.
4. Ask the AI for a detailed analysis. **Example Prompts:**
* *"Based on this chart, what is the current market structure? Identify key support and resistance levels."*
* *"Is there a potential long setup forming according to the information from the NarmoonAI indicator?"*
* *"Summarize the trend direction and strength using the EMAs and trend channels shown."*
**B) For Manual Trading:**
Traders can use the confluence of signals for high-probability setups:
* **High-Probability Long:** Look for the price to enter a **Strong Demand Zone** that aligns with a key **Fibonacci level** (e.g., 0.618) and is respected by a major **EMA** (e.g., the 50 or 100 EMA).
* **High-Probability Short:** Look for the price to test a **Strong Supply Zone** near the top of a **descending trend channel**, with EMAs confirming the bearish momentum.
---
*This script was created by NarmoonAI to bridge the gap between traditional technical analysis and the powerful capabilities of modern artificial intelligence. We believe this is the future of trading analysis.*
Smart Bar Counter with Alerts🚀 Smart Bar Counter with Alerts 🚀
-----------------------------------------------------
Overview
-----------------------------------------------------
Ever wanted to count a specific number of bars from a key point on your chart—such as after a Break of Structure (BOS), the start of a new trading session, or from any point of interest— without having to stare at the screen?
This "Smart Bar Counter" indicator was created to solve this exact problem. It's a simple yet powerful tool that allows you to define a custom "Start Point" and a "Target Bar Count." Once the target count is reached, it can trigger an Alert to notify you immediately.
-----------------------------------------------------
Key Features
-----------------------------------------------------
• Manual Start Point: Precisely select the date and time from which you want the count to begin, offering maximum flexibility in your analysis.
• Custom Bar Target: Define exactly how many bars you want to count, whether it's 50, 100, or 200 bars.
• On-Chart Display: A running count is displayed on each bar after the start time, allowing you to visually track the progress.
• Automatic Alerts: Set up alerts to be notified via TradingView's various channels (pop-up, mobile app, email) once the target count is reached.
-----------------------------------------------------
How to Use
-----------------------------------------------------
1. Add this indicator to your chart.
2. Go to the indicator's Settings (Gear Icon ⚙️).
- Select Start Time: Set the date and time you wish to begin counting.
- Number of Bars to Count: Input your target number.
3. Set up the Alert ( Very Important! ).
- Right-click on the chart > Select " Add alert ."
- In the " Condition " dropdown, select this indicator: Smart Bar Counter with Alerts .
- In the next dropdown, choose the available alert condition.
- Set " Options " to Once Per Bar Close .
- Choose your desired notification methods under " Alert Actions ."
- Click " Create ."
-----------------------------------------------------
Use Cases
-----------------------------------------------------
• Post-Event Analysis: Count bars after a key event like a Break of Structure (BOS) or Change of Character (CHoCH) to observe subsequent price action.
• Time-based Analysis: Use it to count bars after a market open for a specific session (e.g., London, New York).
• Strategy Backtesting: Useful for testing trading rules that are based on time or a specific number of bars.
-----------------------------------------------------
Final Words
-----------------------------------------------------
Hope you find this indicator useful for your analysis and trading strategies! Feel free to leave comments or suggestions below.
