Scalping m15 indicator RovTradingScalping Indicator Combining UT Bot and Linear Regression Candles.
UT Bot uses ATR Trailing Stop to identify entry points.
Linear Regression Candles smooth price action and provide trend signals.
The indicator is suitable for scalping trading on the M15 timeframe.
Pesquisar nos scripts por "scalping"

Reversal Scalping Ribbon - Adib NooraniThe Reversal Scalping Ribbon is a trend-following overlay tool designed to visually identify potential reversal zones based on price extremes and dynamic volatility bands. It calculates adaptive upper and lower bands using price action and custom ATR logic, helping traders quickly assess market direction and possible turning points
🔹 Volatility-adjusted bands based on price highs/lows
🔹 Color-coded ribbons to indicate trend bias and potential reversal shifts
🔹 No repainting, works on all timeframes and assets
🔹 Visual-only display, no trade signals — supports discretion-based entries
This ribbon is designed for scalpers and intraday traders to spot reversal setups with clarity. It enhances your trading by showing real-time market bias without unnecessary distractions. By focusing on probabilities, it helps to improve decision-making in fast-paced environments
How to use the indicator efficiently
For Reversal Trading:
Buy: When price closes below the green ribbon with a red candle, then re-enters with a green candle. Enter above the high of the green candle with a stop loss below the lowest low of the recent green/red candles
Sell: When price closes above the red ribbon with a green candle, then re-enters with a red candle. Enter below the low of the red candle with a stop loss above the highest high of the recent red/green candles
Risk Management:
Limit risk to 0.5% of your capital per trade
Take 50% profit at a 1:1 risk-reward ratio
For the remaining 50%, trail using the lower edge of the green band for buys and the upper edge of the red band for sells

HMA Breakout Buy/Sell indicator for Scalping & Intraday - ShyamHi All,
This is a very simple indicator which provides the buy signal, when the moving average lines turns Green and sell signal, when the moving average signal turns red. This can be used for both intraday and scalping method with different timeframes. But best time frame is 5 minutes.
Buy Signal >>> Line turns GREEN (Use trailing SL to cover maximum profit)
Sell Signal >>> Line turns RED (Use trailing SL to cover maximum profit)
No trade >>> Line turns GRAY
Best timeframe >>> 5 minutes
Thanks,
Shyam

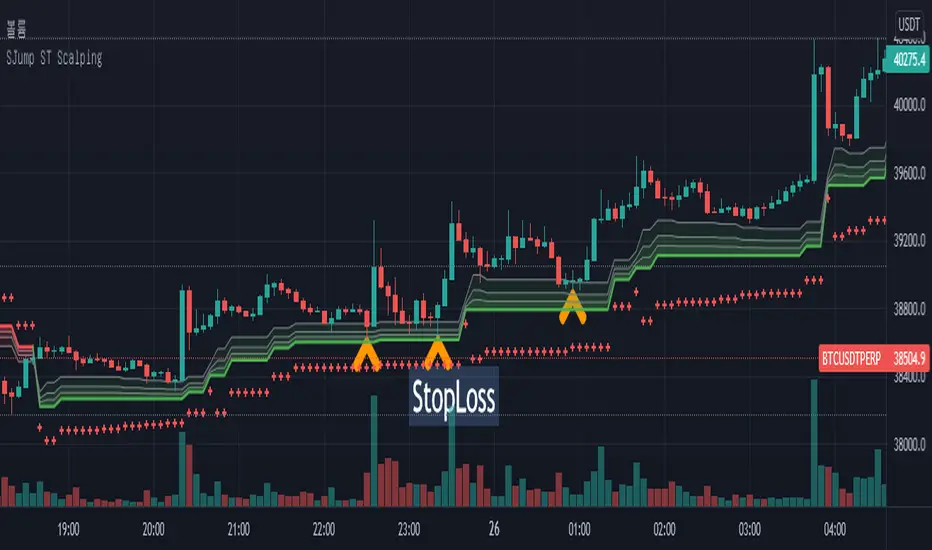
SuperJump HTF SuperTrend for ScalpingThis script can help you perform scalping using SuperTrend
First, set the HTF value higher than your current time frame.
As you know, the accuracy of the supertrend is very poor on the lower timeframe.
So I used higher timeframe(15 mins) supertrend more than current chart(5 mins)
crypto futures hourly scalping with ma & rsi - ogcheckershi to all lovable traders,
hereby i want to share a combination of trade ideas for scalping
i've chosen hourly timeframe
indicators used: moving averages and rsi
moving averages:
ema 3, ema 5, ema 7
sma 3, sma 5, sma 7
daily_ema_3, daily_ema_5
daily_ema_5, daily_sma_5
rsi:
rsi 7, rsi 14, rsi 26
daily_rsi_7, daily_rsi_14, daily_rsi_26
as per the analysis over moving average behavioral patterns & rsi movements, useful points are given below which will be helpful while choosing good entry points & exit points,
strategical points for LONG:
* when ema3 crosses above sma3 - green candles start to form
* it's followed by ema5 > sma5 and ema7 > sma7
* when ema3 crosses down sma3 - it's considered as an indication of exit
* if rsi supports then can wait for ema5 crossing down sma5
* as similar, when daily_ema_3 crosses above daily_sma_3, its an higher timeframe bullish indication, so the lower timeframe entries inside this higher timeframe is a sure shot confident entry
* for LONG always take entries when rsi_14 < 30 or 25 else check rsi_7 < 25 or below
* as along the above, bullish CANDLE patterns like bullish engulfing , morning star is been used for entry at lower levels
* so here i've used OPEN as rsi_source in majority
* exit points also indicated at high_rsi and moving average crossunders or reverse crossovers
* for SHORTING, the above said ideas can be used in viceversa
* inputs in the indicator were tailored for users needs so that you will enjoy the magics of customization
if i am wrong in anyways regarding the above indicator strategy, please forgive me and help me improve in this aspect by commenting.
after few more studies and analysis and mainly QUERIES & COMMENTS, i'm planning to backtest these strategies here in tradingview.
also if these strategies are coded in python, we can link it to Binance Futures Algo or Bot Trading.
thankyou for this opportunity,
thanks to tradingview and pinecoders
thanks to Pranab (for 365MA)
thanks to Gandalf (for inspiring)
Special Thanks & Love to Chartbank for Everything

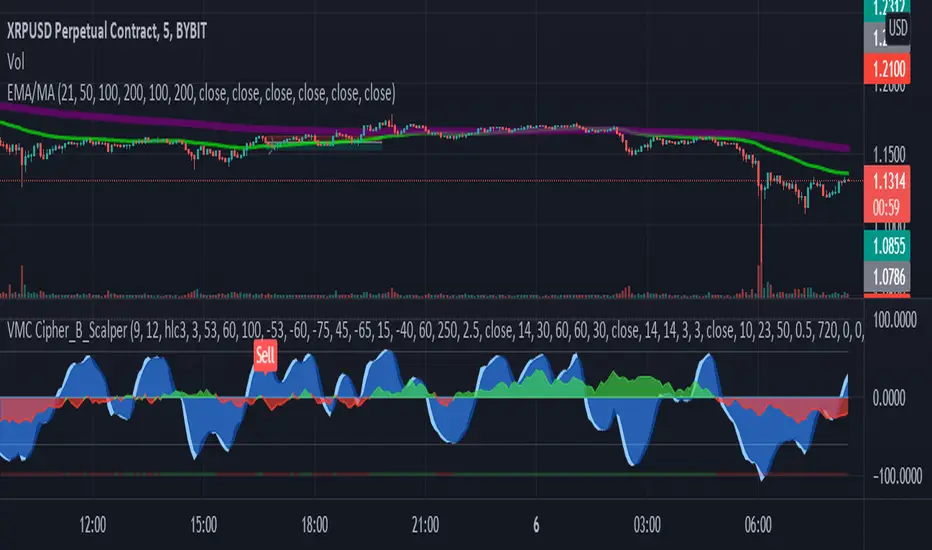
LA_Crpyto_Pirate Modifie VuManChu B Script with Scalping FiltersI added the following filters for entry signals to the VuManChu B with divergences for use as a scalping indicator. You will need to load the 50 EMA and this indicator to trade this per the rules below
The rules for trading this are as follows; You can only take a long or short entry when all of these requirements match
The wave cross is under the zero line (long) or over the zero line (short)
The money flow indicator is green (long) or red (short)
The closing price is above the 200 EMA (long) or below the 200 EMA (short)
price has pulled back to the 50 EMA
Here are the filters I employed in the script to help you trade this
Zero Line Filter: Only signal longs under the zero line and shorts over the zero line will fire off a signal
Money Flow Indicator Filter: Only signal longs when money flow is green and only shorts when money flow is red
200 MA filter: Only longs when price is closing above the 200 EMA and only shorts when price is closing below the 200 EMA
When you get an alert, simply check to see that price has pulled back to the 50 EMA before entering. Place long and short orders when the indicator signals and you confirm price has pulled back to the 50 ema before entering the long or short. Set your Stop Loss above or below the pervious pullback and set a reward ratio of your choice. Good luck!
Hermes Scalping Study by ZekisA simple scalping indicator, based on Highs and Lows.
It's working in any timeframe, the only condition is ... volatility .
Values are already set, but you can change them according to your preferences and to your chart.
Alerts are enabled.
Enjoy!
@ Zekis

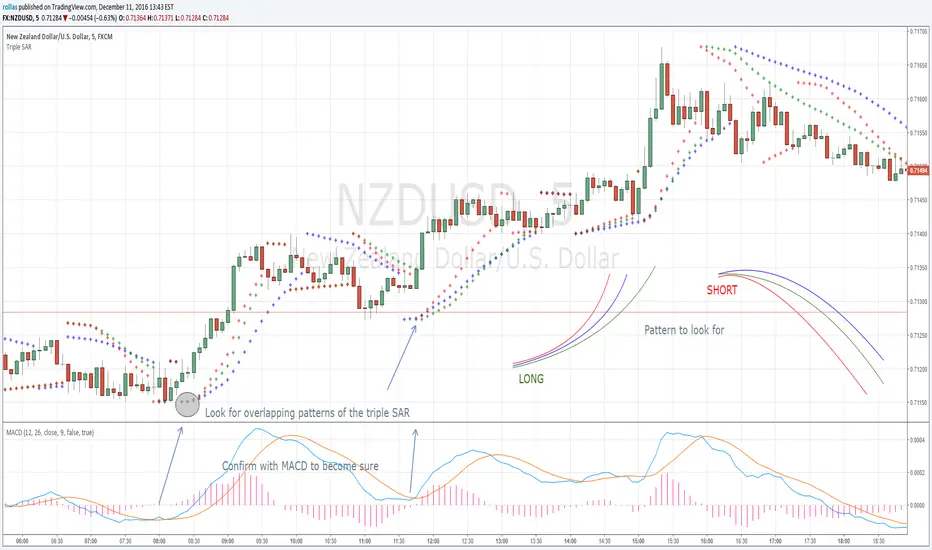
Triple SAR Scalping 5MTriple SAR scalping method must be used with a 5 minute chart. Look for the patterns that 3 bands overlap. Close deal within 4-5 pip profit or build your own style after getting comfortable with this technique and share your approach with us for maybe higher profits.
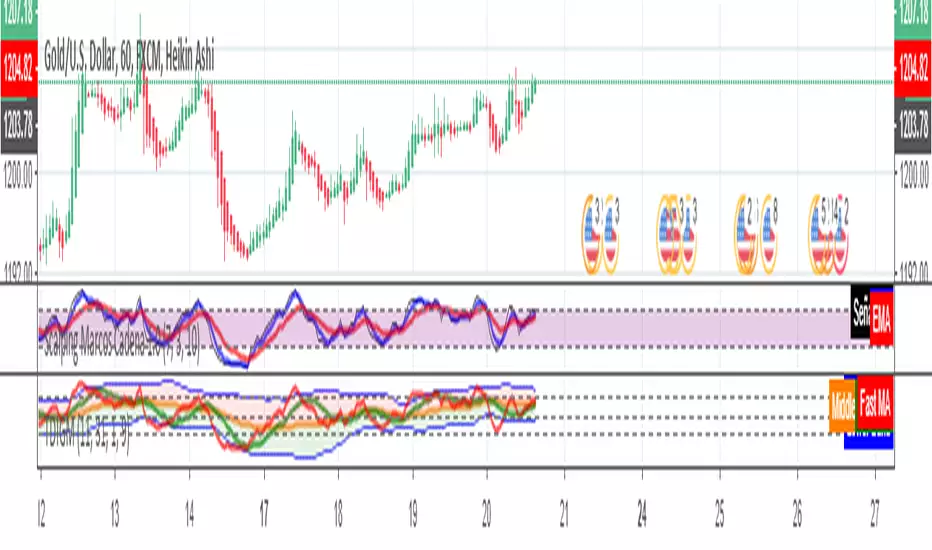
Scalping Marcos Cadena 1.0Scalping Marcos Cadena Crossing of moving averages together identifying within the RSI when it is overbought or oversold
scalping2sahilnarkarThis is the a bit edited to the previous script. As per regulations i have kept this as an open script.
The only Difference to confirm your support resistance levels is an addition of simple moving average 21.
Rules are the Same-
- Trade long when above vwap and 21EMA
- Trade Short when below the VWAP.
EMA21 and EMA50 acts as support where as SMA 21 will show the Trend.
Even though This script is purely based on EMA's, i tend to find the SMA21 as a good Support resistance/support while taking a trade as it avoids the wipsaws while taking an entry.
Please Note-
-This is a scalping Script so book profits and keep stoplosses accordingly.
-When you put this script on the screen, remove everything except EMA9,EMA21,EMA50,EMA200 and the SMA21(keep the arrows and edit the arrows as you want)
-This is not a plug and play script so tune it as you want on the settings.
-Please consider using a VWAP always.
-I have made this script after putting it into many indian stocks you have to tune it as per your stock exchange.
Trench Cross ScalperThe original script was posted on ProRealCode by user Nicolas.
This indicator is an attempt of scalping strategy by crossing the mean high or low weigthed price over a short "n" period. This 2 lines represent the black "trench" on screenshots attached.
When signal line (blue one) crossing the buy trigger one (dotted green one) a buy signal should occur and vice-versa for a sell signal (when crossing the dotted red one). I add an option to draw the white signal line as the close price value of the high/low ones if they are respectively above or below the trench' buy or sell lines trigger.
The yellow green and red brick lines serve as stoploss.
The indicator can be use alone with no price chart as its values are derivated from it, of course if you dont mind about candlesticks informations.
I think enter/exit trades should occur very quickly, as it were designed for scalping trading purpose. I didn't have much time to test it for a long period, so here it is as a concept indicator, despite that, it does have sense.

Scalping Candle [Crak x MMT]The Scalping Candle is a TradingView indicator designed for scalping strategies, identifying potential bullish and bearish engulfing patterns on price charts. It overlays directly on the chart and marks specific candle patterns with visual signals, helping traders spot short-term trading opportunities. The indicator includes a customizable bias filter to focus on bullish, bearish, or neutral market conditions.
Features
Overlay Indicator : Displays bullish and bearish signals directly on the price chart.
Bias Filter : Allows users to select a market bias ('Bullish', 'Bearish', or 'Neutral') to filter signals based on their trading preference.
Visual Signals : Plots green upward triangles below bullish candles and red downward triangles above bearish candles.
Alerts : Generates alerts for bullish and bearish engulfing patterns, enabling timely notifications for trade setups.
How It Works
The indicator analyzes the relationship between the current and previous candles to detect engulfing patterns:
Bullish Engulfing : Triggered when the current candle's low is at or below the previous candle's low, and its close is at or above the previous candle's midpoint. This signal is displayed only if the bias filter is set to 'Neutral' or 'Bullish'.
Bearish Engulfing : Triggered when the current candle's high is at or above the previous candle's high, and its close is at or below the previous candle's midpoint. This signal is displayed only if the bias filter is set to 'Neutral' or 'Bearish'.
The previous candle's midpoint is calculated as the average of its high and low prices.
Usage
- Add to Chart : Apply the indicator to any TradingView chart.
- Configure Bias Filter :
Neutral : Displays both bullish and bearish signals.
Bullish : Displays only bullish signals.
Bearish : Displays only bearish signals.
- Interpret Signals :
Green upward triangle below a candle indicates a potential bullish reversal.
Red downward triangle above a candle indicates a potential bearish reversal.
- Set Alerts : Use the built-in alert conditions to receive notifications when bullish or bearish engulfing patterns are detected.
Settings
Bias Filter : Choose between 'Neutral', 'Bullish', or 'Bearish' to control which signals are displayed.
Shape Size : Signals are plotted as small triangles for minimal chart clutter.
Alert Conditions : Enable alerts for 'Bullish Engulfing Detected' or 'Bearish Engulfing Detected' to stay informed of new signals.
Ideal Use Case
This indicator is tailored for scalpers and short-term traders looking to capitalize on quick price movements driven by engulfing candle patterns. It works best on 15-minute chart and can be combined with other technical tools for confirmation.

Scalping Swing Trading Tool R1-4 by JustUncleLDescription:
This study project is a "Scalping Swing trading Tool" and is an alternative to the "Scalping Pullback Tool R1". It is designed for a two pane TradingView chart layout :
the first pane set to 15min Time Frame;
the second pane set to 1min Time Frame(TF).
The tools incorporates the majority of the indicators needed to analyse and scalp Trends for Swings, PullBacks and reversals on 15min charts and 1min charts.
Incorporated within this tool are the following indicators:
1. The following EMAs are drawn automatically:
Green = EMA89 (15min TF) = EMA75 (1min TF)
Blue = EMA200 (15min TF) = EMA180 (1min TF)
Black = EMA633 (15min TF) = EMA540 (1min TF)
2. The 10EMA (default) High/Low+Close Price Action Channel (PAC), the PAC channel
display is disabled by default.
3. Optionally display Fractals and optional Fractal levels
4. Optional HH, LH, LL, HL finder.
5. Coloured coded Bar high lighting based on the PAC:
blue = bar closed above PAC
red = bar closed below PAC
gray = bar closed inside PAC
lime Line = EMA10 of bar close
6. Pivot points (disables Fractals automatically when selected) with optional labels.
7. EMA5-12 Channel is displayed by default.
8. EMA12-36 Ribbon is displayed by default
9. Optionally display EMA36 and PAC instead of EMA12-36 Ribbon.
Set up and hints:
I am unable to provide a full description here, as Pullback Trading incorporates a full trading Methodology, there are a number of articles and books written on the subject.
Set to two pane TradingView chart, set first pane to 15Min and second to 1min.
Set the chart to Heikin Ashi Candles (optional).
I also add a "Sweetspot Gold2" indicator to the chart as well to help with support and resistance finding and shows where the important "00" lines are.
Use the EMA200 on the 15min pane as the anchor. So when prices above EMA200 we only trade long (buy) and when prices below the EMA200 we only trade short (sell).
On the 15min chart draw any obvious Vertical Trend Lines (VTL), use Pivots point as a guide.
On the 15min chart what we’re looking for price to Pullback into the EMA5-12 Channel or EMA12-36 ribbon, we draw Trendlines uitilising the Pivot points or Fractals to guide your TL drawing.
On the 15min chart look for the trend to resume and break through the drawn TL. The bar color needs to change back to the trend direction colour to confirm as a break.
Now this break can be traded as a 15min trade or now look to the 1min chart.
On the 1min chart draw any Pullback into any of the EMAs.
On the 1min chart look for the trend to resume and break through the drawn TL. The bar color needs to change back to the trend direction colour to confirm as a break.
Now this break can be traded as a 1min trade.
There is also an option to select Pristine (ie Ideal) filtered Fractals, which look like tents or V shape 5-candle patterns. These are actually used to calculate the Pivot points as well.
Other than the "SweetSpot Gold2" indicator, you should not need any other indicator to successfully trade trends for Pullbacks and reversals. If you really want another indicator use the AO (Awesome Oscillator) as it is momentum based.

Scalping EMA9/15 This indicator is designed for high-accuracy intraday scalping based on a refined version of the popular EMA9–EMA15 trend-following technique.
It filters weak or premature entries by requiring a retest of the EMA zone before generating a Buy/Sell signal — drastically reducing false breakouts.

Scalping, Swing Pro: Urban Towers + Bollinger(0.5)+ WMA by KidevThis indicator combines narrow Bollinger Bands (σ = 0.5) with a Weighted Moving Average (WMA-96) to provide traders with a reliable framework for identifying both short-term scalps and medium-term swing setups.
Bollinger Bands (0.5σ):
Traditional Bollinger Bands at 2σ cover ~95% of price movement, while 0.5σ bands narrow the focus to ~50% of price activity. This tighter structure makes them ideal for detecting volatility contractions, consolidations, and early breakout signals.
WMA-96 as Trend Reference:
The 96-period WMA acts as a slower, more stable directional guide. Unlike shorter WMAs, this longer setting filters noise and serves as a reference line for the dominant trend. Traders can use it as an anchor for intraday or swing positions.
Scalping & Swing Benefits:
Price holding above the WMA-96 while staying near the upper 0.5σ band often signals strength.
Contractions (squeezes) in the 0.5σ band followed by expansion frequently mark breakout zones.
Pullbacks toward the WMA-96 combined with band signals can act as re-entry or risk-defined trade areas.
This script provides a balanced view of momentum and stability — the 0.5σ bands reveal short-term volatility shifts, while the WMA-96 grounds the trader in the prevailing trend.

Scalping Indicator v6This Script Show You Recent Scalping Trades u can get instantly we have use the knowledge we gain across the time we might be right or wrong do your own research and use this indicator on ur own risk

Scalping Strategy (5min)This indicator is designed for scalping strategies on a 5-minute timeframe. It generates signals based on two RSI crossovers and incorporates moving averages to identify trends. Additionally, a Bollinger Band is included to eliminate the need for an additional Bollinger Band on the chart.
Please note that this indicator does not guarantee 100% accurate signals and may produce false signals. It is recommended to use this indicator in conjunction with other indicators such as Stochastic, MACD, SuperTrend, or any other suitable indicators to enhance the accuracy of trading decisions.
1) Signal Generation: The indicator generates buy and sell signals based on two RSI crossovers. A buy signal is generated when the fast RSI crosses above the slow RSI, indicating potential bullish momentum. Conversely, a sell signal is generated when the fast RSI crosses below the slow RSI, suggesting potential bearish momentum.
2) To adjust the indicator to your specific chart and trading preferences, you have the flexibility to modify the RSI and moving average (MA) values. By changing the RSI values (slow RSI length and fast RSI length), you can fine-tune the sensitivity of the RSI crossovers to suit different timeframes and market conditions. Similarly, adjusting the MA values (slow MA period and fast MA period) allows you to adapt the indicator to the desired trend identification and short-term trend confirmation.
3) Pay attention to trades that are confirmed by the short-term moving average (MA) aligning with the desired direction. For buy signals, ensure that the short MA is tending upward, indicating a potential uptrend. For sell signals, confirm that the short MA is trending downward, suggesting a potential downtrend.
4) Moving Averages: The indicator uses a 200-period moving average (MA) to identify the overall trend and a short-term MA for additional confirmation.
5) Bollinger Band: The included Bollinger Band is not directly used in the indicator's calculations. However, it is provided for convenience so that users don't need to add another Bollinger Band to their chart separately.
6) Exercise caution when the short MA is below the 200-period MA but showing signs of attempting an upward move. These situations may indicate a potential reversal or consolidation, and it is advisable to avoid taking trades solely based on the 200-period MA crossover in such cases.
Remember that these guidelines are intended to provide additional insights and should be used in combination with your trading judgment and analysis.

Scalping Line Indicator"A derivated indicator of the stair step moving average exploration. This time, the stairstep MA (the main trend) represent the center of the oscillator.
The signal line (maroon line) is the difference between this center and a simple moving average of 7 periods by default.
Trade signals seems pretty effective on tick charts representation. Take long when signal line cross above zero and short below it. Of course, as always objectives and stoploss protection are your responsabilities
You can play with different parameters to sweet any other instruments."
Coded referring the"Scalping Line Indicator" from prorealcode for Tradingview users after one of my followers asked me to do so.

Scalping with triple EMAUsing EMA5 (Exponential Moving Average) as the main trend of price, the intersection with EMA10 will signal the point of entry (go long, go short) reasonable. At this point, I pushed the EMA10 at high price to sell sooner and at low price to buy early. More specific:
- When the red line crosses the blue line, the signal is the Buy.
- When the red line cut the green line, the signal is Sell.
Efficient with short trading tactics.
Notes: Combined with pinbar signs and practal indicators will yield better results
Pro Scalper AI [BullByte]The Pro Scalper AI is a powerful, multi-faceted scalping indicator designed to assist active traders in identifying short-term trading opportunities with precision. By combining trend analysis, momentum indicators, dynamic weighting, and optional AI forecasting, this tool provides both immediate and latched trading signals based on confirmed (closed bar) data—helping to avoid repainting issues. Its flexible design includes customizable filters such as a higher timeframe trend filter, and adjustable settings for ADX, ATR, and Hull Moving Average (HMA), giving traders the ability to fine-tune the strategy to different markets and timeframes.
Key Features :
- Confirmed Data Processing :
Utilizes a helper function to lock in price and volume data only from confirmed (closed) bars, ensuring the reliability of signals without the risk of intrabar repainting.
- Trend Analysis :
Employs ADX and Directional Movement (DI) calculations along with a locally computed HMA to detect short-term trends. An optional higher timeframe trend filter can further refine the analysis.
- Flexible Momentum Modes :
Choose between three momentum calculation methods—Stochastic RSI, Fisher RSI, or Williams %R—to match your preferred style of analysis. This versatility allows you to optimize the indicator for different market conditions.
- Dynamic Weighting & Volatility Adjustments :
Adjusts the contribution of trend, momentum, volatility, and volume through dynamic weighting. This ensures that the indicator responds appropriately to varying market conditions by scaling its sensitivity with user-defined maximum factors.
- Optional AI Forecast :
For those who want an extra edge, the built-in AI forecasting module uses linear regression to predict future price moves and adjusts oscillator thresholds accordingly. This feature can be toggled on or off, with smoothing options available for more stable output.
- Latching Mode for Signal Persistenc e:
The script features a latching mechanism that holds signals until a clear reversal is detected, preventing whipsaws and providing more reliable trade entries and exits.
- Comprehensive Visualizations & Dashboard :
- Composite Oscillator & Dynamic Thresholds : The oscillator is plotted with dynamic upper and lower thresholds, and the area between them is filled with a color that reflects the active trading signal (e.g., Strong Buy, Early Sell).
- Signal Markers : Both immediate (non-latching) and stored (latched) signals are marked on the chart with distinct shapes (circles, crosses, triangles, and diamonds) to differentiate between signal types.
- Real-Time Dashboard : A customizable dashboard table displays key metrics including ADX, oscillator value, chosen momentum mode, HMA trend, higher timeframe trend, volume factor, AI bias (if enabled), and more, allowing traders to quickly assess market conditions at a glance.
How to Use :
1. S ignal Interpretation :
- Immediate Signals : For traders who prefer quick entries, the indicator displays immediate signals such as “Strong Buy” or “Early Sell” based on the current market snapshot.
- Latched Signals : When latching is enabled, the indicator holds a signal state until a clear reversal is confirmed, offering sustained trade setups.
2. Trend Confirmation :
- Use the HMA trend indicator and the optional higher timeframe trend filter to confirm the prevailing market direction before acting on signals.
3. Dynamic Thresholds & AI Forecasting :
- Monitor the dynamically adjusted oscillator thresholds and, if enabled, the AI bias to gauge potential shifts in market momentum.
4. Risk Management :
- Combine these signals with additional analysis and sound risk management practices to determine optimal entry and exit points for scalping trades.
Disclaimer :
This script is provided for educational and informational purposes only and does not constitute financial advice. Trading involves risk, and past performance is not indicative of future results. Always perform your own analysis and use proper risk management strategies before trading.

Dynamic Buy/Sell VisualizationDynamic Trend Visualization Indicator
Description:
This simple and easy to use indicator has helped me stay in trades longer.
This indicator is designed to visually represent potential buy and sell signals based on the crossover of two Simple Moving Averages (SMA). It's crafted to assist traders in identifying trend directions in a straightforward manner, making it an excellent tool for both beginners and experienced traders.
Features:
Customizable Moving Averages: Users can adjust the period length for both short-term (default: 10) and long-term (default: 50) SMAs to suit their trading strategy.
Visual Signals: Dynamic lines appear at the points of SMA crossover, with labels to indicate 'BUY' or 'SELL' opportunities.
Color and Style Customization: Customize the appearance of the buy and sell lines for better chart readability.
Alert Functionality: Alerts are set up to notify users when a crossover indicating a buy or sell condition occurs.
How It Works:
A 'BUY' signal is generated when the short-term SMA crosses above the long-term SMA, suggesting an upward trend.
A 'SELL' signal is indicated when the short-term SMA crosses below the long-term SMA, pointing to a potential downward trend.
Use Cases:
Trend Following: Ideal for markets with clear trends. For example, if trading EUR/USD on a daily chart, setting the short SMA to 10 days and the long SMA to 50 days might help in capturing longer-term trends.
Scalping: In a volatile market, setting shorter periods (e.g., 5 for short SMA and 20 for long SMA) might catch quicker trend changes, suitable for scalping.
Examples of how to use
* Short-term for Quick Trades:
SMA 5 and SMA 21:
Purpose: This combination is tailored for day traders or those looking to engage in scalping. The 5 SMA will react rapidly to price changes, providing early signals for buy or sell opportunities. The 21 SMA, being a Fibonacci number, offers a slightly longer-term view to confirm the short-term trend, helping to filter out minor fluctuations that might lead to false signals.
* Middle-term for Swing Trading:
SMA 10 and SMA 50:
Purpose: Suited for swing traders who aim to capitalize on medium-term trends. The 10 SMA picks up on immediate market movements, while the 50 SMA gives insight into the medium-term direction. This setup helps in identifying when a short-term trend aligns with a longer-term trend, providing a good balance for trades that might last several days to a couple of weeks.
* Long-term Trading:
SMA 50 and SMA 200:
Purpose: Investors focusing on long-term trends would benefit from this pair. The crossover of the 50 SMA over the 200 SMA can indicate the beginning or end of major market trends, ideal for making decisions about long-term holdings that might span months or years.
Example Strategy if not using the Buy / Sell Label Alerts:
Entry Signal: Enter a long position when the shorter SMA crosses above the longer SMA. For example:
SMA 10 crosses above SMA 50 for a medium-term bullish signal.
Exit Signal: Consider exiting or initiating a short position when:
SMA 10 crosses below SMA 50, suggesting a bearish turn in the medium-term trend.
Confirmation: Use these crossovers in conjunction with other indicators like volume or momentum indicators for better confirmation. For instance, if you're using the 5/21 combination, look for volume spikes on crossovers to confirm the move's strength.
When Not to Use:
Sideways or Range-Bound Markets: The indicator might generate many false signals in a non-trending market, leading to potential losses.
High Volatility Without Clear Trends: Rapid price movements without a consistent direction can result in misleading crossovers.
As a Standalone Tool: It should not be used in isolation. Combining with other indicators like RSI or MACD for confirmation can enhance trading decisions.
Practical Example:
Buy Signal: If you're watching Apple Inc. (AAPL) on a weekly chart, a crossover where the 10-week SMA moves above the 50-week SMA could suggest a buying opportunity, especially if confirmed by volume increase or other technical indicators.
Sell Signal: Conversely, if the 10-week SMA dips below the 50-week SMA, it might be time to consider selling, particularly if other bearish signals are present.
Conclusion:
The "Dynamic Trend Visualization" indicator provides a visual aid for trend-following strategies, offering customization and alert features to streamline the trading process. However, it's crucial to use this in conjunction with other analysis methods to mitigate the risks of false signals or market anomalies.
Legal Disclaimer:
This indicator is for educational purposes only. It does not guarantee profits or provide investment advice. Trading involves risk; please conduct thorough or consult with a financial advisor. The creator is not responsible for any losses incurred. By using this indicator, you agree to these terms.

Scalper's toolkit - ATR WidgetWidget specifically designed for scalping. Many settings to fit the instrument and view preferences to make it fit into your chart window how you like, even on mobile.
** I have 5 other features to add into this in the very near future, as I use this as my primary tool for Risk reward. This script will be updated in the near future as more features are coded into it. See bottom for notes on plans
Features:
Displays a quick view of the ATR value on the chart, in decimal PIPs or directly in Points - a key value for scalping using the DOM for point value settings and one click trading on fast time frames.
Automatic calculation of stop and target distance for a predetermined Risk Reward Ratio (Set with the settings panel), and then also displayed in PIPs or Points for easy use in quick trading.
Works on most all instruments/pairs/cryptos with multiple precision levels for correct values to be shown in the widget.
Fully customizable -
ATR period Base setting, just like a normal ATR indicator
Display in : PIPs or Points
ATR based stop distance, using a multiplier. 2 is the most common multiplier used, and the default setting.
Risk Reward Calculation using the Stop Loss value.
-Quickly helps with proper target and stop sizing for the volatility in the price on the current trade entry point.
-Set to any ratio you wish, from 1:0.1 all the way to 1:100 or more, unlimited R ratio settings to fit your strategy and risk tolerances.
Position anywhere on the chart window with 9 preset locations available (Pine script limitation)
Show as a column layout or a row layout
Customize the Size, with 5 preset widget sizes, from tiny to huge (Pine script limitation)
-Mobile Friendly - Tiny or Small may be too small on PC, but can be used for Mobile so the widget does not become too large over the chart.
Custom text, background, and boarder colors
Custom Boarder Size - 0 size is no boarder
Set up:
-Open the settings panel.
First section is the basic settings for the ATR - the length (Default is 14) and to use a PIP value display, or Point value display.
Here you also see a "Precision" Setting. **Because each instrument returns different precision ATR values, it is difficult to determine with code what those values will be ahead of time to do the math in the background. Even some 2 decimal instruments return 5 decimal ATR values, so this setting filters that** Just use the dropdown and choose how many decimal places the instrument has from 2 - 5 decimals
The second section is for risk and reward calculations, and can be disabled if you do not want to see these values.
The first value is the "ATR Multiplier" Typically, a 2x multiplier is used on the ATR to determine how far away to place your stop loss from the entry, placing it out of harm's way from normal market activity.
The second value is the Reward target distance, based from the stop loss size. This quickly calculates your target to match your intended reward ratio, saving some manual work to calculate this by hand every trade.
** Note: because of the math used in the code, you may see odd values on some instruments, like indexes. If you have the precision correct, try changing the "Show in Pips" to "Show in Points", as this may solve the issue.
The last two sections are purely for how the widget looks and how/where it shows on the screen. These can be set however you like. To have no boarder, just set the "Frame size" value to 0.
Additional Updates planned:
Pip value calculation (2 feature uses)
-This will serve 2 purposes. The widget will calculate the value of the trade based on the lot size. It will also have a risk limit, so if the ATR get's too high for the current risk settings, It will show red to warn you of a high risk situation before you trade.
Example, you have a set limit of 3 dollars per trade using .02 lot sizing. If the ATR get's too high, The Stop value will be more risk than you would like to use at that trade sizing. Reduce the trade size, or wait for ATR to come lower.
Purpose 2: lot size calculation, so if you wanted to maximize the use of risk available. If you wanted to risk 600 for example, it would use the ATR you have set for the risk, and determine the proper lot size for the amount of volatility in the market. This way, you Risk Exactly, or as close as possible to 600 for the the current trade conditions.
Extra use for this value: Show the Current trade amounts at risk and for gain in money values on the side of the pip/point value. Know what you're risking and also trading for in monetary value.
ATR candle Comparison- Early momentum Detection (2 feature uses)
Will show an additional section on the bottom of the widget to show how each candle compares to the one before, up to the last 5, and show if ATR went down, up, or stayed the same over the last 5 candles.
Show an additional symbol to indicate the current candle status in comparison to the close of the last candle. Real time of if the ATR is getting larger, smaller, or staying the same.

LNL Scalper ArrowsLNL Scalper Arrows
The indicator consist of various different types of candlestick patterns that are truly time tested by multiple veteran traders. These arrows are a combination of short-term scalping strategies taught by Linda Raschke & a trader that goes by name Quant Trade Edge. These strategies/patterns occur regularly within the markets. They offer high probability quick moves during the trending days. These four patterns are based on pure price action, no oscillators, no trend, no momentum indicators involved. Trend (ema) is there just as a simple trend gauge.
LNL Scalper Arrows were designed specifically for intra-day trading. Mostly useful for the futures but also stocks as well. These arrows can work anywhere between the fast-moving 512 or 1600 tick charts to a 1min, 2min and up to 5min or 10min charts.
Trend Gauge (Exponential Moving Average)
Nothing fancy just a classic EMA that can guide the direction of the short-term trend. I have added a custom coloring of the EMA that is based on a simple RSI filter. That should help to visualize the non-directional moments within the trend. Although the length is adjustable, for scalping it is better to focus on smaller periods such as 9, 13 or 20 or 34 but anything above 50 loses its purpose as a short-term trend gauge. Again, this is a scalping tool not a trend tool, you are not going to get rid of the fakeouts by increasing the period of the trend.
Tail Arrows (Eat the Tail Pattern)
Tail is a candlestick that is either a price rejection spike, or a flag continuation pattern on a lower time frame. A failed action. It is basically a candle with much bigger wick (shadow) of the candle than the actual body. Such candles are usually telling us about strong participation from the other side of the market. Eat the tail pattern occurs whenever the low of the Tail candle is immediately broken on a following candle "the tail is eaten alive". Such a breaks occurs in a most aggressive types of markets with a strong momentum. DO NOT try to trade this in a low volume or a ranging market. Tail Arrows are the most aggressive arrows & should be only used on the highest volume or a parabolic momentum markets.
Scalp Arrows (Scallop Pattern)
Known as Scallops or minor lows or highs, these patterns are the most common within the all scalper arrows. They occur regularly on 1min & 5min charts - basically everyday. Scallops provide the best possible risk to reward entry within the trend without the need of any indicators or oscillators. The Scallop Up 3 bar pattern consist of a high that is lower that the previous high but also low that is lower than the previous low. Scallop Up or a minor low triggers when the last high is broken, creating a three bar mountain or a peak within the 5 bar span.
Hoagie Arrows (Hoagie Pattern)
Hoagies occur way less often than any other scalping patterns. Hoagies represent two (or more) inside candles within the shadow of a first candle. Such a formation is creating a small compression or a range that sooner or later breaks out. The hoagie is triggered whenever the high or low of the shadow (first) candle is broken. The great thing about the hoagies is that they can work either way despite the trend direction. Although this indicator is coded for the 2 bar hoagies, there are no limitations on how much inside bars can hoagie include.
Umbrella Arrows (Umbrella Pattern)
Another really awesome 3 bar pattern that is really fun to trade. Umbrella occurs when the candle before the previous candle is a pin bar or a tail bar and the body of the previous candle is within the shadow or a wick of the candle before. The umbrella is triggered once the high or low of the previous bar is broken. Umbrellas are more frequent than Hoagies but occur much less than the Scallops.
Outside Bar Wedges (Outside Bar Pattern)
Pretty much self-explanatory candlestick pattern. Outside Bar is basically any bar that peaks outside of the both ends of the previous candle. So the range of the candle is higher & it looked beyond the high and beyond the low of the previous candle. These candles are signalizing the potenial momentum change. Ouside Bars usually occur at the tops or bottoms of the moves. I decided to add them because they can serve as a great addition to these scalping patterns.
Signal vs. SignalBreak Mode
The trigger can be viewed in two different ways:
1. Signal: Plots the trigger before the trigger bar, basically right when the pattern is formed but NOT YET triggered. The signal is triggered once the next candle break the high or low of the current candle.
2. SignalBrake: Plots the trigger after the break of the high or low of the actual pattern. It is basically a candle after the signal candle. (Signal is better for trading because it gives you time to prepare for the actual break of the high or low = the actual signal. SignalBrake is great for looking back in history only for the patterns that actually traded).
Pin Bar BTW Ratio
Pin Bar (Body-To-Wick) Ratio represents the size of the body of a pin bar candle for Eat the Tail and Umbrella patterns. Pin Bar BTW Ratio measures the ratio between the wick & the body of the candle. Ref. interval is 2.0 - 5.0 (ideal pin bar is 2.0 - 3.0 = the wick or a shadow is 2x - 3x bigger than the body of the candle)
ATR Stop & Target Labels
I also created three simple labels (tables) that can show you the ideal target & stop as well as the current ATR. Since LNL Scalper Arrows consist of high probability scalping patterns, a good rule of thumb to follow is to use a half of the current ATR as a target and a current ATR as a stop (or two times the target). So if the current 7 period ATR is 30 the target would be 15 pts. and a stop around 30 pts. With such a risk management you should aim for a win rate 70% or higher. Obviously you can adjust the risk management in the settings to your personal preference.
Low Range vs. High Range Markets
There are two major downsides with the Scalper Arrows:
1. You need volume and a volatility. These patterns really do struggle in ranging "boring" sideways action. It is absolutely crucial to recognize the current market environment and really stay cautions and (or completely out) in case the chop continues. Adding something like DMI can help you recognize the potential flat markets.
2. Not only do you need volume & momentum, you also need a decent range. This indicator works better on a rangy market such as NQ futures or YM. But are much tougher to trade on lower range markets such as some stocks or ZB futures or basically any other lower range market.
Hope it helps.
