Joel on Crypto - MACD ScalpingJoel on Crypto - MACD Scalping
This is a Scalping indicator primarily intended for the 5 minute time frame.
It is based on the Crypto Scalping YouTuber Joel on Crypto's popular 5 minute scalping strategy and this is the indicator he personally use when Scalping.
This is a Multi-timeframe indicator where if you use it on the 5 minute time frame, the MACD Histogram bars will be based on the 1 minute timeframe.
The purpose of this indicator is not to trade it like a bot. The purpose is to grab the traders attention a time where there COULD be a scalping opportunity.
Use this indicator at your own risk.
Pesquisar nos scripts por "scalping"

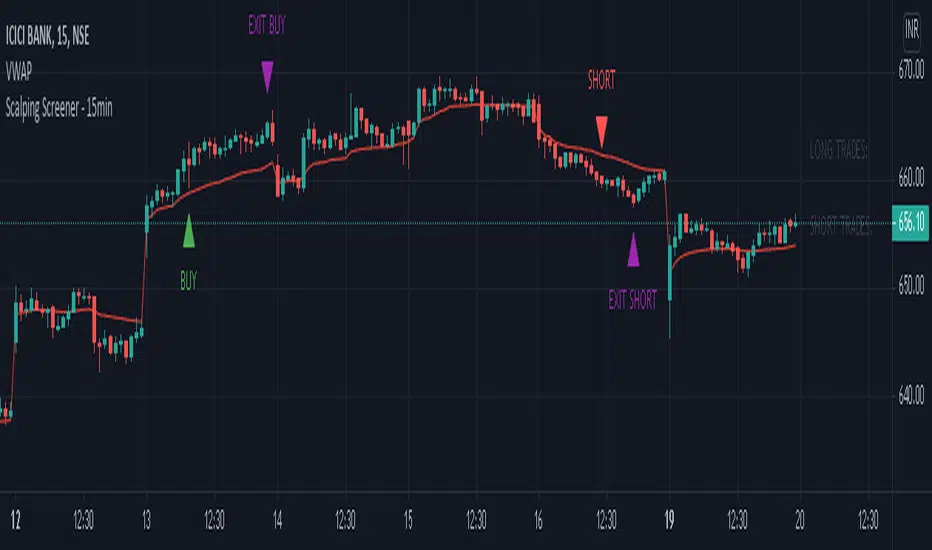
Scalping Screener - 15minSCALPING SCREENER - 15 mins (Indicator Tool)
TIME FRAME to use - 15 mins
DURATION OF TRADE - Using this indicator, Trade must be taken only during market hours and must be closed before market close (must not be carried forrward for next day).
SCALPING - This is a scalping strategy that is intended to make small profits in intraday trading
ENTRY CONCEPT -
- There must be 2 bulish candles and the 2nd candle's high should be greater than first candle's high.
- And If the latest candle high breaks high of the 2nd candle (prev candle), BUY signal is generated.
- Additional filters are added to reduce non-performaing trades.
- visa versa for SHORT signal
EXIT CONCEPT -
- 2nd candles low is the stop loss.
- Difference between 2nd candle high and 2nd candle low is target.
- The script will indicate when to BUY / SHORT and when to EXIT the trade.
INSTRUMENTS TO TRADE -
- High volatility instruments are best to be traded
- Nifty 50 stocks have been added to this indicator for the sake of screener. User can change these stocks with high volatility ones
- There is a limitation to add upto 40 scripts.
SCREENER FUNCTION -
- Right side of the chart has screener section which shows the list of stocks that qualify as per the BUY / SELL signal
NOTE -
The purpose of the scipt is for self learning / improvement and analysis.
Trading is a risky business and a trader must take any trade at their own RISK.
The author shall not be held responsible for Losses / Profits
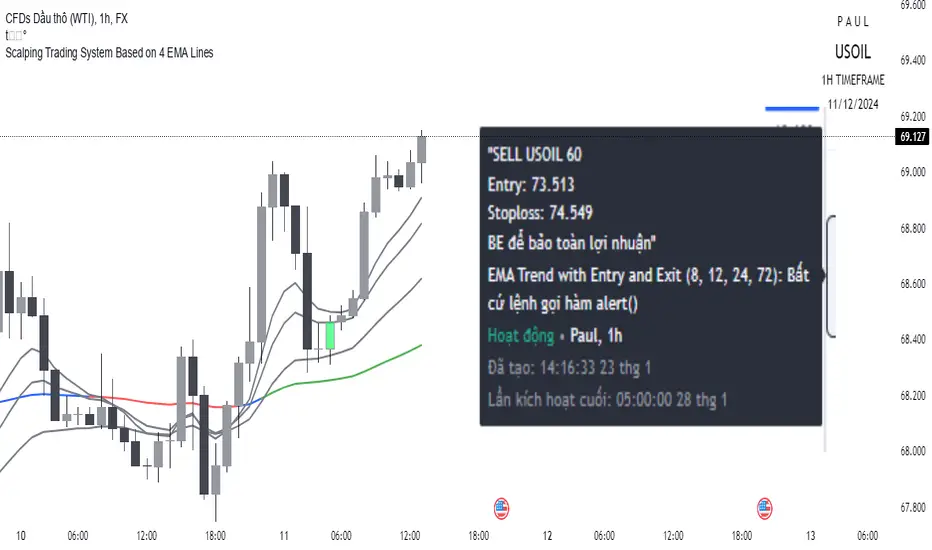
Scalping trading system based on 4 ema linesScalping Trading System Based on 4 EMA Lines
Overview:
This is a scalping trading strategy built on signals from 4 EMA moving averages: EMA(8), EMA(12), EMA(24) and EMA(72).
Conditions:
- Time frame: H1 (1 hour).
- Trading assets: Applicable to major currency pairs with high volatility
- Risk management: Use a maximum of 1-2% of capital for each transaction. The order holding time can be from a few hours to a few days, depending on the price fluctuation amplitude.
Trading rules:
Determine the main trend:
Uptrend: EMA(8), EMA(12) and EMA(24) are above EMA(72).
Downtrend: EMA(8), EMA(12) and EMA(24) are below EMA(72).
Trade in the direction of the main trend** (buy in an uptrend and sell in a downtrend).
Entry conditions:
- Only trade in a clearly trending market.
Uptrend:
- Wait for the price to correct to the EMA(24).
- Enter a buy order when the price closes above the EMA(24).
- Place a stop loss below the bottom of the EMA(24) candle that has just been swept.
Downtrend:
- Wait for the price to correct to the EMA(24).
- Enter a sell order when the price closes below the EMA(24).
- Place a stop loss above the top of the EMA(24) candle that has just been swept.
Take profit and order management:
- Take profit when the price moves 20 to 40 pips in the direction of the trade.
Use Trailing Stop to optimize profits instead of setting a fixed Take Profit.
Note:
- Do not trade within 30 minutes before and after the announcement of important economic news, as the price may fluctuate abnormally.
Additional filters:
To increase the success rate and reduce noise, this strategy uses additional conditions:
1. The price is calculated only when the candle closes (no repaint).
2. When sweeping through EMA(24), the price needs to close above EMA(24).
3. The closing price must be higher than 50% of the candle's length.
4. **The bottom of the candle sweeping through EMA(24) must be lower than the bottom of the previous candle (liquidity sweep).
---
Alert function:
When the EMA(24) sweep conditions are met, the system will trigger an alert if you have set it up.
- Entry point: The closing price of the candle sweeping through EMA(24).
- Stop Loss:
- Buy Order: Place at the bottom of the sweep candle.
- Sell Order: Place at the top of the sweep candle.
---
Note:
This strategy is designed to help traders identify profitable trading opportunities based on trends. However, no strategy is 100% guaranteed to be successful. Please test it thoroughly on a demo account before using it.
Scalping The BullNome: Scalping The Bull (Indicatore)
Categoria: Scalping, Trend Following, Mean Reversion.
Timeframe: 1M, 5M, 30M, 1D, secondo la conformazione specifica.
(follow description in english)
Analisi tecnica: l’indicatore supporta le operatività descritte nei video di YouTube del canale “Scalping The Bull”. Di norma si basa su price action e medie mobili esponenziali.
Le varie tecniche che possono essere usate insieme all’indicatore sono sintetizzate nei settaggi dell’indicatore e si può fare riferimento ai video specifici per la spiegazione completa.
Utilizzo consigliato: Altcoin che presentano forti trend per scalping e operazioni intra-day.
Configurazione: È possibile configurare lo strumento in maniera semplice e completa.
Medie:
Medie per mercato: e’ possibile utilizzare le medie mobili esponenziali (EMA) esclusivamente per il mercato Crypto (5/10/60/223).
Media addizionale: e’ possibile visualizzare una media aggiuntiva, e.g. a 20 periodi.
Elementi del grafico:
Sfondo: segnala con lo sfondo del grafico in verde una situazione di uptrend ( EMA 60 > EMA 223) e in rosso sfondo rosso una situazione di downtrend (EMA 60 < EMA 223).
Separatori di sessioni: indica l’inizio della sessione corrente.
Punti Trigger:
Massimi e minimi di oggi: disegna sul grafico il prezzo di apertura della candela daily e i massimi e i minimi di giornata.
Massimi minimi di ieri: disegna sul grafico il prezzo di apertura della candela daily, i massimi e i minimi del giorno prima.
(English description)
Name: Scalping The Bull (Indicator)
Category: Scalping, Trend Following, Mean Reversion.
Timeframe: 1M, 5M, 30M, 1D depending on the specific signal.
Technical Analysis: The indicator supports the operations described in the YouTube videos of the channel "Scalping The Bull". Usually it is based on price action and exponential moving averages.
The various techniques that can be used in conjunction with the indicator are summarized in the indicator settings and you can refer to the specific videos for the full explanation.
Suggested usage: Altcoin showing strong trends for scalping and intra-day trades.
Configuration:
Exponential Moving Averages
Per market: you can display averages exclusively for the Crypto market (5/10/60/223).
Additional Average: You can display an additional average, e.g. 20-period average.
Chart elements:
Session Separators: indicates the beginning of the current session.
Background: signals with the background in green an uptrend situation ( 60 > 223) and in red background a downtrend situation (60 < 223).
Trigger points:
Today's highs and lows: draw on the chart the opening price of the daily candle and the highs and lows of the day.
Yesterday's highs and lows: draw on the chart the opening price of the daily candle, the highs and lows of the previous day.

Scalping The Bull - BTC Chart for Trend AnalysisName: BTC Chart for Trend Analysis
Category: Scalping, Trend Analysis .
Timeframe: 1M, 5M, 30M, 1D depending on the specific technique.
Technical Analysis: The indicator supports the operations of the trader named "Scalping The Bull" who uses BTC as an Index for Crypto trading.
Suggested usage: When trading on altcoins, to check whether or not they are trending with Bitcoin and whether those anticipate its movements.
It is therefore possible to see Bitcoin specifically if it makes red or green candles and how it is positioned with respect to the EMA 5, 10, 60, 223, however configurable from the panel.
Used in conjunction with Scalping The Bull Indicator or PRO Indicator, on the main panel.
Configuration:
EMA Length:
- EMA 1: by default 5, configurable
- EMA 2: by default 10, configurable
- EMA 3: by default 60, configurable
- EMA 4: by default 223, configurable
Colors can be modified from "Settings" > "Style"
Designed to be used with the following the indicator:

Scalping The Bull IndicatorName: Scalping The Bull Indicator
Category: Scalping, Trend Following, Mean Reversion.
Timeframe: 1M, 5M, 30M, 1D depending on the specific technique.
Technical Analysis: The indicator supports the operations of the trader named "Scalping The Bull" which uses price action and exponential moving averages.
Suggested usage: Altcoin showing strong trends for scalping and intra-day trades. Trigger points are used as entry and exit points and to be used to understand when a signal has more power.
It is possible to identify the following conformations:
Shimano: look at the price records of a consecutive series of closings between the EMA 60 and the EMA 223 when a certain threshold is reached. Use the trigger points as price structures to identify entry and exit zones (e.g. breakout of the yesterday high as for entry point) .
Bomb: look at the price registers a percentage variation in a single candle, greater than a threshold such as 2%, in particular on shorter timeframes and around the trigger points.
Viagra: look at there is a consecutive series of closes below the EMA 10.
Downward fake: look when, after a cross under (Death Cross), the price returns above the EMA 223 using the yesterday high as a trigger point.
Emergence: look at the EMA 60 is about to cross over the EMA 223.
Anti-crossing: look at, after an important price rise and a subsequent retracement, the EMA 60 is about to cross under the EMA 223 but a bullish impulse brings the price back above the EMAs.
For Sales: look at two types of situations: 1) when the price falls by more than 10% from the opening price and around the yesterday’s low or 2) when the price falls and then reaches, in the last 5 days, a bigger percentage and then breaks a trigger point.
Colour change: look at the opening price of the session - indicated as a trigger point.
Third touch of EMA 60: look for 3 touches below the EMA 60, and enter when there is a close above the EMA 60.
Third touch of EMA 223: look for 3 touches when there are 3 touches below the EMA 223, and enter when there is a close above the EMA 60.
Bud: look at price when it crosses upwards the average 10 and subsequently at least 2 "rest" candles are between the maximum and minimum of the breaking candle.
Fake on EMA 10: look for the open of a candle higher than the EMA 10, the minimum of the candle lower and the closing price returns above the EMA 10..
For Stop Loss and Profit Targets consider a proper R/R depending on Risk Management, using price structures such as the low of the entering candle and a quick Position Management moving quickly the Stop-Loss at Break-Even.
Configuration:
Market
EMA: The indicator automatically configure itself on market it knows (Binance, Piazza Affari and NASDAQ) otherwise it can be configured manually fo Crypto market (5/10/60/223) or Stock Market (5/10/50/200).
Additional Average: You can display an additional average, e.g. 20-period average.
Chart elements:
Session Separators: indicates the beginning of the current session (in blue)
Background: signals with the background in green an uptrend situation ( 60 > 223) and in red background a downtrend situation (60 < 223).
Trigger points:
Today's highs and lows: draw on the chart the opening price of the daily candle and the highs and lows of the day (high in purple, low in red and open in green)
Yesterday's highs and lows: draw on the chart the opening price of the daily candle, the highs and lows of the previous day (high in yellow, low in red).
Credits
Massimo : for refactoring and suggestions.

Scalping PullBack Tool R1 by JustUncleLDescription
This study project is a Scalping Pullback trading Tool that incorporates the majority of the indicators needed to analyse and scalp Trends for Pull Backs and reversals on 1min, 5min or 15min charts. The set up utilies Heikin Ashi candle charts. Incorporated within this tool are the following indicators:
1. Major industry (Banks) recognised important EMAs in an EMA Ribbon:
Green = EMA89
Blue = EMA200
Black = EMA633
2. The 36EMA (default) High/Low+Close Price Action Channel (PAC).
3. Fractals
4. HH, LH, LL, HL finder to help with drawing Trend lines and mini Trend Lines.
5. Coloured coded Bar high lighting based on the PAC:
blue = bar closed above PAC
red = bar closed below PAC
gray = bar closed inside PAC
red line = EMA36 of bar close
Setup and hints:
Set the chart to Heikin Ashi Candles.
Add "Sweetspot Gold10" indicator to the chart as well to help with support and resistance finding and shows where the important "00" and "0" lines are.
When price is above the PAC(blue bars) we are only looking to buy as price comes back to the PAC
When price is below the PAC(red bars), we are only looking to sell when price comes back to the PAC
What we’re looking for when price comes back into the PAC we draw mini Trendlines utilising the Fractals and HH/LL points to guide your TL drawing.
Now look for the trend to pull back and break the drawn TL. That's is when we place the scalp trade.
So we are looking for continuation signals in terms of a strong, momentum driven pullbacks (normally short term 10-20 pips) of the EMA36.
The other EMAs are there to check for other Pullbacks when EMA36 is broken.
Other than the SweetSpot Gold10 indicator, you should not need any other indicator to scalp the pullbacks.
References:
Fractals V8 by RicardoSantos
Price Action Trading System v0.3 by JustUncleL
SweetSpot Gold10 R1 by JustUncleL
www.swing-trade-stocks.com
www.forexstrategiesresources.com

Scalping IchimokuBased on the Ichimoku Cloud indicator, the Scalping Ichimoku is a strategy applied in a simple form.
How the strategy works?
The indicator will watch two filters from the Ichimoku Cloud indicator. The first one is when the price crosses the cloud (over or under). The second filter is when the conversion line crosses the baseline (over or under). When both filters happen, no matter the order or when the indicator will print an arrow signal.
Buy Signal
A buy signal, or arrow up, will appear when the price crosses over the cloud and when the conversion line crosses over the baseline.
Sell Signal
A sell signal, or arrow down, will appear when the price crosses under the cloud and the conversion line crosses under the baseline.
Exit Points
Show Exit Spots enabled. The indicator will print possible exit spots for the last entry, based on the cross from conversion with baseline. In case the cross is against the latest entry signal, it will show an "X"
One Signal At Time
The indicator will print only one signal in a single direction. It will never print the same signal as the last signal
Exit and Entry Spot At The Same Candle
In the chart, when the entry spot and an exit spot appear in the same candle, the exit spot will appear with a different color. This means that the entry spot is more accurate.
This strategy was designed for scalping, no matter the time frame or market, but it may work for swing traders as well.

Scalping Entry/Exit Indicator by DiGetImagine having a tool that not only spots high-probability entry signals but also visually marks them on your chart with color-coded cues and automated alerts. The Scalping Entry/Exit Indicator by DiGet does exactly that—by fusing a range of classic candlestick patterns (such as Bullish Hammers, Engulfing patterns, and Morning/Evening Stars) with dynamic risk management levels, this script empowers you to make swift and informed trading decisions. Whether you're an active trader or an algorithm enthusiast, this indicator offers both precision and clarity in identifying scalp opportunities, making your chart analysis more efficient and visually engaging.
Indicator Breakdown
Input Parameters:
The indicator accepts a customizable risk-reward ratio, an ATR period for volatility measurement, and a lookback period to scan for valid candlestick patterns.
ATR & Candle Calculations:
It computes the Average True Range (ATR) to dynamically set stop-loss and take-profit levels. Additionally, it determines the body and wick sizes of each candlestick to help identify key reversal patterns.
Pattern Detection:
Multiple bullish patterns (Hammer, Engulfing, Morning Star) and bearish patterns (Shooting Star, Engulfing, Evening Star) are detected. There’s also a simplified version of the Head & Shoulders pattern, offering further validation for reversal signals.
Signal Generation & Trade Levels:
The script consolidates the pattern signals into combined “buy” and “sell” triggers. It then calculates the respective stop-loss (SL) and take-profit (TP) levels based on the current price and ATR, providing a robust risk management framework.
Visual Aids & Alerts:
To enhance usability, the indicator changes the chart’s background color to green for buy signals and red for sell signals. It also draws labels, lines (representing SL and TP), and markers directly on the chart, along with alert conditions to notify traders of actionable signals.
This indicator is an excellent addition to your TradingView toolkit—ideal for scalpers and short-term traders seeking clarity, precision, and automated signal generation on their charts.
Enjoy trading with confidence and precision!

Scalping using RSI 2 indicator with TP and TSLThis study implements a simply scalping using the RSI (calculated on two periods), the slopes of two MAs (EMA or SMA) having different lengths (by default, I use 50 and 200).
A take profit (%) and a trailing stop loss (%) are used.
Entry conditions:
.) Fast MA > Slow MA and Price > Slow MA and RSI < Oversold Threshold ------> go Long
.) Fast MA < Slow MA and Price < Slow MA and RSI > Overbought Threshold ------> go Short
Exit conditions:
.) Long entry condition is true and (close >= TP or close <= TSL) ----> close short position
.) Short entry condition is true and (close <= TP or close >= TSL) ----> close long position
The strategy performed best on Bitcoin and the most liquid and capitalized Altcoins but works excellent on volatile assets, mainly if they often go trending.
Works best on 3h - 4h time frame.
There's also an optional Volatility filter, which opens the position only if the difference between the two slopes is more than a specific value, which can be set in the study inputs. The purpose is not opening positions if the price goes sideways and the noise is way > than the signal.
Note:
.) the RSI length is 2;
.) the oversold Threshold is 90%;
.) the overbought Threshold is 10%;
.) by default, the take profit per cent is 0.5%;
.) by default, the trailing stop loss per cent is 0.5%;
.) by default, the fast MA length is 50;
.) by default, the slow MA length is 200;
.) by default, the MA used is EMA.
Cheers.

Scalping EMAs for ForexMoving averages for 5m time frame. The 96 and 252 are the 8 and 21 on 1h
Inspired by this simple scalping strategy
NSDT Scalping ChannelThis script uses the highs and lows of the candles (instead of the close) to make a "channel" to reference while scalping.
Use the green lower line as a guide to go long and the red upper line as a guide to go short. You may use the lines as potential entry points and direction but you may want to consider exiting before the opposite colored line prints, as that may be too late. As always, entries and exits are at the discretion of each trader.
You will need to adjust the "Line Spacing" settings as you change instruments, chart timeframes, and/or volatility increases/decreases.
Thrax - QuickStrike 5-Mins Scalping** Indicator Description **
1. Price Change Threshold (%) – The minimum price change required for a candle to be recognized as significant. Candles exceeding this threshold are considered potential candidates for zone creation. Default value for 5 min is 0.5%. As you move on higher timeframe the threshold should increase
2. Percentage Change for Zones (%) – The amount of price movement needed to form a dynamic support or resistance zone. Tweak this to control how sensitive the indicator is to price fluctuations. 5 min default value is 1%. For 15 min suggested is 2-3%.
3. Break Threshold for Zones (%) – Defines how much price must break above or below a zone for it to be removed from the chart/mitigated. Keeps the chart clean by removing invalidated zones. Default value is 0.1% in 5 min, for 15 min it is 0.5%.
4. Buy Zone Retracement Level (%) – The percentage retracement level for defining the inner buy zone within a broader bullish zone. Ideal for timing precision entries. Ideal value is 75%
5. Sell Zone Retracement Level (%) – The percentage retracement level used to determine the inner sell zone within a larger bearish zone. Helps in identifying potential reversal areas or exits. Ideal value is 25%
By tailoring these inputs, traders can fully customize the indicator to suit their scalping strategies, enhancing their ability to navigate fast-moving markets with confidence.
---------------------------------------------------------------------------
There are two primary approaches for scalping using this indicator:
1. Candle-Based Scalping:
a. Bullish Signal: When you observe a bullish candle highlighted in blue (by default), you can consider entering a long position at the close of this candle. It’s advisable to wait for the candle to close before taking action. For a more aggressive scalp, you might take profits based on your scalp target after a few subsequent candles. If the price remains stagnant or moves unfavorably in the next few candles, you can exit with a small loss. Alternatively, if you have a higher risk tolerance, you may hold the position even if the price initially declines within a set percentage.
b. Bearish Signal: For a bearish candle highlighted in yellow, you can enter a short trade at the close of the candle. Similar to the bullish setup, you have the option to exit after a few candles if the price doesn’t move as expected or hold the position with a higher risk tolerance if the price goes up initially.
2. Zone-Based Scalping:
Entering Zones: Monitor the price as it enters a defined support or resistance zone. If you are open to higher risk, you can enter a trade immediately upon the price entering the zone. For a more cautious approach with a smaller stop loss, wait for the price to reach a retracement level within the zone before initiating your trade. This approach allows for a more precise entry but may result in missing out on trades if the price reverses before hitting the retracement level. Conversely, entering at the zone’s boundary offers the potential for early trade capture but comes with a higher stop loss risk.
Adjust these strategies based on your risk tolerance and trading preferences to optimize your scalping opportunities.

Ultimate Scalping Tool[BullByte]Overview
The Ultimate Scalping Tool is an open-source TradingView indicator built for scalpers and short-term traders released under the Mozilla Public License 2.0. It uses a custom Quantum Flux Candle (QFC) oscillator to combine multiple market forces into one visual signal. In plain terms, the script reads momentum, trend strength, volatility, and volume together and plots a special “candlestick” each bar (the QFC) that reflects the overall market bias. This unified view makes it easier to spot entries and exits: the tool labels signals as Strong Buy/Sell, Pullback (a brief retracement in a trend), Early Entry, or Exit Warning . It also provides color-coded alerts and a small dashboard of metrics. In practice, traders see green/red oscillator bars and symbols on the chart when conditions align, helping them scalp or trend-follow without reading multiple separate indicators.
Core Components
Quantum Flux Candle (QFC) Construction
The QFC is the heart of the indicator. Rather than using raw price, it creates a candlestick-like bar from the underlying oscillator values. Each QFC bar has an “open,” “high/low,” and “close” derived from calculated momentum and volatility inputs for that period . In effect, this turns the oscillator into intuitive candle patterns so traders can recognize momentum shifts visually. (For comparison, note that Heikin-Ashi candles “have a smoother look because take an average of the movement”. The QFC instead represents exact oscillator readings, so it reflects true momentum changes without hiding price action.) Colors of QFC bars change dynamically (e.g. green for bullish momentum, red for bearish) to highlight shifts. This is the first open-source QFC oscillator that dynamically weights four non-correlated indicators with moving thresholds, which makes it a unique indicator on its own.
Oscillator Normalization & Adaptive Weights
The script normalizes its oscillator to a fixed scale (for example, a 0–100 range much like the RSI) so that various inputs can be compared fairly. It then applies adaptive weighting: the relative influence of trend, momentum, volatility or volume signals is automatically adjusted based on current market conditions. For instance, in very volatile markets the script might weight volatility more heavily, or in a strong trend it might give extra weight to trend direction. Normalizing data and adjusting weights helps keep the QFC sensitive but stable (normalization ensures all inputs fit a common scale).
Trend/Momentum/Volume/Volatility Fusion
Unlike a typical single-factor oscillator, the QFC oscillator fuses four aspects at once. It may compute, for example, a trend indicator (such as an ADX or moving average slope), a momentum measure (like RSI or Rate-of-Change), a volume-based pressure (similar to MFI/OBV), and a volatility measure (like ATR) . These different values are combined into one composite oscillator. This “multi-dimensional” approach follows best practices of using non-correlated indicators (trend, momentum, volume, volatility) for confirmation. By encoding all these signals in one line, a high QFC reading means that trend, momentum, and volume are all aligned, whereas a neutral reading might mean mixed conditions. This gives traders a comprehensive picture of market strength.
Signal Classification
The script interprets the QFC oscillator to label trades. For example:
• Strong Buy/Sell : Triggered when the oscillator crosses a high-confidence threshold (e.g. breaks clearly above zero with strong slope), indicating a well-confirmed move. This is like seeing a big green/red QFC candle aligned with the trend.
• Pullbacks : Identified when the trend is up but momentum dips briefly. A Pullback Buy appears if the overall trend is bullish but the oscillator has a short retracement – a typical buying opportunity in an uptrend. (A pullback is “a brief decline or pause in a generally upward price trend”.)
• Early Buy/Sell : Marks an initial swing in the oscillator suggesting a possible new trend, before it is fully confirmed. It’s a hint of momentum building (an early-warning signal), not as strong as the confirmed “Strong” signal.
• Exit Warnings : Issued when momentum peaks or reverses. For instance, if the QFC bars reach a high and start turning red/green opposite, the indicator warns that the move may be ending. In other words, a Momentum Peak is the point of maximum strength after which weakness may follow.
These categories correspond to typical trading concepts: Pullback (temporary reversal in an uptrend), Early Buy (an initial bullish cross), Strong Buy (confirmed bullish momentum), and Momentum Peak (peak oscillator value suggesting exhaustion).
Filters (DI Reversal, Dynamic Thresholds, HTF EMA/ADX)
Extra filters help avoid bad trades. A DI Reversal filter uses the +DI/–DI lines (from the ADX system) to require that the trend direction confirms the signal . For example, it might ignore a buy signal if the +DI is still below –DI. Dynamic Thresholds adjust signal levels on-the-fly: rather than fixed “overbought” lines, they move with volatility so signals happen under appropriate market stress. An optional High-Timeframe EMA or ADX filter adds a check against a larger timeframe trend: for instance, only taking a trade if price is above the weekly EMA or if weekly ADX shows a strong trend. (Notably, the ADX is “a technical indicator used by traders to determine the strength of a price trend”, so requiring a high-timeframe ADX avoids trading against the bigger trend.)
Dashboard Metrics & Color Logic
The Dashboard in the Ultimate Scalping Tool (UST) serves as a centralized information hub, providing traders with real-time insights into market conditions, trend strength, momentum, volume pressure, and trade signals. It is highly customizable, allowing users to adjust its appearance and content based on their preferences.
1. Dashboard Layout & Customization
Short vs. Extended Mode : Users can toggle between a compact view (9 rows) and an extended view (13 rows) via the `Short Dashboard` input.
Text Size Options : The dashboard supports three text sizes— Tiny, Small, and Normal —adjustable via the `Dashboard Text Size` input.
Positioning : The dashboard is positioned in the top-right corner by default but can be moved if modified in the script.
2. Key Metrics Displayed
The dashboard presents critical trading metrics in a structured table format:
Trend (TF) : Indicates the current trend direction (Strong Bullish, Moderate Bullish, Sideways, Moderate Bearish, Strong Bearish) based on normalized trend strength (normTrend) .
Momentum (TF) : Displays momentum status (Strong Bullish/Bearish or Neutral) derived from the oscillator's position relative to dynamic thresholds.
Volume (CMF) : Shows buying/selling pressure levels (Very High Buying, High Selling, Neutral, etc.) based on the Chaikin Money Flow (CMF) indicator.
Basic & Advanced Signals:
Basic Signal : Provides simple trade signals (Strong Buy, Strong Sell, Pullback Buy, Pullback Sell, No Trade).
Advanced Signal : Offers nuanced signals (Early Buy/Sell, Momentum Peak, Weakening Momentum, etc.) with color-coded alerts.
RSI : Displays the Relative Strength Index (RSI) value, colored based on overbought (>70), oversold (<30), or neutral conditions.
HTF Filter : Indicates the higher timeframe trend status (Bullish, Bearish, Neutral) when using the Leading HTF Filter.
VWAP : Shows the V olume-Weighted Average Price and whether the current price is above (bullish) or below (bearish) it.
ADX : Displays the Average Directional Index (ADX) value, with color highlighting whether it is rising (green) or falling (red).
Market Mode : Shows the selected market type (Crypto, Stocks, Options, Forex, Custom).
Regime : Indicates volatility conditions (High, Low, Moderate) based on the **ATR ratio**.
3. Filters Status Panel
A secondary panel displays the status of active filters, helping traders quickly assess which conditions are influencing signals:
- DI Reversal Filter: On/Off (confirms reversals before generating signals).
- Dynamic Thresholds: On/Off (adjusts buy/sell thresholds based on volatility).
- Adaptive Weighting: On/Off (auto-adjusts oscillator weights for trend/momentum/volatility).
- Early Signal: On/Off (enables early momentum-based signals).
- Leading HTF Filter: On/Off (applies higher timeframe trend confirmation).
4. Visual Enhancements
Color-Coded Cells : Each metric is color-coded (green for bullish, red for bearish, gray for neutral) for quick interpretation.
Dynamic Background : The dashboard background adapts to market conditions (bullish/bearish/neutral) based on ADX and DI trends.
Customizable Reference Lines : Users can enable/disable fixed reference lines for the oscillator.
How It(QFC) Differs from Traditional Indicators
Quantum Flux Candle (QFC) Versus Heikin-Ashi
Heikin-Ashi candles smooth price by averaging (HA’s open/close use averages) so they show trend clearly but hide true price (the current HA bar’s close is not the real price). QFC candles are different: they are oscillator values, not price averages . A Heikin-Ashi chart “has a smoother look because it is essentially taking an average of the movement”, which can cause lag. The QFC instead shows the raw combined momentum each bar, allowing faster recognition of shifts. In short, HA is a smoothed price chart; QFC is a momentum-based chart.
Versus Standard Oscillators
Common oscillators like RSI or MACD use fixed formulas on price (or price+volume). For example, RSI “compares gains and losses and normalizes this value on a scale from 0 to 100”, reflecting pure price momentum. MFI is similar but adds volume. These indicators each show one dimension: momentum or volume. The Ultimate Scalping Tool’s QFC goes further by integrating trend strength and volatility too. In practice, this means a move that looks strong on RSI might be downplayed by low volume or weak trend in QFC. As one source notes, using multiple non-correlated indicators (trend, momentum, volume, volatility) provides a more complete market picture. The QFC’s multi-factor fusion is unique – it is effectively a multi-dimensional oscillator rather than a traditional single-input one.
Signal Style
Traditional oscillators often use crossovers (RSI crossing 50) or fixed zones (MACD above zero) for signals. The Ultimate Scalping Tool’s signals are custom-classified: it explicitly labels pullbacks, early entries, and strong moves. These terms go beyond a typical indicator’s generic “buy”/“sell.” In other words, it packages a strategy around the oscillator, which traders can backtest or observe without reading code.
Key Term Definitions
• Pullback : A short-term dip or consolidation in an uptrend. In this script, a Pullback Buy appears when price is generally rising but shows a brief retracement. (As defined by Investopedia, a pullback is “a brief decline or pause in a generally upward price trend”.)
• Early Buy/Sell : An initial or tentative entry signal. It means the oscillator first starts turning positive (or negative) before a full trend has developed. It’s an early indication that a trend might be starting.
• Strong Buy/Sell : A confident entry signal when multiple conditions align. This label is used when momentum is already strong and confirmed by trend/volume filters, offering a higher-probability trade.
• Momentum Peak : The point where bullish (or bearish) momentum reaches its maximum before weakening. When the oscillator value stops rising (or falling) and begins to reverse, the script flags it as a peak – signaling that the current move could be overextended.
What is the Flux MA?
The Flux MA (Moving Average) is an Exponential Moving Average (EMA) applied to a normalized oscillator, referred to as FM . Its purpose is to smooth out the fluctuations of the oscillator, providing a clearer picture of the underlying trend direction and strength. Think of it as a dynamic baseline that the oscillator moves above or below, helping you determine whether the market is trending bullish or bearish.
How it’s calculated (Flux MA):
1.The oscillator is normalized (scaled to a range, typically between 0 and 1, using a default scale factor of 100.0).
2.An EMA is applied to this normalized value (FM) over a user-defined period (default is 10 periods).
3.The result is rescaled back to the oscillator’s original range for plotting.
Why it matters : The Flux MA acts like a support or resistance level for the oscillator, making it easier to spot trend shifts.
Color of the Flux Candle
The Quantum Flux Candle visualizes the normalized oscillator (FM) as candlesticks, with colors that indicate specific market conditions based on the relationship between the FM and the Flux MA. Here’s what each color means:
• Green : The FM is above the Flux MA, signaling bullish momentum. This suggests the market is trending upward.
• Red : The FM is below the Flux MA, signaling bearish momentum. This suggests the market is trending downward.
• Yellow : Indicates strong buy conditions (e.g., a "Strong Buy" signal combined with a positive trend). This is a high-confidence signal to go long.
• Purple : Indicates strong sell conditions (e.g., a "Strong Sell" signal combined with a negative trend). This is a high-confidence signal to go short.
The candle mode shows the oscillator’s open, high, low, and close values for each period, similar to price candlesticks, but it’s the color that provides the quick visual cue for trading decisions.
How to Trade the Flux MA with Respect to the Candle
Trading with the Flux MA and Quantum Flux Candle involves using the MA as a trend indicator and the candle colors as entry and exit signals. Here’s a step-by-step guide:
1. Identify the Trend Direction
• Bullish Trend : The Flux Candle is green and positioned above the Flux MA. This indicates upward momentum.
• Bearish Trend : The Flux Candle is red and positioned below the Flux MA. This indicates downward momentum.
The Flux MA serves as the reference line—candles above it suggest buying pressure, while candles below it suggest selling pressure.
2. Interpret Candle Colors for Trade Signals
• Green Candle : General bullish momentum. Consider entering or holding a long position.
• Red Candle : General bearish momentum. Consider entering or holding a short position.
• Yellow Candle : A strong buy signal. This is an ideal time to enter a long trade.
• Purple Candle : A strong sell signal. This is an ideal time to enter a short trade.
3. Enter Trades Based on Crossovers and Colors
• Long Entry : Enter a buy position when the Flux Candle turns green and crosses above the Flux MA. If it turns yellow, this is an even stronger signal to go long.
• Short Entry : Enter a sell position when the Flux Candle turns red and crosses below the Flux MA. If it turns purple, this is an even stronger signal to go short.
4. Exit Trades
• Exit Long : Close your buy position when the Flux Candle turns red or crosses below the Flux MA, indicating the bullish trend may be reversing.
• Exit Short : Close your sell position when the Flux Candle turns green or crosses above the Flux MA, indicating the bearish trend may be reversing.
•You might also exit a long trade if the candle changes from yellow to green (weakening strong buy signal) or a short trade from purple to red (weakening strong sell signal).
5. Use Additional Confirmation
To avoid false signals, combine the Flux MA and candle signals with other indicators or dashboard metrics (e.g., trend strength, momentum, or volume pressure). For example:
•A yellow candle with a " Strong Bullish " trend and high buying volume is a robust long signal.
•A red candle with a " Moderate Bearish " trend and neutral momentum might need more confirmation before shorting.
Practical Example
Imagine you’re scalping a cryptocurrency:
• Long Trade : The Flux Candle turns yellow and is above the Flux MA, with the dashboard showing "Strong Buy" and high buying volume. You enter a long position. You exit when the candle turns red and dips below the Flux MA.
• Short Trade : The Flux Candle turns purple and crosses below the Flux MA, with a "Strong Sell" signal on the dashboard. You enter a short position. You exit when the candle turns green and crosses above the Flux MA.
Market Presets and Adaptation
This indicator is designed to work on any market with candlestick price data (stocks, crypto, forex, indices, etc.). To handle different behavior, it provides presets for major asset classes. Selecting a “Stocks,” “Crypto,” “Forex,” or “Options” preset automatically loads a set of parameter values optimized for that market . For example, a crypto preset might use a shorter lookback or higher sensitivity to account for crypto’s high volatility, while a stocks preset might use slightly longer smoothing since stocks often trend more slowly. In practice, this means the same core QFC logic applies across markets, but the thresholds and smoothing adjust so signals remain relevant for each asset type.
Usage Guidelines
• Recommended Timeframes : Optimized for 1 minute to 15 minute intraday charts. Can also be used on higher timeframes for short term swings.
• Market Types : Select “Crypto,” “Stocks,” “Forex,” or “Options” to auto tune periods, thresholds and weights. Use “Custom” to manually adjust all inputs.
• Interpreting Signals : Always confirm a signal by checking that trend, volume, and VWAP agree on the dashboard. A green “Strong Buy” arrow with green trend, green volume, and price > VWAP is highest probability.
• Adjusting Sensitivity : To reduce false signals in fast markets, enable DI Reversal Confirmation and Dynamic Thresholds. For more frequent entries in trending environments, enable Early Entry Trigger.
• Risk Management : This tool does not plot stop loss or take profit levels. Users should define their own risk parameters based on support/resistance or volatility bands.
Background Shading
To give you an at-a-glance sense of market regime without reading numbers, the indicator automatically tints the chart background in three modes—neutral, bullish and bearish—with two levels of intensity (light vs. dark):
Neutral (Gray)
When ADX is below 20 the market is considered “no trend” or too weak to trade. The background fills with a light gray (high transparency) so you know to sit on your hands.
Bullish (Green)
As soon as ADX rises above 20 and +DI exceeds –DI, the background turns a semi-transparent green, signaling an emerging uptrend. When ADX climbs above 30 (strong trend), the green becomes more opaque—reminding you that trend-following signals (Strong Buy, Pullback) carry extra weight.
Bearish (Red)
Similarly, if –DI exceeds +DI with ADX >20, you get a light red tint for a developing downtrend, and a darker, more solid red once ADX surpasses 30.
By dynamically varying both hue (green vs. red vs. gray) and opacity (light vs. dark), the background instantly communicates trend strength and direction—so you always know whether to favor breakout-style entries (in a strong trend) or stay flat during choppy, low-ADX conditions.
The setup shown in the above chart snapshot is BTCUSD 15 min chart : Binance for reference.
Disclaimer
No indicator guarantees profits. Backtest or paper trade this tool to understand its behavior in your market. Always use proper position sizing and stop loss orders.
Good luck!
- BullByte

CCI Stochastic and a quick lesson on Scalping & Trading SystemsHello traders
Still on holidays but I don't and will never forget you <3
I realize more and more that you guys don't only want some indicators and learn about pinescript. You also want some guidance and get some mentors providing you with comprehensive and simple trading methods and tricks.
I'm against those posting many scripts a day that in the end will make you lose your money because they don't give you the methodology to use them
It might look nice on the charts but we're not here to do some painting.... but to improve our lifestyle right :)
The today indicator is based on an indicator that I used for scalping : Fxcodebase CCI Stochastic
A CCI stochastic is very reactive and allows us to take many scalps trades per day with a few pips/USD gain for each trade. I don't recommend novice traders to use it and I strongly recommend everyone reading my disclaimer below basically saying "I'm not a financial advisor, don't be dumb, stay safe"
(I also recommend the few scripts copy-pasters to read my disclaimer as well)
What's a novice trader, sir? Well... thanks for asking. A novice trader is any trader with less than 5 years of live trading experience
From a pinescript perspective, this script will be however interesting for everyone :)
How to use it?
The indicator gives 3 possible entries for Longs and Shorts:
- Arrows at Enter - Will give signals whenever the Stoch CCI will enter in the BUY/SELL zone
- Arrows at Exit - Will give signals whenever the Stoch CCI will exit the BUY/SELL zone
- Arrows at Center - Signals whenever the Stoch CCI will cross the mid-line (50)
All arrows have different colors because ... painting is cool and nice.... kidding.... it gives clearer and more readable signals on the chart (but painting sir...)
A possible trading method could be to use the 3 modes at the same time to get the maximum of opportunities.
The safer bet is to use the "Arrows at Exit" only mode but for those who want to accumulate more scalping positions, adding the "Arrows at Enter" mode is an option as well. In other words, you accumulate a few scalping positions whenever the Stoch CCI get in the BUY/SELL zone and will stop accumulating whenever it will exit the BUY/SELL zone
You can add a few extra positions whenever the Stoch CCI will cross the mid-line as it often translates in a trend continuation
Life hack
Very important note : (probably the most important gem I shared until now) The inputs set by default will have to be changed for your asset/timeframe and can't be generic for everything. You have to play with the inputs until the signals will make sense to you
The indicator/strategy with a unique configuration that you'll never check or update according to the market condition DOES NOT exit.
If you find such a tool and prove me that you're making constant gains with it over a year, please patent it and then show it to me as I'd like to study it to replicate :) But most likely this is a myth/unicorn
Who I am to say this? Well, I worked in a Bank with real traders and I have a good sense of what works and what will certainly not work
My guru said scalping crypto in 1 second timeframe was the way to get rich quick. Do you agree sir?
But in trading, this is not because you take the maximum of trades possible that your gains will increase. This is the contrary.
There is a strong and proven inverse correlation between the number of trades taken and how fast you'll burn your capital. A swing trader taking 2/3 trades a month is more likely to beat 99% of the scalpers out there trying to predict all market movements. (and I'm not even talking about how dangerous it is to scalp with leverage)
You're starting to know me a bit more right now. I prefer to tell you what you need to hear vs what you want to hear because the second option doesn't allow to stay in the game very long.
I might lose some futures clients along the way by saying that but for my own conscience and ethics, I prefer to warn about the true risks of trading and to select who you listen very carefully (the advice also works for me, if you feel what I said doesn't make sense, this is totally your right but I hope this is because I'm french and not because of the content ^^).
See you tomorrow for another indicator or idea
Love you all
Dave
____________________________________________________________
Be sure to hit the thumbs up. Building those indicators take a lot of time and likes are always rewarding for me :) (tips are accepted too)
- If you want to suggest some indicators that I can develop and share with the community, please use my personal TRELLO board
- I'm an officially approved PineEditor/LUA/MT4 approved mentor on codementor. You can request a coaching with me if you want and I'll teach you how to build kick-ass indicators and strategies
Jump on a 1 to 1 coaching with me
- You can also hire for a custom dev of your indicator/strategy/bot/chrome extension/python
Disclaimer:
Trading involves a high level of financial risk, and may not be appropriate because you may experience losses greater than your deposit. Leverage can be against you.
Do not trade with capital that you can not afford to lose. You must be aware and have a complete understanding of all the risks associated with the market and trading. We can not be held responsible for any loss you incur.
Trading also involves risks of gambling addiction.
Please notice I do not provide financial advice - my indicators, strategies, educational ideas are intended to provide only some source code for anyone interested in improving their trading
The proprietary indicators and strategies developed by Best Trading Indicator, the object of intellectual property rights are and remain the exclusive property of Best Trading Indicator, at the exclusion of images and videos and texts free of rights or provided by the Company or external legal or physical person.
No assignment of intellectual property rights is carried out through these Terms and Conditions.
Any total or partial reproduction, modification or use of these properties for any reason whatsoever is strictly prohibited without the express written authorization of the Company.

XRP Scalping with EMA Crossover Anticipation This script is designed to detect scalping opportunities on XRP by anticipating EMA crossovers, reinforced with technical confirmation filters.
Methodology
- The core signal is based on the crossover between a fast EMA (9) and a slow EMA (21).
- RSI (14) conditions are applied to avoid weak setups: RSI must be above 40 for buy signals and below 70 for sell signals.
- Before any crossover is validated, the script requires at least two consecutive “pre-crossover” signals. These indicate favorable momentum and convergence conditions before the crossover occurs.
- Final signals are only displayed if this minimum number of preconditions is met.
Application
This system is optimized for scalping on the 1-minute to 5-minute timeframes but can be adapted for longer-term setups by adjusting parameters. The anticipation logic helps reduce lagging entries and improves signal selectivity during volatile conditions.
Both pre-crossover and confirmed crossover conditions include alert options. The code is fully editable and customizable.
Predicta Futures – Scalping Predictor with Confidence FilterPredicta Futures is an advanced short-term forecasting indicator that combines historical pattern similarity analysis with weighted technical signals to predict price movements 1–10 minutes ahead.
**Core Functionality**
The script scans up to 5,000 historical bars to identify structurally similar price patterns. It aggregates forward outcomes from matched patterns and integrates real-time signals from RSI, MACD, Bollinger Bands, volume momentum, and volatility. A composite confidence score filters signals, displaying only those meeting the user-defined threshold (default ≥68%).
**Key Outputs**
- Buy/sell triangles with text labels
- Dashed projection line to predicted price
- Dotted target and ATR-based stop lines
- Info panel showing forecast direction, confidence %, expected move %, pattern count, order book status, and data access details
**Customization & Performance**
- Execution modes: Fast, Balanced, Accurate
- Adaptive sampling with recency bias option
- Filters for volatility and market hours
- Adjustable weights, lookback period, and prediction horizon
**Use Cases**
Scalping, intraday trading, futures, cryptocurrencies, equities.
*Order book metrics are simulated (platform limitation). Technical analysis tool; not financial advice.*

Scalping Tool with Dynamic Take Profit & Stop Loss### **Scalping Indicator: Summary and User Guide**
The **Scalping Indicator** is a powerful tool designed for traders who focus on short-term price movements. It combines **Exponential Moving Averages (EMA)** for trend identification and **Average True Range (ATR)** for dynamic stop loss and take profit levels. The indicator is highly customizable, allowing traders to adapt it to their specific trading style and risk tolerance.
---
### **Key Features**
1. **Trend Identification**:
- Uses two EMAs (Fast and Slow) to identify trend direction.
- Generates **Buy Signals** when the Fast EMA crosses above the Slow EMA.
- Generates **Sell Signals** when the Fast EMA crosses below the Slow EMA.
2. **Dynamic Take Profit (TP) and Stop Loss (SL)**:
- **Take Profit (TP)**:
- TP levels are calculated as a percentage above (for long trades) or below (for short trades) the entry price.
- TP levels are **dynamically recalculated** when the price reaches the initial target, allowing for multiple TP levels during a single trade.
- **Stop Loss (SL)**:
- SL levels are calculated using the ATR multiplier, providing a volatility-based buffer to protect against adverse price movements.
3. **Separate Settings for Long and Short Trades**:
- Users can independently enable/disable and configure TP and SL for **Buy** and **Sell** orders.
- This flexibility ensures that the indicator can be tailored to different market conditions and trading strategies.
4. **Visual Signals and Levels**:
- **Buy/Sell Signals**: Clearly marked on the chart with labels ("BUY" or "SELL").
- **TP and SL Levels**: Plotted on the chart for both long and short trades, making it easy to visualize risk and reward.
---
### **How to Use the Scalping Indicator**
#### **1. Setting Up the Indicator**
- Apply the indicator to your chart in TradingView.
- Configure the input parameters based on your trading preferences:
- **Fast Length**: The period for the Fast EMA (default: 5).
- **Slow Length**: The period for the Slow EMA (default: 13).
- **ATR Length**: The period for the ATR calculation (default: 14).
- **Buy/Sell TP and SL**: Enable/disable and set the percentage or ATR multiplier for TP and SL levels.
#### **2. Interpreting the Signals**
- **Buy Signal**:
- When the Fast EMA crosses above the Slow EMA, a "BUY" label appears below the price bar.
- The TP and SL levels for the long trade are plotted on the chart.
- **Sell Signal**:
- When the Fast EMA crosses below the Slow EMA, a "SELL" label appears above the price bar.
- The TP and SL levels for the short trade are plotted on the chart.
#### **3. Managing Trades**
- **Take Profit (TP)**:
- When the price reaches the initial TP level, the indicator automatically recalculates the next TP level based on the new close price.
- This allows traders to capture additional profits as the trend continues.
- **Stop Loss (SL)**:
- The SL level is based on the ATR multiplier, providing a dynamic buffer against market volatility.
- If the price hits the SL level, the trade is considered closed, and the indicator resets.
#### **4. Customization**
- Adjust the **Fast Length** and **Slow Length** to suit your trading timeframe (e.g., shorter lengths for scalping, longer lengths for swing trading).
- Modify the **ATR Multiplier** and **TP Percentage** to align with your risk-reward ratio.
- Enable/disable TP and SL for long and short trades based on your trading strategy.
---
### **Tips for Getting the Best Results**
1. **Combine with Price Action**:
- Use the Scalping Indicator in conjunction with support/resistance levels, candlestick patterns, or other technical analysis tools to confirm signals.
2. **Optimize for Your Timeframe**:
- For **scalping**, use shorter EMA lengths (e.g., Fast: 5, Slow: 13).
- For **swing trading**, use longer EMA lengths (e.g., Fast: 10, Slow: 20).
3. **Adjust Risk Management**:
- Use a smaller **ATR Multiplier** for tighter stop losses in low-volatility markets.
- Increase the **TP Percentage** to allow for larger price movements in high-volatility markets.
4. **Backtest and Practice**:
- Test the indicator on historical data to understand its performance in different market conditions.
- Use a demo account to practice trading with the indicator before applying it to live trading.
---
### **Conclusion**
The **Scalping Indicator** is a versatile and user-friendly tool for traders who want to capitalize on short-term price movements. By combining trend-following EMAs with dynamic TP and SL levels, it provides a clear and systematic approach to trading. Whether you're a scalper or a swing trader, this indicator can help you identify high-probability setups and manage risk effectively. Customize it to fit your strategy, and always remember to combine it with sound risk management principles for the best results.

Stochastic + Keltner Channels for ScalpingSimple arrow indicator, indicating the direction go the next slight movement. This indicator will work on any time frame or market.
How does this indicator work?
It will use Stochastic and Keltner Channels to detect potential reversals depending on the frequency you choose in the indicator's settings. The higher the frequency, the fewer candles will be used in the calculation.
When to use this indicator?
It will work better in higher time frames for low volatility indicators. You can mix with other indicators like RSI or ADX. This way, you will be able to check if the time selected frame has enough volatility to move the price enough to cover the spreads and fees of your broker.
When to exit the trade after the signal from this indicator?
A good target would be for 1x ATR value and stop-loss 2x the ATR value. Doing trailing stop will reduce your risk and secure some profits, but make sure to use values for possible fakeouts
Can this indicator be used alone as the main source of entry signal for the trades?
You can use it alone, but I recommend mixing with other trend-based indicators, like Moving Averages, so you get the best results. Since it's for scalping purposes, small moments, and reversals, it doesn't have the trend filter, but it can work trading in favor of a significant trend as well
this is a better version of my other script Scalping Arrows

Ultimate Scalping IndicatorOverview
The Confluence Signal Indicator is a precision-built scalping tool designed to identify high-probability reversal points in the market.
It combines three core technical elements:
Trend
Mean reversion
Momentum
into a single, efficient system.
By filtering out weak RSI signals and focusing only on setups that align with trend direction and recent momentum shifts, this indicator delivers cleaner and more accurate short-term trade signals.
Core Components
200-Period Moving Average (MA200, 5-Minute Timeframe)
The MA200 is always calculated from the 5-minute chart, regardless of your current timeframe. It defines the macro trend direction and ensures that all trades align with the prevailing momentum.
Session VWAP (Volume-Weighted Average Price)
The VWAP tracks the real-time average price weighted by volume for the current trading session. It acts as a dynamic mean-reversion level and helps identify key areas of institutional activity and short-term balance.
RSI (Relative Strength Index)
The indicator uses a standard 14-period RSI to detect overbought and oversold market conditions.
A “recency filter” is added to ensure signals only appear when RSI has recently transitioned from strength to weakness or vice versa, reducing false signals in trending markets.
Signal Logic
Bullish Signal (Green Arrow)
A bullish reversal signal is plotted below a candle when:
Price is above both the 5-minute MA200 and the Session VWAP.
RSI is oversold (below 30).
The last time RSI was above 50 occurred within the last 10 candles before going oversold.
This ensures that the dip is a fresh pullback within an uptrend, not a prolonged oversold condition.
Bearish Signal (Red Arrow)
A bearish reversal signal is plotted above a candle when:
Price is below both the 5-minute MA200 and the Session VWAP.
RSI is overbought (above 70).
The last time RSI was below 50 occurred within the last 10 candles before going overbought.
This ensures that the overbought reading follows a recent move from weakness, identifying potential short entries in a downtrend.
Recommended Usage
This is a scalping-focused indicator, intended for use on timeframes of 5 minutes or lower. Therefore I would highly recommend to use it on Equity futures trading, such as NQ!, ES!, GC! and so on.
It performs best when combined with additional tools such as support and resistance zones, order blocks, or liquidity levels for context.
Avoid counter-trend signals unless confirmed by price structure or volume behavior.

AI Volume Breakout for scalpingPurpose of the Indicator
This script is designed for trading, specifically for scalping, which involves making numerous trades within a very short time frame to take advantage of small price movements. The indicator looks for volume breakouts, which are moments when trading volume significantly increases, potentially signaling the start of a new price movement.
Key Components:
Parameters:
Volume Threshold (volumeThreshold): Determines how much volume must increase from one bar to the next for it to be considered significant. Set at 4.0, meaning volume must quadruplicate for a breakout signal.
Price Change Threshold (priceChangeThreshold): Defines the minimum price change required for a breakout signal. Here, it's 1.5% of the bar's opening price.
SMA Length (smaLength): The period for the Simple Moving Average, which helps confirm the trend direction. Here, it's set to 20.
Cooldown Period (cooldownPeriod): Prevents signals from being too close together, set to 10 bars.
ATR Period (atrPeriod): The period for calculating Average True Range (ATR), used to measure market volatility.
Volatility Threshold (volatilityThreshold): If ATR divided by the close price exceeds this, the market is considered too volatile for trading according to this strategy.
Calculations:
SMA (Simple Moving Average): Used for trend confirmation. A bullish signal is more likely if the price is above this average.
ATR (Average True Range): Measures market volatility. Lower volatility (below the threshold) is preferred for this strategy.
Signal Generation:
The indicator checks if:
Volume has increased significantly (volumeDelta > 0 and volume / volume >= volumeThreshold).
There's enough price change (math.abs(priceDelta / open) >= priceChangeThreshold).
The market isn't too volatile (lowVolatility).
The trend supports the direction of the price change (trendUp for bullish, trendDown for bearish).
If all these conditions are met, it predicts:
1 (Bullish) if conditions suggest buying.
0 (Bearish) if conditions suggest selling.
Cooldown Mechanism:
After a signal, the script waits for a number of bars (cooldownPeriod) before considering another signal to avoid over-trading.
Visual Feedback:
Labels are placed on the chart:
Green label for bullish breakouts below the low price.
Red label for bearish breakouts above the high price.
How to Use:
Entry Points: Look for the labels on your chart to decide when to enter trades.
Risk Management: Since this is for scalping, ensure each trade has tight stop-losses to manage risk due to the quick, small movements.
Market Conditions: This strategy might work best in markets with consistent volume and price changes but not extreme volatility.
Caveats:
This isn't real AI; it's a heuristic based on volume and price. Actual AI would involve machine learning algorithms trained on historical data.
Always backtest any strategy, and consider how it behaves in different market conditions, not just the ones it was designed for.

RF+ Divergence Scalping SystemRF+ Divergence Scalping System + Custom Signals + Alerts.
This chart overlay indicator has been developed for the low timeframe divergence scalper.
Built upon the realtime divergence drawing code from the Divergence for Many indicator originally authored by Lonsometheblue, this chart overlay indicator bundles several additional unique features and modifications to serve as an all-in-one divergence scalping system. The current key features at the time of publishing are listed below (features are optional and can be enabled or disabled):
- Fully configurable realtime divergence drawing and alerting feature that can draw divergences directly on the chart using data sourced from up to 11 oscillators selected by the user, which have been included specifically for their ability to detect divergences, including oscillators not presently included in the original Divergence for Many indicator, such as the Ultimate Oscillator and TSI.
- Optional on chart table showing a summary of key statuses of various indicators, and nearby divergences.
- 2 x Range Filters with custom settings used for low timeframe trend detection.
- 3 x configurable multi-timeframe Stochastic RSI overbought and oversold signals with presentation options.
- On-chart pivot points drawn automatically.
- Automatically adjusted pivot period for up to 4 configurable time frames to fine tune divergences drawn for optimal divergence detection.
- Real-price line for use with Heikin Ashi candles, with styling options.
- Real-price close dots for use with Heikin Ashi candles, with styling options.
- A selection of custom signals that can be printed on-chart and alerted.
- Sessions indicator for the London, New York, Tokyo and Sydney trading sessions, including daylight savings toggle, and unique ‘invert background color’ option, which colours the entire chart - except the trading session you have selected, leaving your chart clear of distracting background color.
- Up to 4 fully configurable moving averages.
- Additional configurable settings for numerous built in indicators, allowing you to alter the lengths and source types, including the UO, TSI, MFI, TSV, 2 x Range Filters.
- Configurable RSI Trend detection signal filter used in a number of the signals, which filters buy signals where the RSI is over the RSI moving average, and only prints sell signals where RSI is under the moving average.
- Customisable on-chart watermark, with inputs for a custom title, subtitle, and also an optional symbol | timeframe | date feature.
The Oscillators able to be selected for use in drawing divergences at the time of publishing are as follows:
- Ultimate Oscillator (UO)
- True Strength Indicator (TSI)
- Money Flow Index (MFI)
- Cumulative Delta Volume (CDV)
- Time Segmented Volume (TSV)
- Commodity Channel Index (CCI)
- Awesome Oscillator
- Relative Strength Index (RSI)
- Stochastic
- On Balance Volume (OBV)
- MACD Histogram
What are divergences?
Divergence is when the price of an asset is moving in the opposite direction of a technical indicator, such as an oscillator, or is moving contrary to other data. Divergence warns that the current price trend may be weakening, and in some cases may lead to the price changing direction.
There are 4 main types of divergence, which are split into 2 categories;
regular divergences and hidden divergences. Regular divergences indicate possible trend reversals, and hidden divergences indicate possible trend continuation.
Regular bullish divergence: An indication of a potential trend reversal, from the current downtrend, to an uptrend.
Regular bearish divergence: An indication of a potential trend reversal, from the current uptrend, to a downtrend.
Hidden bullish divergence: An indication of a potential uptrend continuation.
Hidden bearish divergence: An indication of a potential downtrend continuation.
Setting alerts.
With this indicator you can set alerts to notify you when any/all of the above types of divergences occur, on any chart timeframe you choose, also when the triple timeframe Stochastic RSI overbought and oversold confluences occur, as well as when custom signals are printed.
Configurable pivot period values.
You can adjust the default pivot period values to suit your prefered trading style and timeframe. If you like to trade a shorter time frame, lowering the default lookback values will make the divergences drawn more sensitive to short term price action. By default, this indicator has enabled the automatic adjustment of the pivot periods for 4 configurable time frames, in a bid to optimize the divergences drawn when the indicator is loaded onto any of the 4 time frames selected. These time frames and their associated pivot periods can be fully reconfigured within the settings menu. By default, these have been further optimized for the low timeframe scalper trading on the 1-15 minute time frames.
How do traders use divergences in their trading?
A divergence is considered a leading indicator in technical analysis , meaning it has the ability to indicate a potential price move in the short term future.
Hidden bullish and hidden bearish divergences, which indicate a potential continuation of the current trend are sometimes considered a good place for traders to begin, since trend continuation occurs more frequently than reversals, or trend changes.
When trading regular bullish divergences and regular bearish divergences, which are indications of a trend reversal, the probability of it doing so may increase when these occur at a strong support or resistance level . A common mistake new traders make is to get into a regular divergence trade too early, assuming it will immediately reverse, but these can continue to form for some time before the trend eventually changes, by using forms of support or resistance as an added confluence, such as when price reaches a moving average, the success rate when trading these patterns may increase.
Typically, traders will manually draw lines across the swing highs and swing lows of both the price chart and the oscillator to see whether they appear to present a divergence, this indicator will draw them for you, quickly and clearly, and can notify you when they occur.
How do traders use overbought and oversold levels in their trading?
The oversold level is when the Stochastic RSI is above the 80 level is typically interpreted as being 'overbought', and below the 20 level is typically considered 'oversold'. Traders will often use the Stochastic RSI at, or crossing down from an overbought level as a confluence for entry into a short position, and the Stochastic RSI at, or crossing up from an oversold level as a confluence for an entry into a long position. These levels do not mean that price will necessarily reverse at those levels in a reliable way, however. This is why this version of the Stoch RSI employs the triple timeframe overbought and oversold confluence, in an attempt to add a more confluence and reliability to this usage of the Stoch RSI.
This indicator is intended for use in conjunction with related panel indicators including the TSI+ (True Strength Indicator + Realtime Divergences), UO+ (Ultimate Oscillator + Realtime Divergences), and optionally the STRSI+ (MTF Stochastic RSI + Realtime Divergences) and MFI+ (Money Flow Index + Realtime Divergences) available via this authors’ Tradingview profile, under the scripts section. The realtime divergence drawing code will not identify all divergences, so it is suggested that you also have panel indicators to observe. Each panel indicator also offers additional means of entry confirmation into divergence trades, for example, the Stochastic can indicate when it is crossing down from overbought or up from oversold, the TSi can indicate when the 2 TSI bands cross over one another upward or downward, and the UO and MFI can indicate an entry confluence when they are nearing, or crossing their centerlines, for more confidence in your divergence trade entries.
Additional information on the settings for this indicator can be found via the tooltips within the settings menu itself. Further information on feature updates, and usage tips & tricks will be added to the comments section below in due course.
Disclaimer: This indicator uses code adapted from the Divergence for Many v4 indicator authored by Lonesometheblue, and several stock indicators authored by Tradingview. With many thanks.
