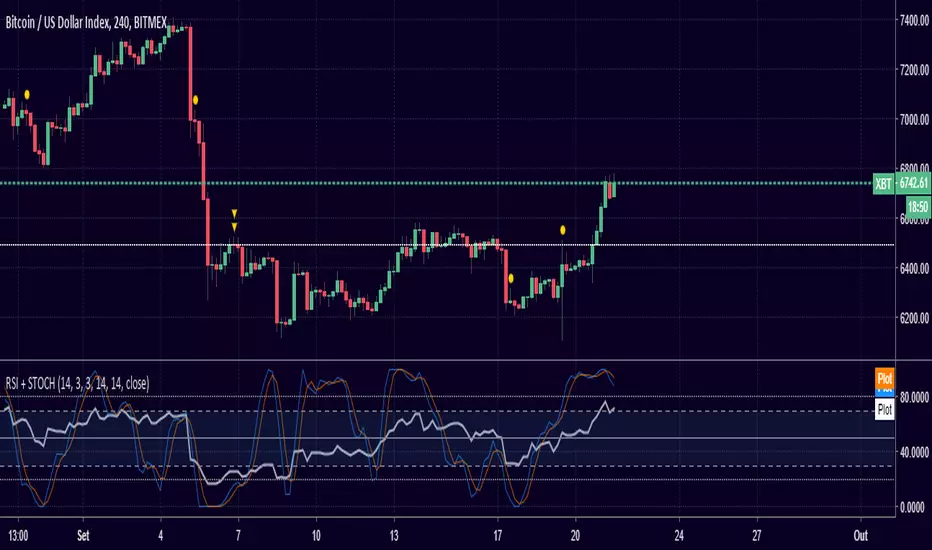
Scott's RSI with ema and stochsRSI with ema of RSI with regular stochastic overlaid into the same panel with control zones.
Pesquisar nos scripts por "rsi"

RSI Stop LossExperiment for using RSI as a stop loss value, shows where the price will be when the RSI increases or decreases by a specified amount.

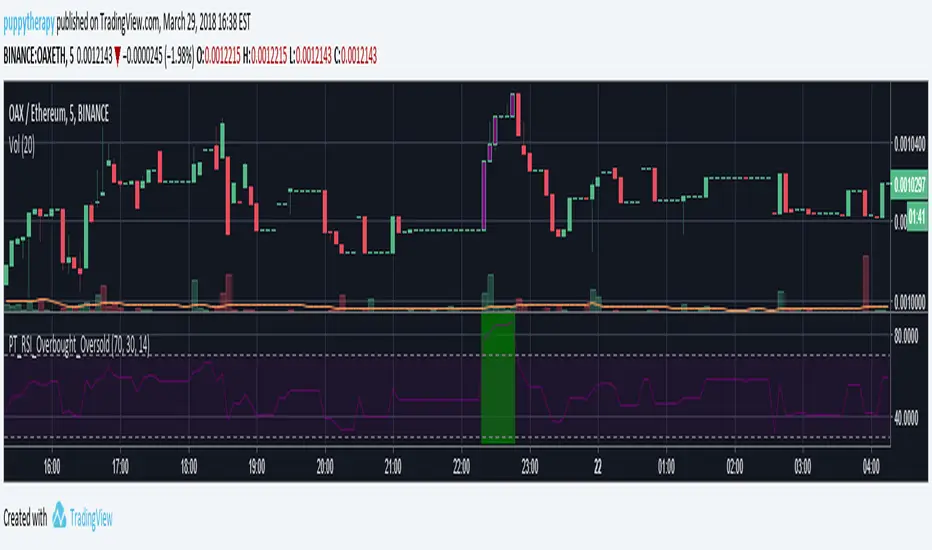
RSI Go longGiving all credit to @Celena at WarriorTrading for the idea behind this script.
The script is pretty basic and self-explanatory. We will use certain RSI levels both on 5min and 1min to determine the strength/momentum of a stock.
The idea is to monitor 5m and 1m timeframes at once. if the RSI starts to test the initial level, we will see a plot on the graph ( default color is orange ). If we reach our target level and above, bar colors will change to default color green. If this happens in both 1min and 5 min timeframe it is an indicator of the strength of the stock. This indicator coupled with our own strategy helps us reinforce the idea for long entries.

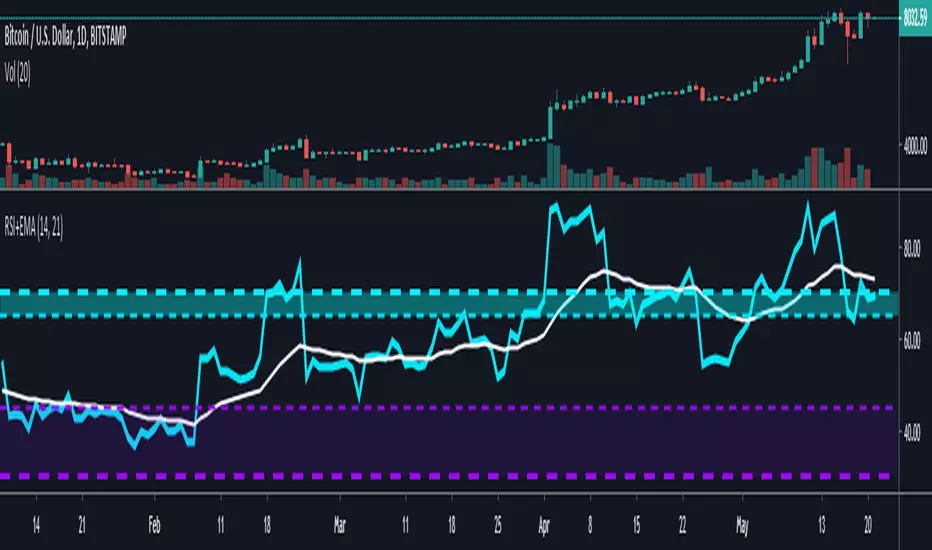
RSI + EMA with Multiple ZonesThis is your traditional RSI chart but with a few modifications
I added an extra zone parameter that you can specify with its own color and line customization.
There is an EMA that tracks the RSI as well.
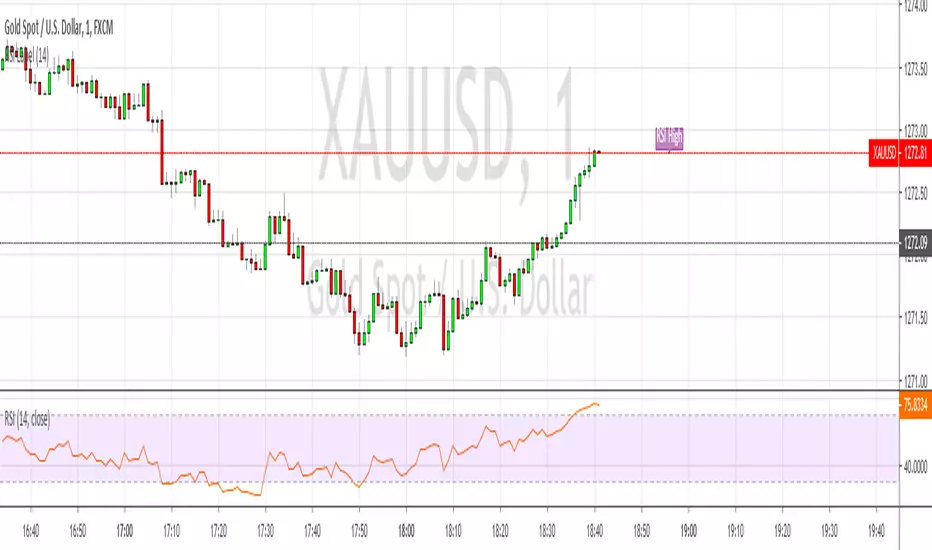
RSI LabelAdds a purple label to the right of price if RSI is overbought or oversold, otherwise it doesn't show anything at all, nada. Handy for people (like me) who often focus on price action and forget to watch the RSI
RSI with SMA ( Normal Formula of RSI)Tradingview has a different type of RSI. I prepare a normal formula for RSI to calculate better backtest performance.

RSI or %B of Bitfinex shorts /longs of main crypto trading pairsNormalized longs and shorts with %B or RSI of some crypto trading pairs listed below (longs and shorts data from Bitfinex). If you're not familiar with %B just use default setting and it will plot a RSI of the longs and shorts (screenshot is from %B). Obviously this should not be used as a single reason to take a trade but part of your analysis.
For some longs/shorts sentiment interpretation you can look at this:
cdn.discordapp.com
Available pairs (you can add some with very basic Pine Script knowledge but it will take more time loading):
BTCUSD
ETHUSD
ETHBTC
EOSBTC
LTCBTC
XRPBTC
BCHBTC
TRXBTC
RSI ALL IN ONE PLACEThis script combines the RSI, Stochastic RSI, and Stochastic to all be in one place for ease of use.
Nothing really new, just a script to streamline and create a convenient view of normal indicators

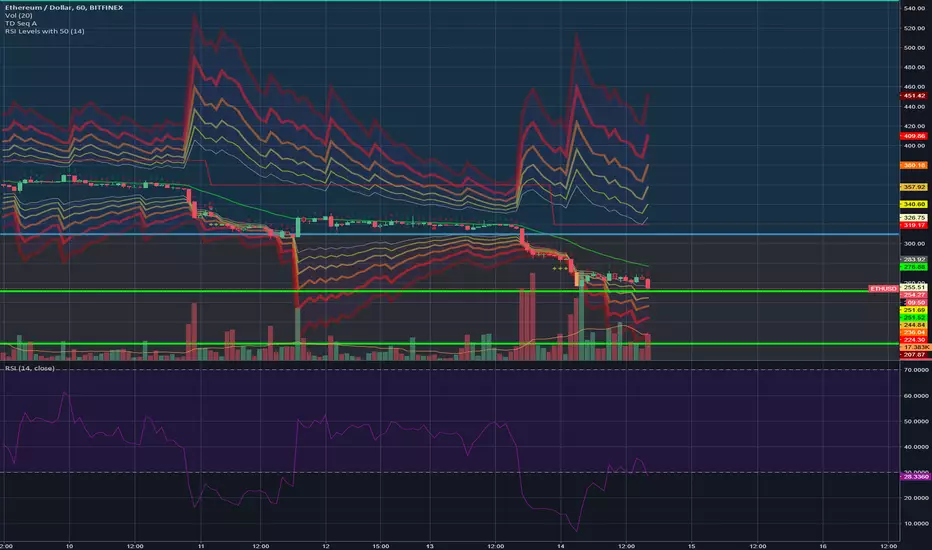
RSI Levels, 15-30 & 70-85 with 50New version of my RSI Levels, 20-30 & 70-80 considering extreme market conditions.
This version scales between 15-30 and 70-85 instead and also has RSI 50 as the middle line.
RSI Heat Bands [River]This script combines LazyBear's RSI Bands with JayRoger's Bollinger Heat Bands, to give an on chart representation of the price needed to set RSI to each major level, from 20 to 80 (higher values created massive bands).

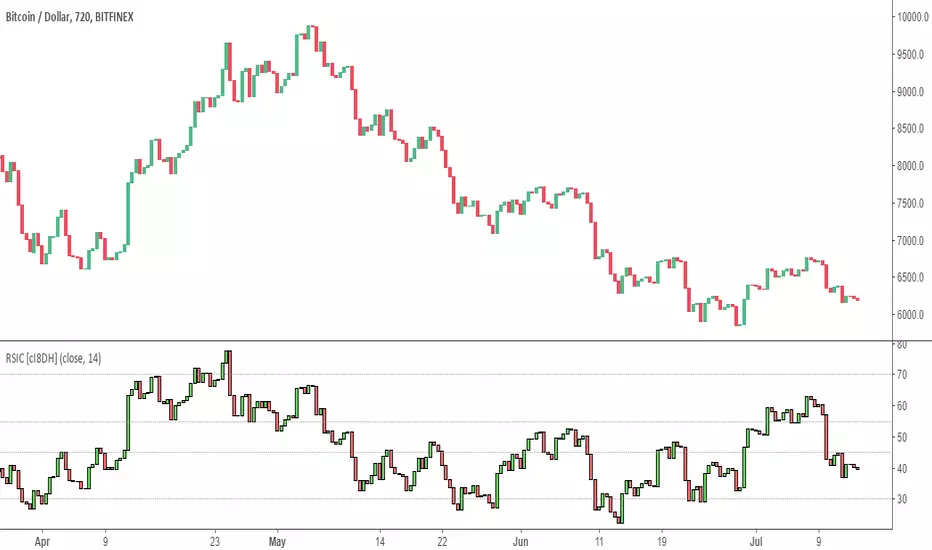
RSI Candles [cI8DH]This is candle visualization of regular RSI. That's all.
I have seen two other RSI candles, but their implementation is not correct. The high on RSI usually matches the low on price and vice versa. I have completely turned off the wicks so you can safely use this indicator as a replacement for regular RSI.
RSI Multi TF $$ ModCredit to @lukescream for the original code that I modified to make the multi RSI dynamic. 4 timeframes plus live time frame RSI can be plotted together to visualize areas of confluence.

RSI: Daily + current TimeFrame
It plots the RSI of the current timeframe + the Daily RSI
it hihlights in green (or red) when they are both in oversold (or overbought)

RSI MTF with Moving AverageClassic RSI with MTF combined with its moving average (i reused a function to allow you to select any of them you want) for additional signals.
Indicator is based on this source: medium.com

RSI CANDLESTICKSDisplays RSI indicator as candlesticks. Does candlestick pattern analysis apply to RSI? Can it aid in candlestick analysis on a price chart? Let's start a discussion.

RSI Oversold bounce - Scaling in levels (30, 28, 26, 24, 22, 20)Oversold bounce entry levels based on RSI
Helps to gauge levels for scaling into a position based on oversold rsi levels.

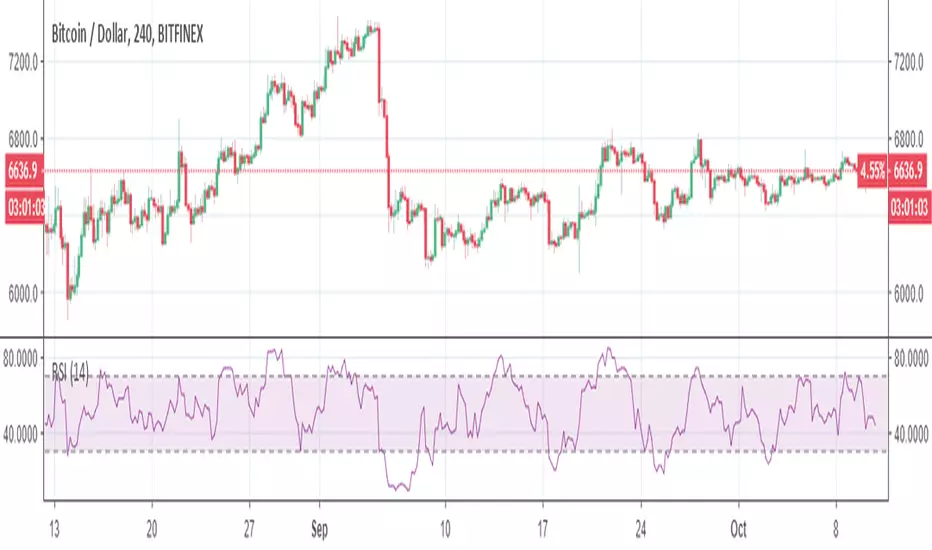
rsi cross indicatorSimple RSI oversold/overbought markers. Saves screen space without having to plot the actual rsi indicator.

RSI Bollinger BandsThis RSI indicator has a Bollinger Bands indicator around it, and a simple moving average.
I still haven't decided yet if the Bollinger Bands should be at 20 (like normal) or at 14 (like the RSI).
Experiment with it and have fun :)

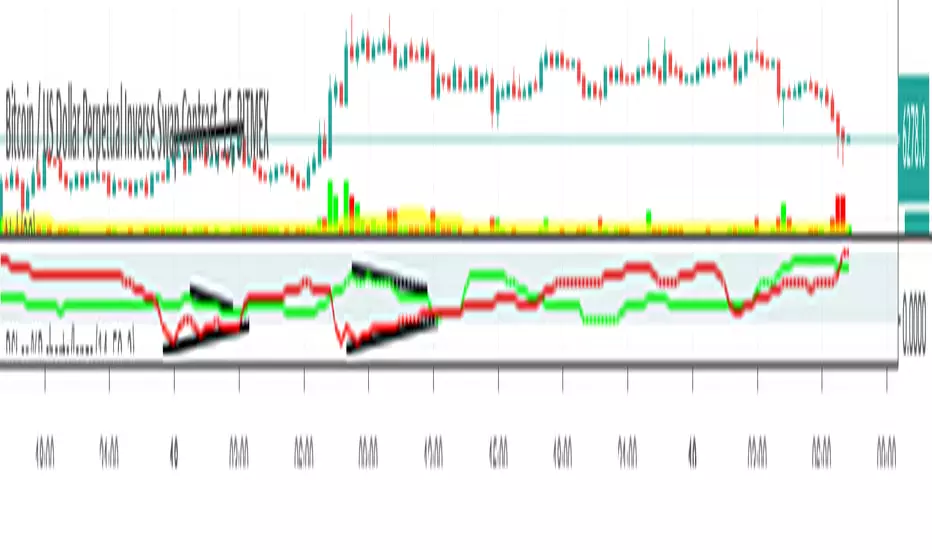
RSI/RCI3TripleTimeframe+VixFearInverseBottomDefault: RSI OFF,RCI ExLine OFF
RSI triangle signal: Buy-green Sell-red
Vix color(BG color): Fear-green Inverse-fuchsia Bottom-red

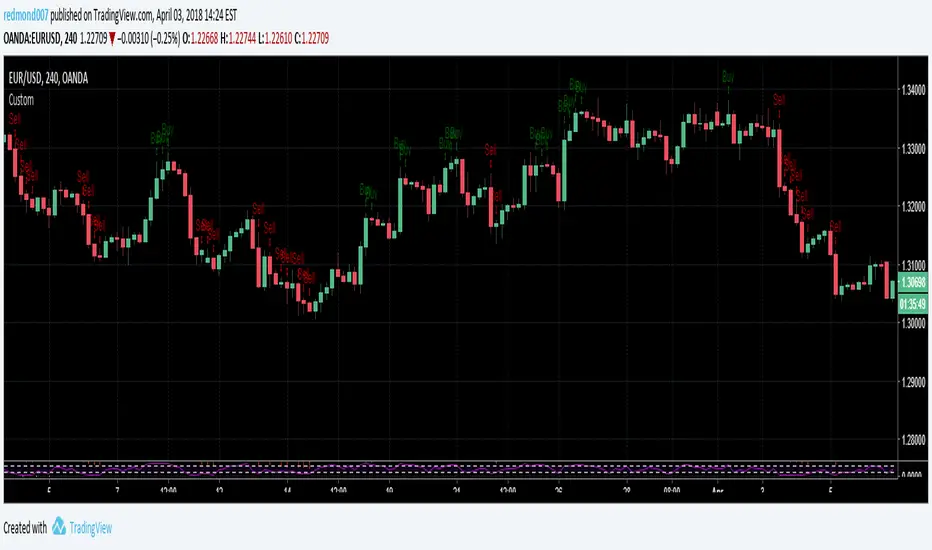
RSI MACD EMA Stoch Custom IndicatorCopyright by RJ 3/2018
Buy when:
RSI period 3 greater than 50, Difference between MACD and MACD signal line is greater than 0 and also greater than that of previous candle,
Stochastic %D line is less than 80 and greater than that of previous candle, Closing price greater than EMA period 100.
Sell when:
RSI period 3 less than 50, Difference between MACD and MACD signal line is less than 0 and also less than that of
previous candle, Stochastic %D line is greater than 20 and less than that of previous candle, Closing price less than EMA
period 100.
RSI Overbought and OversoldOversold Purple Candlestics + Red area in RSI Chart
Overbough Blue Candlestics + Green area in RSI Chart
This is just a trollscript for Tufts2003 yolooo