RSI Tops and BottomsHello Traders
This script finds Tops when RSI is in overbought area or Bottoms when RSI is in oversold area and checks the divergence between them. it checks divergence at tops/bottoms after RSI exited from OB/OS areas.
You can change overbought / oversold levels.
You can limit the time that RSI is in OB/OS area with the option "Max Number of Bars in OB/OS"
you can set the minimum/maximum distances between Tops/Bottoms with the options "Min Number of Bars between Tops/Bottoms" and "Max Number of Bars between Topss/Bottoms"
and you can set the color and line widths as you wish.
These tops or bottom must be sequential, means there mustn't be another top while checking tops or bottom while checking bottoms between them.
in next example you can see valid and invalid bottoms:
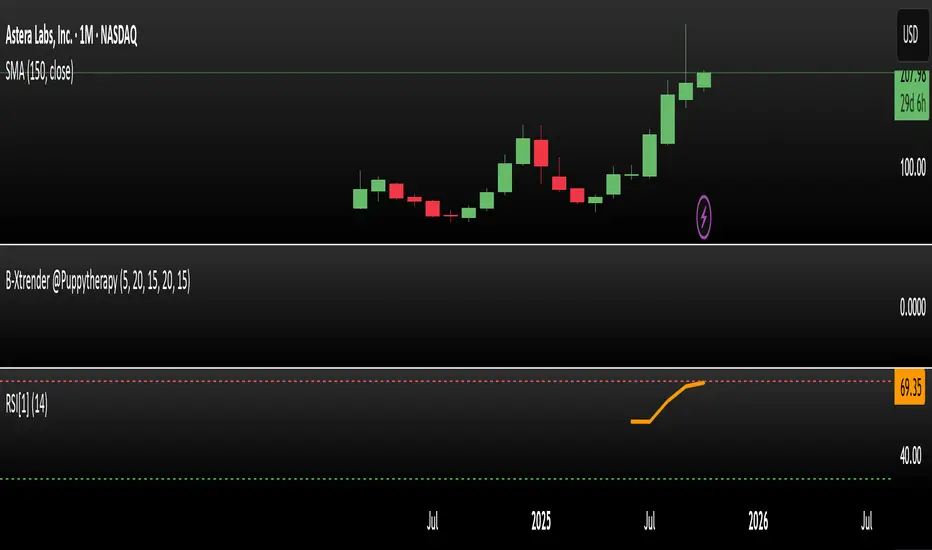
After you got signal then you better use Stop Order, a few pips higher than the high of colored candle for long positions, ( vise versa in short positions ). so you may escape from traps. ("Stop order" is filled when the price reached a pre-specified price. for example the price is now 10.0 and you set Buy Stop Order at 11.0 then if price reaches 11.0 then your buy order get filled. you can put stoploss a few pips lower than the low of colored candle or you can use ATR to decice stoploss level. how you wish)
For example in following screenshot you can see that buy stop order was not filled and you didn't take long position.
Enjoy!
Pesquisar nos scripts por "rsi"

RSI with Self-Adjusting Linear Regression Bands (Expo)RSI with Self-Adjusting Linear Regression Bands (Expo) makes use of RSI and Linear Regression to create an RSI that follows the current trend. The indicator has an upper and lower self-adjusting Linear Regression Band that act as RSI boundaries.
HOW TO USE
The indicator can be used in multiple ways, for instance, to find overbought and oversold areas. Or to identify trends as well as pullbacks in trends.
INDICATOR IN ACTION
This indicator is a modification of RafaelZioni's work "Linear Regression Trend bands"
Credit to: RafaelZioni
I hope you find this indicator useful , and please comment or contact me if you like the script or have any questions/suggestions for future improvements. Thanks!
I will continually work on this indicator, so please share your experience and feedback as it will enable me to make even better improvements. Thanks to everyone that has already contacted me regarding my scripts. Your feedback is valuable for future developments!
-----------------
Disclaimer
Copyright by Zeiierman.
The information contained in my scripts/indicators/ideas does not constitute financial advice or a solicitation to buy or sell any securities of any type. I will not accept liability for any loss or damage, including without limitation any loss of profit, which may arise directly or indirectly from the use of or reliance on such information.
All investments involve risk, and the past performance of a security, industry, sector, market, financial product, trading strategy, or individual’s trading does not guarantee future results or returns. Investors are fully responsible for any investment decisions they make. Such decisions should be based solely on an evaluation of their financial circumstances, investment objectives, risk tolerance, and liquidity needs.
My scripts/indicators/ideas are only for educational purposes!

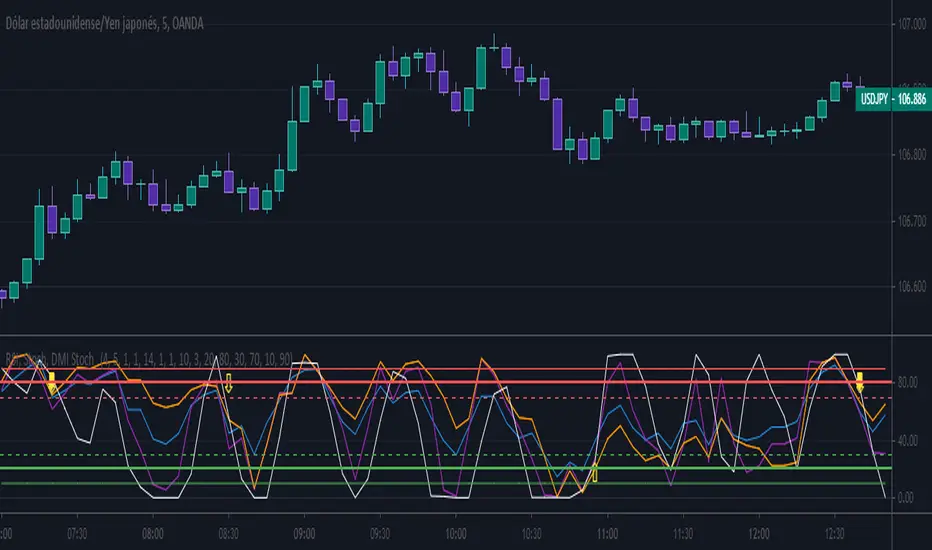
RSI, Stoch, DMI Stoch / By Mochero
With this indicator, we seek to find convergence of RSI, Stoch and DMI for purchases or sales.
Search Buy when,
-Rsi over sold
-Stoch over sold
-DMI Over sold
Search Sell when,
-Rsi oon purchased
-Stoch on purchased
-DMI on purchased
Suggested values
Rsi: 4
Stoch: 5.1.1
DMI: 10.3
Suggested time, 5M 15M
RSI (w/ Curve and Volatility)This is a centered triple oscillator which measures RSI, RVI (volatility), and Coppock Curve (trend). This is centered so it ranges from negative 50 to positive 50. This indicator is used most accurately when all 3 indicators show above/below 0.
RSI is the bright pink line. RSI determines strength in a direction. When it is above 20 or below -20, a pullback is likely - this could be a prime time to scale out of position. Remember do not enter a trade just because it is oversold, as the strength is still greatly against you.
RVI is the thin lighter line. RVI was created by Donald Dorsey to use in conjunction with other indicators. The instructions for using RVI is to sell/short when below -10 and buy/cover when above 10. Use this indicator to confirm your bias.
The purple area is the Coppock curve . This curve is used to analyze longer term trends in a chart. RSI and RVI struggle to indicate long term trends, use the Coppock curve to confirm your bias. The curve is bullish when above 0 and bearish when below 0. Be cautious when trying to buy or sell it early when its falling. If it is falling and pops back up without reaching 0, it is typically indicate of a big price movement in that direction.

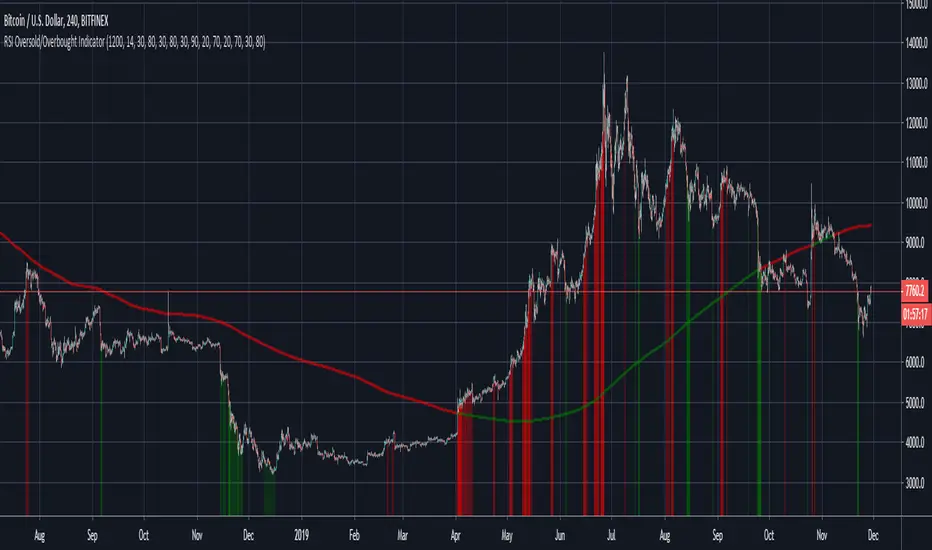
RSI Oversold/Overbought IndicatorThis is a very simple but quite powerful indicator which looks at the RSI simultaneously over the 4h, Daily and Weekly timeframes, and places bands on the chart when one or more timeframes move into oversold/overbought territory. For further filtering I use the 200 day SMA to determine if we are in a Bull or Bear market, which puts a bias on the RSI (30/80 in a Bull market and 20/70 in a Bear market).
The deeper the colour, the more oversold the market is. The weekly RSI can be used as an early warning sign, with the Daily/ 4h RSI useful to identify local peaks.
RSI X-Factorel índice de fuerza relativa (RSI) es un indicador que nos determina la fuerza que está teniendo la moneda en sí, va en un rango de 0 a 100, si el RSI esta mayor al rango 70 se lo considera sobrecomprado, es decir, exceso de compras, el precio de la moneda esta alto. En ese momento el indicador costumizado por X-factor indicadores nos marcará una barra roja que significa momento de vender. Caso contrario cuando el RSI esta por debajo de la zona del 30 significa que el precio esta sobrevendido, exceso de ventas, es decir, el precio de la moneda esta barato, por ende hay una gran probabilidad de que cambie de tendencia para alcista. El RSI nos va a mostrar una barra verde para decirnos que es momento de comprar

RSI Based Automatic Supply and DemandA script that draws supply and demand zones based on the RSI indicator. For example if RSI is under 30 a supply zone is drawn on the chart and extended for as long as there isn't a new crossunder 30. Same goes for above 70. The threshold which by default is set to 30, which means 30 is added to 0 and subtracted from 100 to give us the classic 30/70 threshold on RSI, can be set in the indicator settings.
By only plotting the Demand Below Supply Above indicator you get automatic SD level that is updated every time RSI reaches either 30 or 70. If you plot the Resistance Zone / Support Zone you get an indicator that extends the zone instead of overwrite the earlier zone. Due to the zone being extended the chart can get a bit messy if there isn't a clear range going on.
There is also a "confirmation bars" setting where you can tell the script how many bars under over 30 / 70 you want before a zone is drawn.
Here is an image of only using the "Demand Below / Supply Above" plot.
As you can see, this could be useful "Price Flow" indicator, where we would only short if a zone appears below another zone, or long if two zones in a row are going up, like stairs.

RSI Swing Signal - ChartThis indicator is the chart version intended to accompany my custom RSI oscillator:
CLICK HERE TO SEE BASE INDICATOR
CLICK HERE TO SEE BASE INDICATOR

RSI AND SMOOTHED STOCH RSI TOGETHERi dont know pine script but here i used some free ones and merged them and modified some
especially smoothed stoch rsi is Good to decide when buy coz i modified it and when fast K value is over D value it changes color
visually better this way
also rsi is shown as area o histogram but if u dont like u can change to line
for stoch rsi i unclick xtrigger (d value) for better appearance

Rsi/Cci Overbought Oversold CandlesThis indicator will allow you to see overbought and oversold areas of the rsi or the cci, you must set yourself the upper and lower band of the rsi (70-30) or cci (100, -100). By default, it's Rsi
I have already posted the same indicator but only with the Rsi, I wanted to posted a more complete that offers the 2.
On the chart, it is the overbought / oversold area of the Cci that is displayed

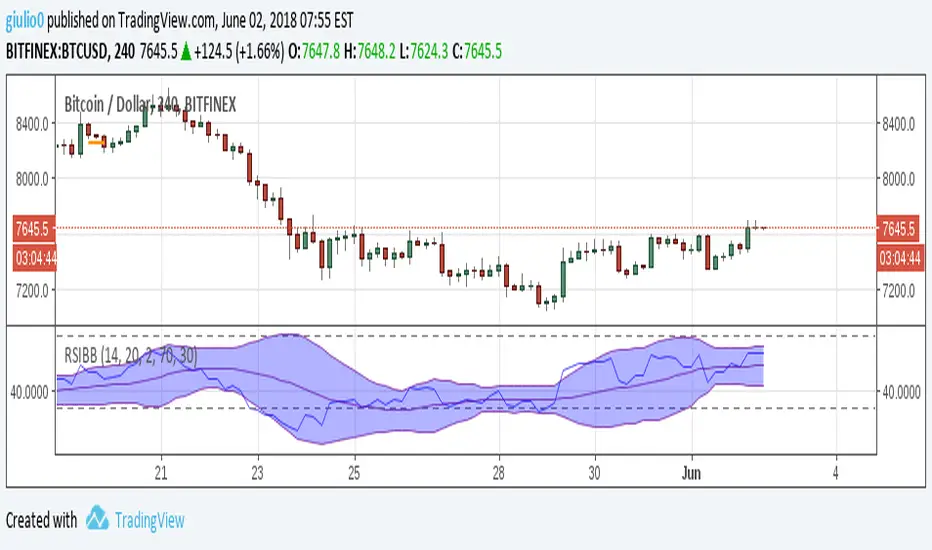
RSI+Bollinger BandsThis is a simple RSI with applied Bollinger Bands. The BB may help spotting "hidden" divergences or "fake" divergences. For instance: in an uptrend we have a high followed by a higher high, the plain RSI shows a divergence, adding BB we see that the first (higher) RSI high is inside the BB, while the second (lower) RSI high is outside the bands, this would be a fake divergence.
The use of the indicator should be straightforward, for any questions feel free to write me a message
RSI-Histo-Entry_JDThis indicator shows a histogram of the RSI in relation to an ema of the RSI.
The histogram is then smoothed to give early reversal/entry signals.
The actual RSI line with oversold/overbought indication can be displayed or omitted, as preferred.
In addiction to the RSI line or as an alternative to it, the background colour can be set to change folowing the RSI signals.
JD.

RSI normalized by Bollinger BandsEnglish.
RSI indicator with Bollinger Bands in one. Forgot oversold and overbought!
With BB and RSI you can dinamically saw when RSI is in critical values. And when you can see figure 'M' or 'W' in oscillator it means that current movement of impulse is down.
Русский.
RSI и Ленты Боллинджера в одном. Забудьте о тупых линиях перекупленности и перепроданности!
При работе в связке вы можете определять эти зоны динамически. И при формировании фигуры 'M' или 'W' на осцилляторе будет четко показано, что текущий импульс умер, надо выходить из сделки.
Example of usage (exit points) / Пример использования (точки выхода)

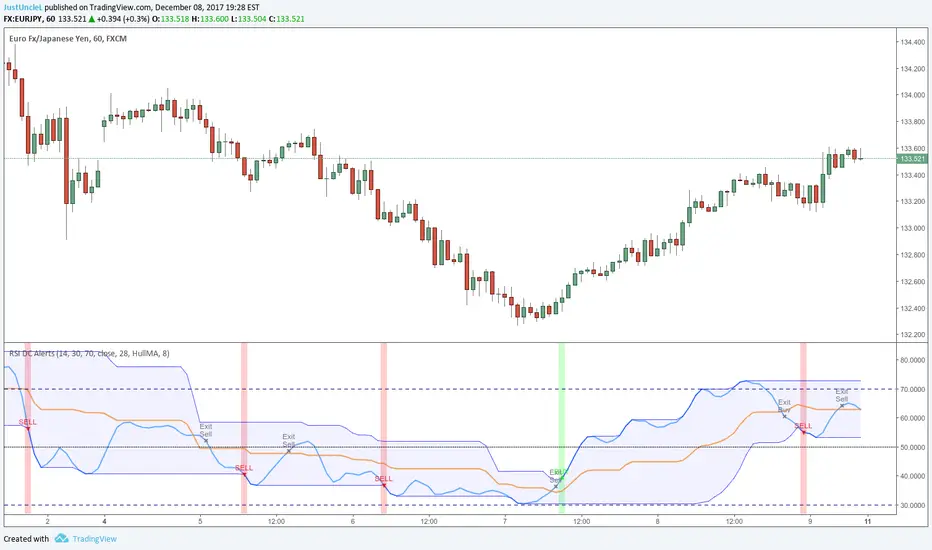
RSI Donchian R1 Alerts by JustUncleLThis study is based on an idea by presented by RicardoSantos and JayRogers of using Donchian Channel (DC) on the RSI curve. The idea being that when RSI passes through the DC centre and touches the Highest/Lowest DC then price action tends to follow in the same direction and stay there until the RSI crosses DC centre line again.
This script expands on the original idea by including alert and exit signals based on the above rules. These alerts are also filtered by the rule: they must be within the Oversold and Overbought boundaries of the RSI.
There is also the option of applying MA smoothing to the RSI curve, the HullMA (8) is recommended (default).
Each Entry and Exit signal creates an Alertcondition that can be picked up by the TradingView Alarm system.
TIP: Remember this type of Trading technique only works well in a trending market. Do not try to trade this technique in a ranging/flat market.
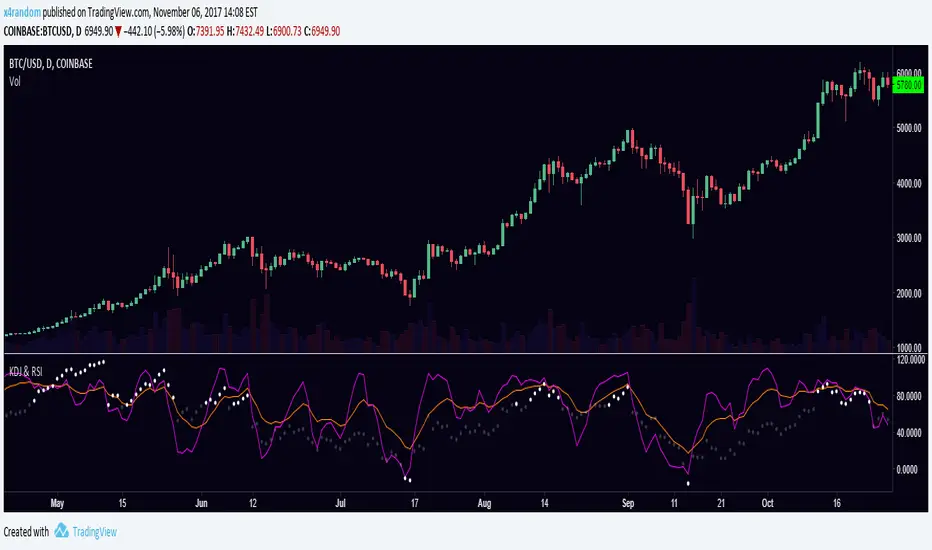
KDJ & RSIRSI and KDJ indicator combined.
KDJ: Buy when J (purple) is going up and and crossing KD (orange) from below. Sell vise versa.
RSI: Overbought when RSI is over 70, oversold when RSI is under -10.
RSI comboTraditional RSI plus the adx and moment of rsi to show when rsi is exhausted (thick green and red line). Red and green circle indicate the swing (350 swing indicator) and the top and botton colored bars come from RSS (relative spread strength). When rsi is red or green and circles show up is a good signal. Do the last check at the bar color, better if wait until become silver

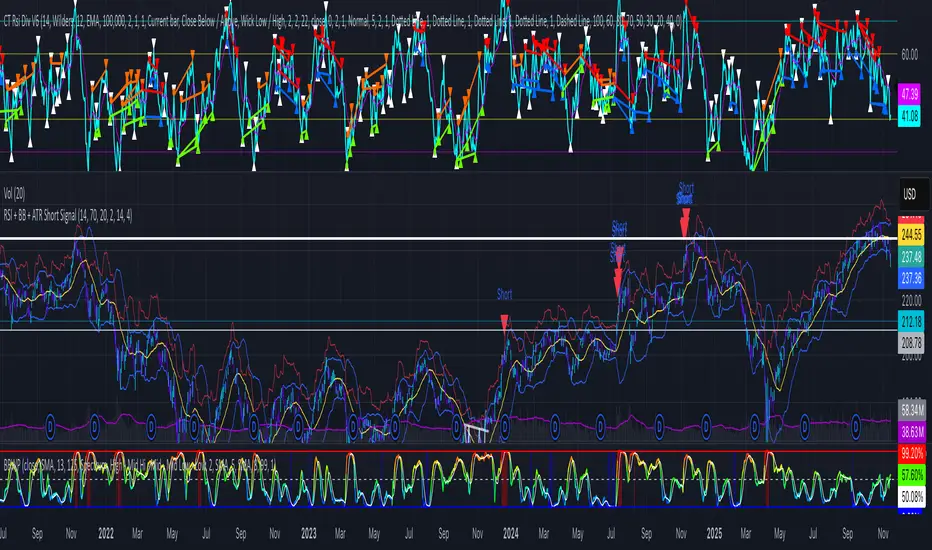
RSI + BB + ATR Short SignalThis indicator highlights potential short setups by combining three conditions:
RSI Overbought – RSI must be above the user-defined level.
Bollinger Band Break – Price must close above the upper Bollinger Band.
Extended Above the 5-Day Low – Price must sit at least X ATR above the recent 5-day low.
When all conditions line up on the same bar, the script plots a red triangle above the candle and triggers an alert so you can act immediately.
To help visualise the setup, the script also plots the full Bollinger Bands (upper, middle, lower) and a line showing the threshold of 5-day-low + ATR × multiplier. You can adjust RSI length and level, Bollinger settings, ATR length, and the ATR multiplier.
RSI Divergence on 15-Minute with 5min & 1min CorrectionUse the 5 minute chart to identify 15 minute rsi divergence, showing the 5 and 1 min rsi levels "participating in" the correction of the 15 minute rsi divergence.

RSI Divergence on 1-Hour with 15min & 5min CorrectionUsing the 15 minute timeframe, rsi divergence on the hourly chart is "tracked" by the 15 and 5 min rsi levels to watch for the hourly chart's rsi correction.

RSI MTF Table - 12 Pairs (1,5,15)
The relative strength index measures the speed and magnitude of an asset's recent price changes. Therefore, it is considered a momentum indicator in technical analysis. Essentially, the RSI is the ratio of the days an asset's value increases to decreases over a given period.
Generally speaking, if the RSI is around 50, we do not expect strong movements. RSI above 65 or below 35 are areas we expect. In this context, this chart and the general momentum in 1-5-15 minutes allow us to quickly determine the parity we will trade. It is useful for intraday trading and scalping.

RSI BandsPlots adaptive ATR bands around the 27-EMA to approximate RSI overbought and oversold zones directly on price. Provides a clean visual reference for RSI-like extremes without displaying the RSI itself.

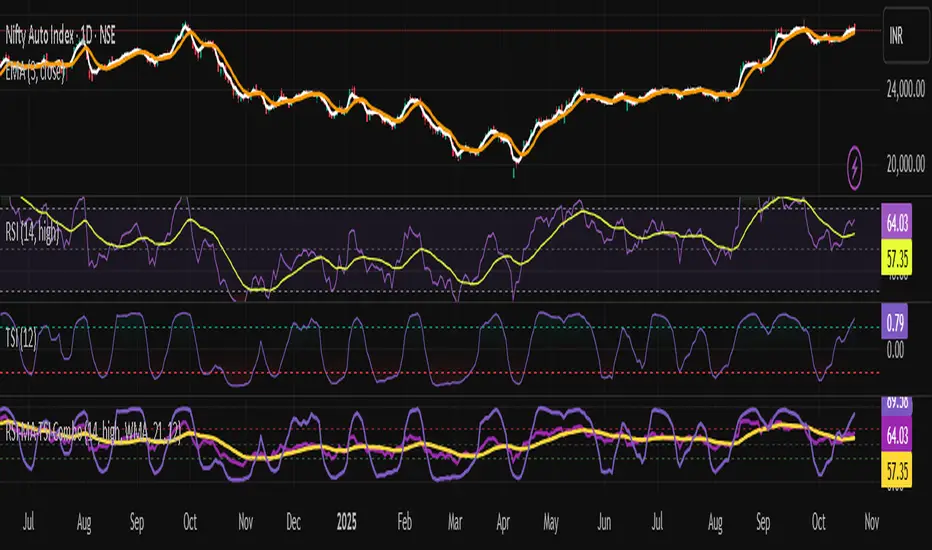
RSI + TSI✅ All 3 indicators in one pane
✅ RSI and RSI MA with standard zones (30, 50, 70)
✅ TSI scaled to 0–100 range for alignment with RSI
✅ Color-coded TSI fill for quick trend recognition (green = bullish, red = bearish)
✅ Compatible with TradingView v6
RSI Prior DayLagged RSI indicator showing the prior day's RSI(14) value for easy divergence detection. Plot it alongside current RSI to spot bullish/bearish signals. Ideal for swing traders scanning for momentum shifts.