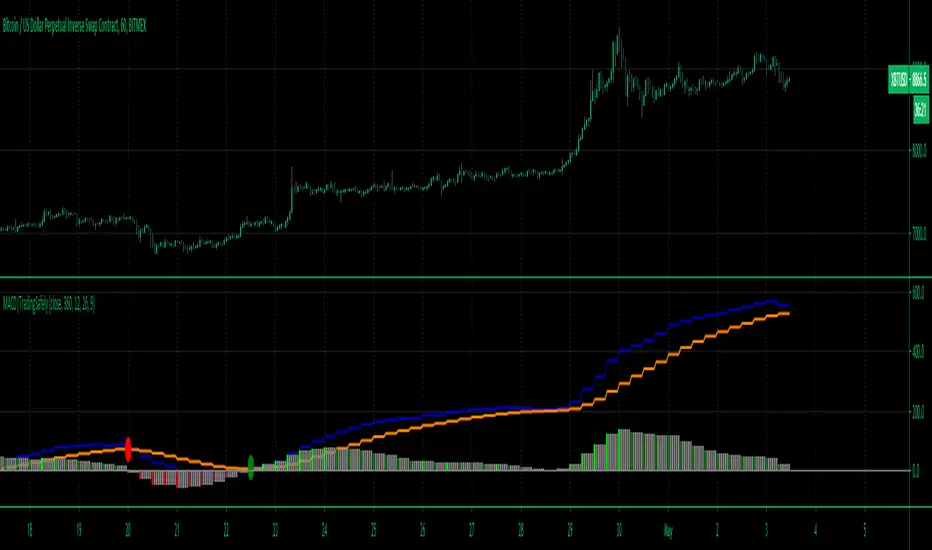
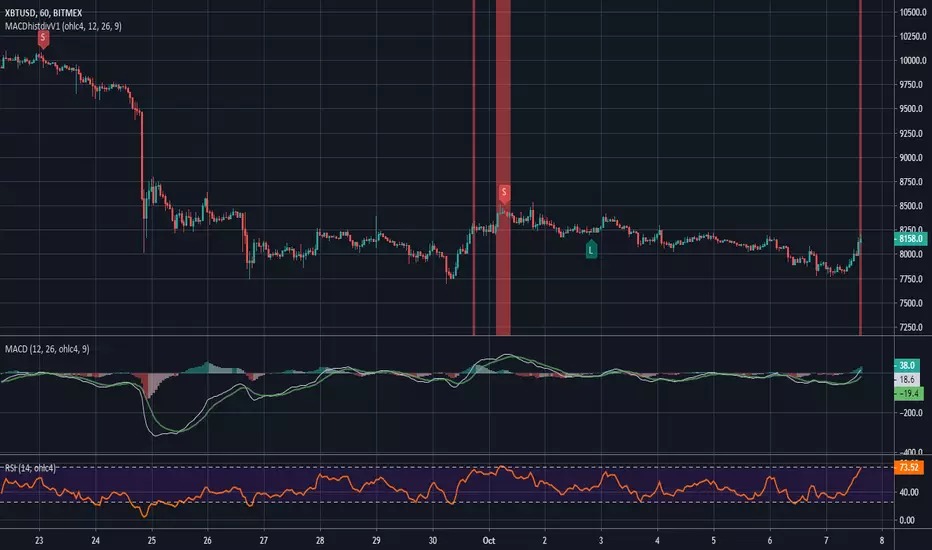
Trading Safely Multiple Time Frame Dynamic MACDOur Multi-Time frame MACD is a Zero-Lag (well near zero-lag) We make this claim because MACD utilizes Moving Averages and as you know moving averages are lagging indicators.
For our MACD we utilize The McGinley Dynamic which looks like a moving average line yet it is a smoothing mechanism for prices that turns out to track far better than any moving average.
The McGinley Dynamic minimizes price separation, price whipsaws and hugs prices much more closely.
The McGinley Dynamic does this automatically as this is a factor of the formula.
Because of the calculation, the Dynamic Line speeds up in down markets as it follows prices yet moves more slowly in up markets.
As traders we want to be quick to sell in a down market, yet ride an up market as long as possible.
How to Trade.
It best to use lower time frame charts and higher time frame MACD settings such as 1H chart and 6H (360min) MACD time frame
You can input any time frame in minutes from 1 min to 1440 minutes on the MACD settings.
1H = 60
2H = 120
3H = 180
4H = 240
6H = 360
12H = 720
24H = 1440
Week = W
Month = M
You can set alerts for bullish and bearish crossovers which are good indications of a potential entry into a long or short trade.
shout out to lonesometheblue for inspiration.
Pesquisar nos scripts por "macd"
ANN BTC MTF Golden Cross Period MACDHi, this is the MACD version of the ANN BTC Multi Timeframe Script.
The MACD Periods were approximated to the Golden Cross values.
MACD Lengths :
Signal Length = 25
Fast Length = 50
Slow Length = 200
Regards.

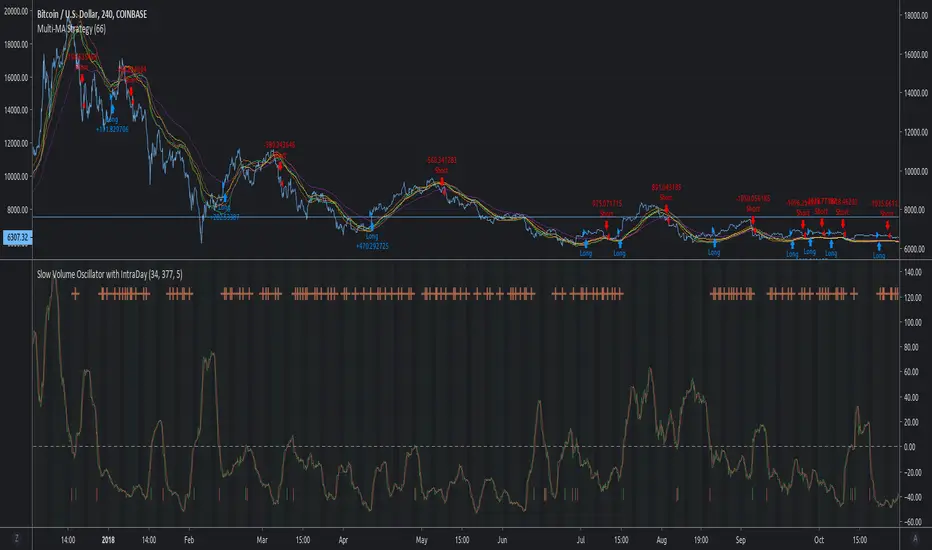
MACD Multi-MA StrategyThis script applies the average of each major MA (SMA, RMA, EMA, WVMA, WMA) to the MACD formula.
The logic is simple. When all 5 MA's are in agreement in direction, then then script will notify users of change.
I posted this as a strategy to help show how logic does in back test. If you use my simple yet effective solution to find take profit locations, you can blow this back testing out of the water!!!
To set alerts simply turn script into study
//@version=2
study(title="MACD Multi-MA Study", overlay=false)
src = close
len1 = input(8, "FAST LOOKBACK")
len2 = input(144, "SLOW LOOKBACK")
/////////////////////////////////////////////
length = len2-len1
ma = vwma(src, length)
plot(ma, title="VWMA", color=lime)
length1 = len2-len1
ma1 = rma(src, length1)
plot(ma1, title="RMA", color=purple)
length2 = len2-len1
ma2 = sma(src, length2)
plot(ma2, title="SMA", color=red)
length3 = len2-len1
ma3 = wma(src, length3)
plot(ma3, title="WMA", color=orange)
length4 = len2-len1
ma4 = ema(src, length4)
plot(ma4, title="EMA", color=yellow)
long = ma > ma and ma1 > ma1 and ma2 > ma2 and ma3 > ma3 and ma4 > ma4
short = ma < ma and ma1 < ma1 and ma2 < ma2 and ma3 < ma3 and ma4 < ma4
alertcondition(long == true, title='MACD LONG SIGNAL', message='MACD LONG!')
alertcondition(short == true, title='MACD SHORT SIGNAL', message='MACD SHORT!')
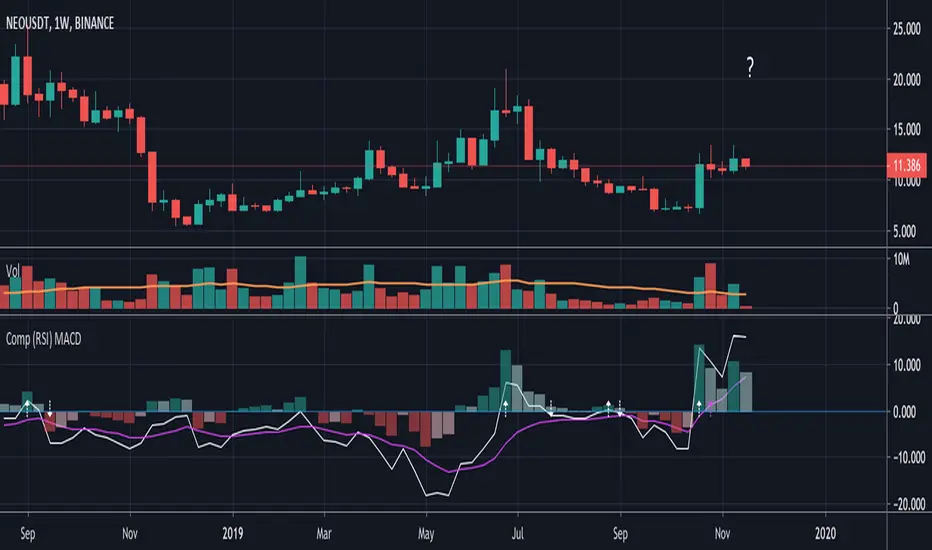
Compare (RSI) MACDHere I've created an indicator which can be used together with my "Compare (RSI) Ticker 3x" Indicator.
It makes it much easier to see the movements between the "RSI Ticker 1" and "RSI Ticker 2/3".
- The white line is the "MACD" of Ticker 1, which is the difference between the "RSI Ticker 1" and "RSI Ticker 2/3".
- The purple line is the "Signal" line, an EMA of the "MACD". (Length is adjustable)
- The "0-line" is the "RSI Ticker 2/3" line, when Ticker 2 is chosen, this will be blue coloured, when Ticker 3 is chosen it will be red.
Because 2 MACD in 1 indicator is way too messy, you only can choose the comparison against Ticker 2 OR Ticker 3.
- In "Settings" > "Inputs" you can enable/disable the second or third Ticker
(If Ticker 2 is enabled, Ticker 3 is disabled and vice versa)
- The second Ticker has multiple choices
- The third you can type any Ticker you want, for example CRYPTOCAP:BNB, BINANCE:ETHUSDT, NASDAQ_DLY:NDX or whatever,
just start typing and you'll see the possibilities (You also can choose between "Cryptocurrencies", "Index", "Forex", ...)
- When the "MACD" crosses the "0-line", arrows will appear, white ones for "MACD", purple ones for the "Signal" line.
- The "Histogram" makes it easier to see the difference between "MACD" and "Signal" line.
- The source of this indicator is adjustable
- When the second chosen Ticker is the same as the first Ticker, of course you will be seeing lines
(because there is no difference between the 2 Tickers, the EMA is visible though)
If you use both "Compare (RSI) Ticker 3x" AND "Compare (RSI) MACD", of course be aware that you have the same Ticker 2 or 3 in each indicator!
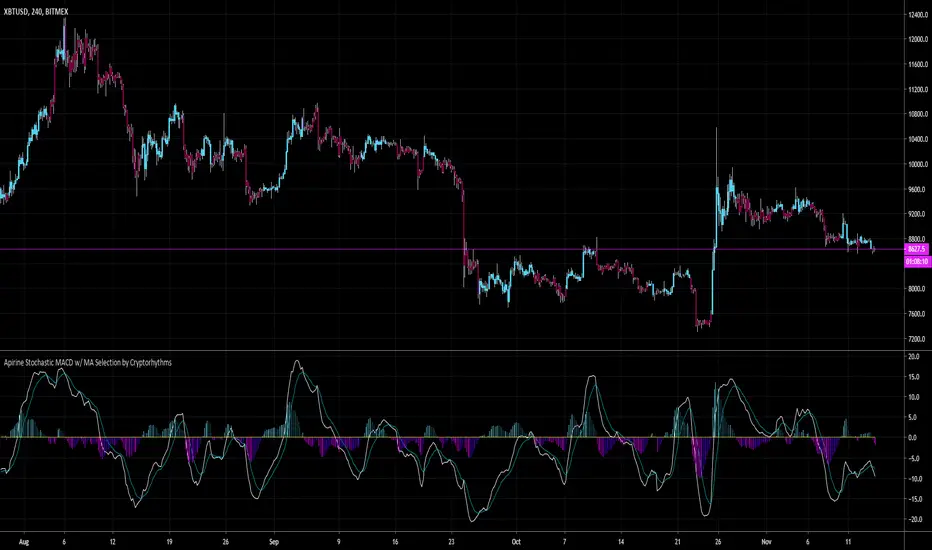
Apirine Stochastic MACD w/ MA Selection by Cryptorhythms📊 Apirine Stochastic MACD w/ MA Selection by Cryptorhythms
Intro
Had to re-release due to moderation.
This happens to be my first open source indicator, hope you all enjoy it!
Description
This indicated is ported from November 2019 issue of TASC. “The Stochastic MACD Oscillator” in this issue, author Vitali Apirine introduces a new indicator created by combining the stochastic oscillator and the MACD . He describes the new indicator as a momentum oscillator and explains that it allows the trader to define overbought and oversold levels similar to the classic stochastic but based on the MACD .
Options
-You can enable bar coloration for trade state (signal conditions setup in the "long" and "short" variables).
-You can choose histogram or columns for the convergence/divergence display.
-You can turn on/off and adjust the overbought / oversold zones.
-You can choose what type of moving average to use in the calculation from a small selection of options. This gives you more flexibility to adapt the indicator to your needs.
👍 We hope you enjoyed this indicator and find it useful! We post free crypto analysis, strategies and indicators regularly. This is our 70th script on Tradingview!
🤐Check my Signature for other information
MACD and RSI divergence by Rexio v2Hi everyone!
I wrote this indicator for intraday trading and it cannot be use only by itself you need to at least draw some S/R lines to make it useful. It is based at MACD histogram and gives signal when it sees divergence on MACD/RSI/MACD's Histogram (or all at once - settings) when macd's histogram switchs trend. Im using it to playing with a trend most of the time looking for hidden divergence at higher time frame and after that looking for regular divergence at lower time frame.
Im not a computer programist nor professional trader so it is only for educational purposes only.

MACD histogram divergence by Rexio v1Hi everyone!
I wrote this indicator for intraday trading and it cannot be use only by itself you need to at least draw some S/R lines to make it useful. It is based at MACD histogram and gives signal when it sees divergence on MACD's Histogram when macd's histogram switchs trend. Im using it to playing with a trend most of the time looking. It highlights candles which can give good singnals to play with a trend (its based on ema200 and RSI overbought and oversold zones).
Im not a computer programist nor professional trader so it is only for educational purposes only.
Assassin Multi MACDBEST MACD WITH auto muilti timeframe。
with cross notify and alert.
Auto show MACD and SIGNAL in multi timeframe.
The best macd indicator I've made.
FOR free to use.

Koby's ZLEMA MACD and KAMA signalUsing zero lag ema for MACD line, and using KAMA for MACD's signal line.
Test version.
This has MACD and signal cross alert, and 0 line alert.
BOSS Zero-Lag Dynamic MACDTHE BEST FOREX, BINARY OPTIONS, AND CRYPTO INDICATORS FOR TRADINGVIEW.COM
Our MACD is a Zero-Lag (well near zero-lag) We make this claim because MACD utilizes Moving Averages and as you know moving averages are lagging indicators.
For our MACD we utilize The McGinley Dynamic which looks like a moving average line yet it is a smoothing mechanism for prices that turns out to track far better than any moving average.
The McGinley Dynamic minimizes price separation, price whipsaws and hugs prices much more closely.
The McGinley Dynamic does this automatically as this is a factor of the formula.
Because of the calculation, the Dynamic Line speeds up in down markets as it follows prices yet moves more slowly in up markets.
As traders we want to be quick to sell in a down market, yet ride an up market as long as possible.
Source: Investopedia.com
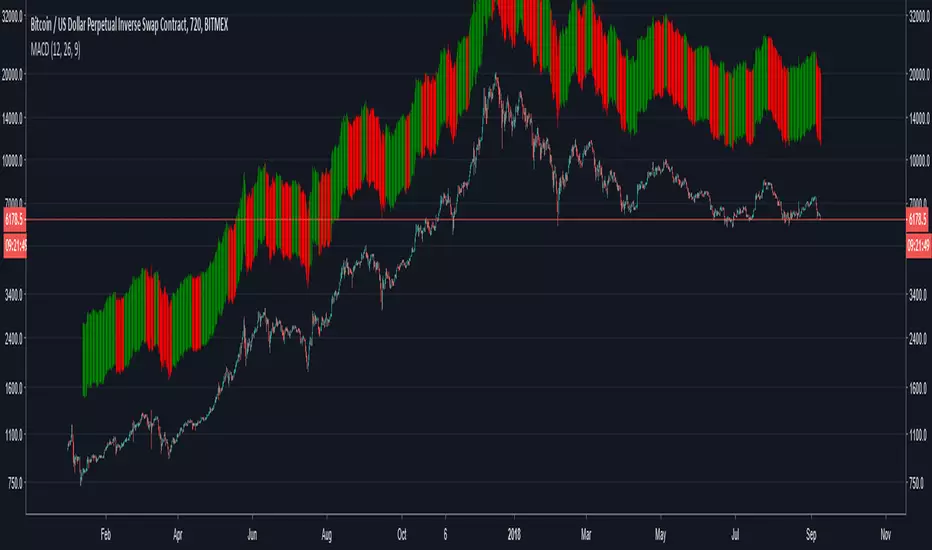
Chart Image shows conventional MACD on Bottom and BOSS Zero-Lag Dynamic MACD on top
Available at: bosscripts.com

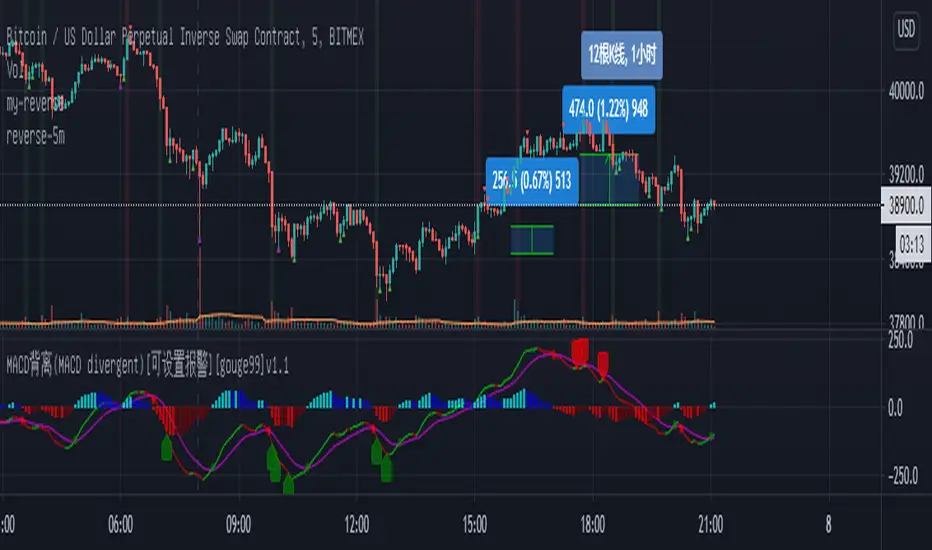
MACD背离(MACD divergent)[公开版][gouge99]注意:背离意味着做反转交易,所以入场要求很高,但是背离一般的收益风险比很大
MACD背离:收盘价创造新高或者新低,但是macd却没有出新高或者新低
计算原理:根据历史K线长度(默认90根K线)来判断收盘价的高低极值和macd的高低极值来进行比较判断
建议使用:
1.在震荡调整行情中,在支撑和压力位附近出现的突然的趋势K线,一般是假突破
2.在趋势末端,一般还会有一次缓慢的测试趋势极点的行情,一般这是趋势反转进入震荡的开始
3.结合其他形态如双顶,头肩,pin bar
4.结合其他指标如stoch随机指标做反转
5.推荐在1h, 30m, 15m级别中使用,5m也可以使用,但是最好背离计算长度设置大一点 比如150
Awesome Oscillator and MACD Histogram by SierraPilot (Lemrin)This is an indicator I stole from Lemrin. I added the plots for the MACD line and the Signal line and also changed the AO and MACD histo to an area plot. MACD = red and green. AO = blue and yellow. Green over top of Blue = possible reversal. Green overlaid over blue = uptrend. Yellow over top of Red = downside reversal possible. Yellow overlaid over Red = downtrend in progress. MACD and Signal line behave normally. Thanks to Lemrin for the majority of the code.

Multi-indicador MACD/RSI/volumen en ventanaComplemento para el otro indicador que ya publiqué.
En esta caso añado las gráficas de MACD, RSI y volumen en una sola ventana.
El problema para esto es el escalado de las gráficas del MACD y el volumen para que entren en una escala de 1 a 100 para lo que tomo los máximos y mínimos de 500 velas (este valor se puede cambiar).
Adicionalmente, coloreo el macd de verde cuando sobrepasa a la señal o de rojo cuando va por debajo y lo mismo con el rsi.
Añado el volumen a todo esto, también escalado.

GBPJPY MACD 1min Long OnlyThis MACD indicator uses two lines for long and sell long. It also uses a MACD indicator line with a historian. When the MACD historian crosses over the buy line, a long signal is executed. When the MACD historian crosses over the sell line, a close entry is signal is executed. There is a also a built in stop loss and you can adjust the buy and sell lines accordingly.
This does not repaint and I use it for autoview with an alert to autotrade this strategy.

GBPUSD MACD 1min Long OnlyThis MACD indicator uses two lines for long and sell long. It also uses a MACD indicator line with a historian. When the MACD historian crosses over the buy line, a long signal is executed. When the MACD historian crosses over the sell line, a close entry is signal is executed. There is a also a built in stop loss and you can adjust the buy and sell lines accordingly.
This does not repaint and I use it for autoview with an alert to autotrade this strategy.

EURUSD MACD 1 min Long OnlyThis MACD indicator uses two lines for long and sell long. It also uses a MACD indicator line with a historian. When the MACD historian crosses over the buy line, a long signal is executed. When the MACD historian crosses over the sell line, a close entry is signal is executed. There is a also a built in stop loss and you can adjust the buy and sell lines accordingly.
This does not repaint and I use it for autoview with an alert to autotrade this strategy.

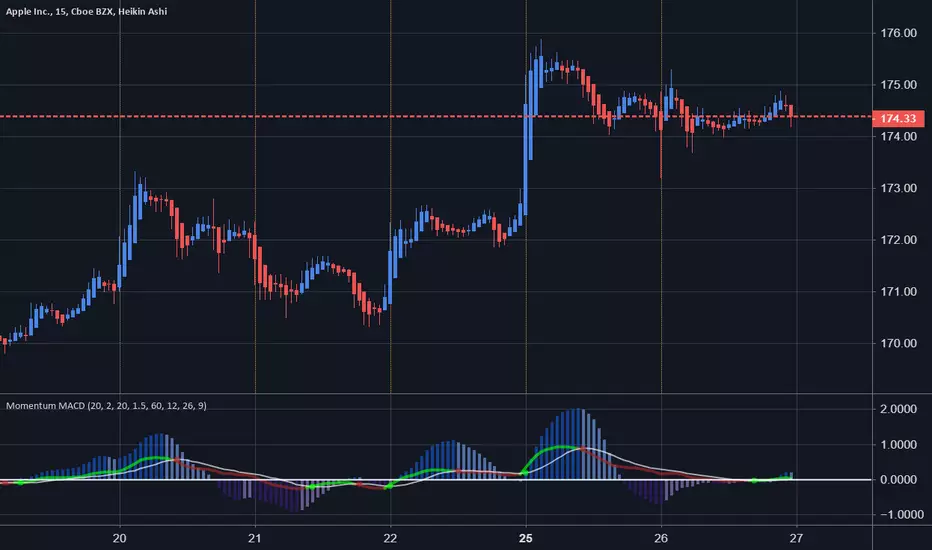
Price Momentum MACD Signal Multiple Timeframes Momentum Indicator with MACD Signal & Base Line
MACD Histogram Indicator is good , but what if you can use momentum as improving it ?
Well Using Price Momentum and the MaCD we can achieve a better action price strategy.
Based upon @LazyBear and @ChrisMoody indcators respectively.
Adjustable MACD Alert V2This indicator can be used as an alarm for MACD crossing and uses EMA to distinguish the quality of alerts.
Buy1 and Sell1 are crossings outside the EMA and the color is brighter, the rest of the cross is darker.
If u don't want to distinguish alerts, u can use the original Adjustable MACD Alert as following.

DiNapoli MACD (DEMA)DiNapoli MACD (DEMA) is a custom indicator used in the context of identifying the position of strong hands.
This version of the indicator includes the following features :
Show/Hide the Oscillation Lines
Highlight Cross with Signal Line
Show Zero Line
Show Divergences (experimental)
For convenience it also includes Custom Alerts . Now it is possible to get alerts on:
Alert on MACD Cycle Shift
Bullish MACD Signal
Bearish MACD Signal
Possible Regular Divergence
Possible Regular Bullish Divergence
Possible Regular Bearish Divergence
This indicator is meant to be used by professional traders.
If you would like to subscribe , please send me a private message.

9 x TimeFrames: MACD + Histogram, Logarithmic***Up to 9 MACD's with fixed timeframes***
-Simply enter your MACD settings, and which timeframes you would like to see.
-Settings stick regardless of viewing resolution (within reason)
-Enter 0 to disable if you want less than 9 MACD's
***Logarithmic option for consistency over long timeframes***
***Layered histogram, can be disabled, adjusted vertically***

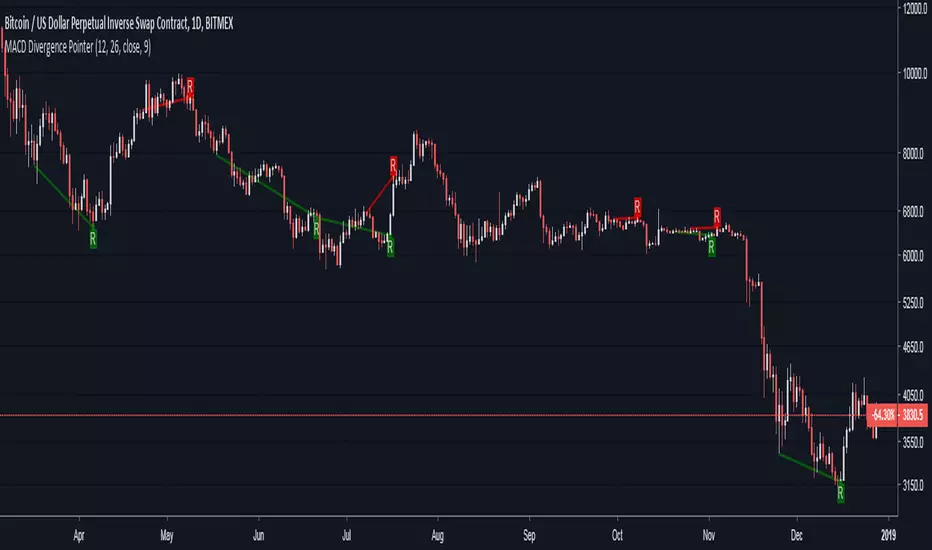
MACD Divergence PointerThis script points regular and optionally hidden types of bullish and bearish MACD divergences on the chart by drawing the divergence lines and optionally labels.
Hidden divergence is disabled by default, it can be enabled over settings window.
Regular divergence is enabled by default, it can be disabled over settings window.
There is an option to display the price channel additionally.
MACD settings are exactly same with the embedded MACD indicator's
MACD Cross-over ZonesBars above candles are color-based on MACD, when it turns bearish it will paint red and when it turns bullish green. Since the bars are painted above the candlestick one can see the price divergence in here too.
When one sees price is making higher highs or inside flat neutral momentum while MACD is in red, means weakness of selling.
When one sees price is making lower highs and MACD is red, it's signal that bears show strength and holding a short has more confidence until MACD turns green.
When one sees price is making lower highs and MACD is green, it's sign of weakness in buying, be cautious for reversal while holding (a long).
When one sees price is making higher highs and MACD is green, it's a sign of strength, one will be more confident holding a long until MACD turns red.
MACD SIGNAL & MACD DIVERGENCE REGULAR & HIDDEN You can find 2 signals Fast MACD Cross Signal and Divergence MACD Signal Hidden & Regular
like comment and i will add your user name to try it
Enjoy xD
