MACD Bands - Multi Timeframe [TradeMaster Lite]We present a customizable MACD indicator, with the following features:
Multi-timeframe
Deviation bands to spot unusual volatility
9 Moving Average types
Conditional coloring and line crossings
👉 What is MACD?
MACD is a classic, trend-following indicator that uses moving averages to identify changes in momentum. It can be used to identify trend changes, overbought and oversold conditions, and potential reversals.
👉 Multi-timeframe:
This feature allows to analyze the same market data on multiple time frames, which can be in help to identify trends and patterns that would not be visible on a single time frame. When using the multi-timeframe feature, it is important to start with the higher time frame and then look for confirmation on the lower time frames. This will help you to avoid false signals. Please note that only timeframes higher than the chart timeframe is supported currently with this feature enabled. Might get updated in the future.
👉 Deviation bands to spot unusual volatility:
Deviation bands are plotted around the Signal line that can be in help to identify periods of unusual volatility. When the MACD line crosses outside of the deviation bands, it suggests that the market is becoming more volatile and a strong trend may form in that direction.
👉 9 Moving Average types can be used in the script. Each type of moving average offers a unique perspective and can be used in different scenarios to identify market trends.
SMA (Simple Moving Average): This calculates the average of a selected range of values, by the number of periods in that range.
SMMA (Smoothed Moving Average): This takes into account all data available and assigns equal weighting to the values.
EMA (Exponential Moving Average): This places a greater weight and significance on the most recent data points.
DEMA (Double Exponential Moving Average): This is a faster-moving average that uses a proprietary calculation to reduce the lag in data points.
TEMA (Triple Exponential Moving Average): This is even quicker than the DEMA, helping traders respond more quickly to changes in trend.
LSMA (Least Squares Moving Average): This moving average applies least squares regression method to determine the future direction of the trend.
HMA (Hull Moving Average): This moving average is designed to reduce lag and improve smoothness, providing quicker signals for short-term market movements.
VWMA (Volume Weighted Moving Average): This assigns more weight to candles with a high volume, reflecting the true average values more accurately in high volume periods.
WMA (Weighted Moving Average): This assigns more weight to the latest data, but not as much as the EMA.
👉 Conditional coloring :
This feature colors the MACD line line based on it's direction and fills the area between the MACD line and Deviation band edges to highlight the potential volatility and the strength of the momentum. This can be useful to identify when the market is trending strongly and when it is in a more neutral or choppy state.
👉 MACD Line - Signal Line crossings:
This is a classic MACD trading signal that occurs when the MACD line crosses above or below the signal line. Crossovers can be used to identify potential trend reversals. This can be a bullish or bearish signal, depending on the direction of the crossover.
👉 General advice
Confirming Signals with other indicators:
As with all technical indicators, it is important to confirm potential signals with other analytical tools, such as support and resistance levels, as well as indicators like RSI, MACD, and volume. This helps increase the probability of a successful trade.
Use proper risk management:
When using this or any other indicator, it is crucial to have proper risk management in place. Consider implementing stop-loss levels and thoughtful position sizing.
Combining with other technical indicators:
The indicator can be effectively used alongside other technical indicators to create a comprehensive trading strategy and provide additional confirmation.
Keep in Mind:
Thorough research and backtesting are essential before making any trading decisions. Furthermore, it's crucial to have a solid understanding of the indicator and its behavior. Additionally, incorporating fundamental analysis and considering market sentiment can be vital factors to take into account in your trading approach.
Limitations:
This is a lagging indicator. Please note that the indicator is using moving averages, which are lagging indicators.
The indicators within the TradeMaster Lite package aim for simplicity and efficiency, while retaining their original purpose and value. Some settings, functions or visuals may be simpler than expected.
⭐ Conclusion
We hold the view that the true path to success is the synergy between the trader and the tool, contrary to the common belief that the tool itself is the sole determinant of profitability. The actual scenario is more nuanced than such an oversimplification. Our aim is to offer useful features that meet the needs of the 21st century and that we actually use.
🛑 Risk Notice:
Everything provided by trademasterindicator – from scripts, tools, and articles to educational materials – is intended solely for educational and informational purposes. Past performance does not assure future returns.
Pesquisar nos scripts por "macd"

Impulse MACD buy OwlPixelDescription:
The Impulse MACD Buy Indicator, developed by OwlPixel, is a powerful trading tool for traders using TradingView's Pine Script version 5. This indicator aims to provide valuable insights for identifying potential buy signals in the market using the popular MACD (Moving Average Convergence Divergence) oscillator.
Key Features:
MACD Analysis: The indicator displays the MACD line (blue) and the signal line (orange) on the chart, helping traders assess the momentum and trend direction of an asset.
Impulse Histo: The Impulse Histo (blue histogram) visualizes the difference between the MACD line and the signal line, making it easier to spot changes in market strength and potential trend reversals.
Impulse MACD CD Signal: This histogram (maroon color) highlights the divergence between the Impulse Histo and the signal line, providing further insights into trend shifts.
Background Boxes: The indicator features three rows of different colored background boxes that represent distinct market conditions - an uptrend (light green), a downtrend (light red), and a neutral trend (light yellow).
Crossover Points: Buy signals are marked with green circles when the MACD line crosses above the signal line, suggesting potential entry points for long positions.
Demand and Supply Bars: The demand (lime/green) and supply (red/orange) bars are intensified, aiding traders in identifying possible reversal areas.
Stop Loss and Take Profit:
The Impulse MACD Buy Indicator automatically calculates Stop Loss (SL) and Take Profit (TP) levels for buy signals. The SL level is set at the highest of the last three candles, while the TP level is determined by a user-defined percentage of the closing price. This information helps traders manage risk and optimize their profit potential.
Usage:
Apply the Impulse MACD Buy Indicator to your TradingView chart by copying the provided Pine Script into the Pine Editor.
Configure the input parameters, such as the MA Length and Signal Length, to suit your trading preferences.
Observe the MACD line, signal line, and histograms to gain insights into market momentum and trends.
Identify buy signals when the MACD line crosses above the signal line, signaled by green circles.
Utilize the provided Stop Loss and Take Profit levels for risk management and exit strategies.
Please note that this indicator is for informational purposes only and should be used in conjunction with other analysis techniques to make well-informed trading decisions. Happy trading!
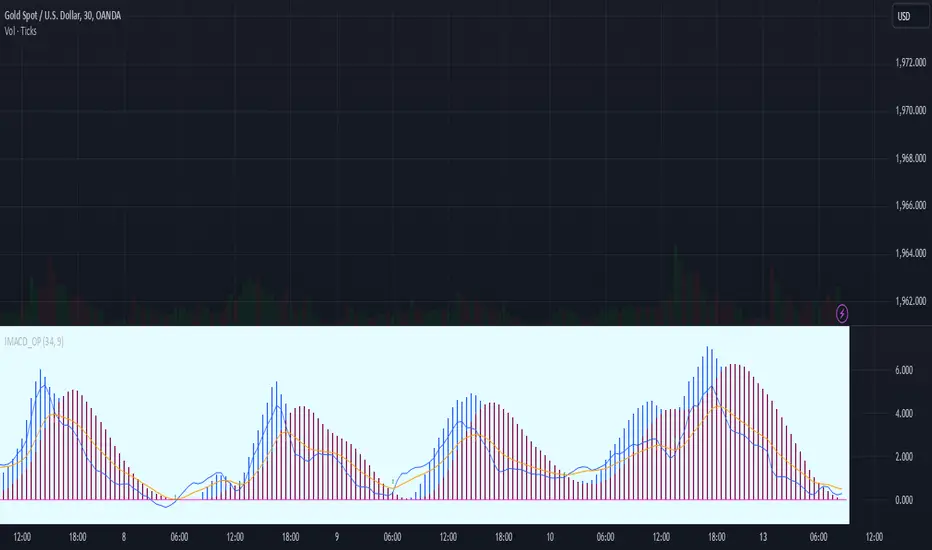
Flat & Trend MACD💡 The MACD indicator with trend interpretation and flat zones on top of the chart!
👉 This indicator clearly shows the zones of predominance of buyers, sellers, as well as zones of uncertainty (flat).
Suitable for any instrument and timeframe!
The MACD settings are standard.
The setup menu sets the length of Fast, Slow and smoothing for calculating the MACD oscillator.
🔹The indicator tracks the value of the MACD relative to zero, taking into account the uncertainty zone, which is calculated at 50% of the average value of the deviation of the MACD for a short period. This avoids most false buy and sell signals.
🔹When the MACD value is positive and goes beyond uncertainty, a buy signal appears (green triangle on the chart), when the MACD value is negative and goes beyond uncertainty, a sell signal appears (red triangle on the chart). The built-in alert gives a signal of a trend change.
Also, the trend direction is highlighted by the background color of the price channel on the chart.
🔹If the MACD value is in the zone of uncertainty of the buyer and seller, the background turns gray and an orange square appears on the chart. The built-in alert gives a signal about the beginning of the flat zone.
A scoreboard is displayed in the upper right corner, which shows the current status of the indicator and a warning about the presence of a flat.
The flat display can be disabled in the indicator settings.
The colors can be changed in the Style menu.
👉 I wish everyone a profit and be sure to follow risk management in trading!
For any questions, you can write to me in private messages or by the contacts in my signature.
===============================================
💡 Индикатор MACD с интерпретацией тренда и флэтовых зон поверх графика!
👉 Данный индикатор наглядно показывает зоны преобладания покупателей, продавцов, а также зоны неопределенности (флэт).
Подходит для любого инструмента и таймфрейма!
Параметры настройки MACD - стандартные.
В меню настройки задается длина Fast, Slow и сглаживание для расчета MACD-осциллятора.
🔹Индикатор отслеживает значение MACD относительно нуля с учётом зон неопределённости, которая расчитывается в 50% среднего значения отклонения MACD за небольшой период. Это позволяет избежать большинства ложных сигналов на покупку и продажу.
🔹Когда значение MACD является положительным и выходит за пределы неопределённости - появляется сигнал на покупку (зеленый треугольник на графике), когда значение MACD является отрицательным и выходит за пределы неопределённости - появляется сигнал на продажу (красный треугольник на графике). Встроенное оповещение дает сигнал о смене тренда.
Также направление тренда подсвечивается окраской фона ценового канала на графике.
🔹Если значение MACD находится в зоне неопределённости покупателя и продавца - фон окрашивается в серый цвет и на графике появляется оранжевый квадрат. Встроенное оповещение дает сигнал о начале зоны флэта.
В правом верхнем углу высвечивается табло, которое показывает текущий статус индикатора и предупреждение о наличии флэта.
Отображение флэта можно отключить в настройках индикатора.
Цвета можно изменить в меню "Стиль".
👉 Желаю всем профита и обязательно соблюдайте риск-менеджмент в торговле!
По любым вопросам Вы можете написать мне в личные сообщения или по контактам в моей подписи.
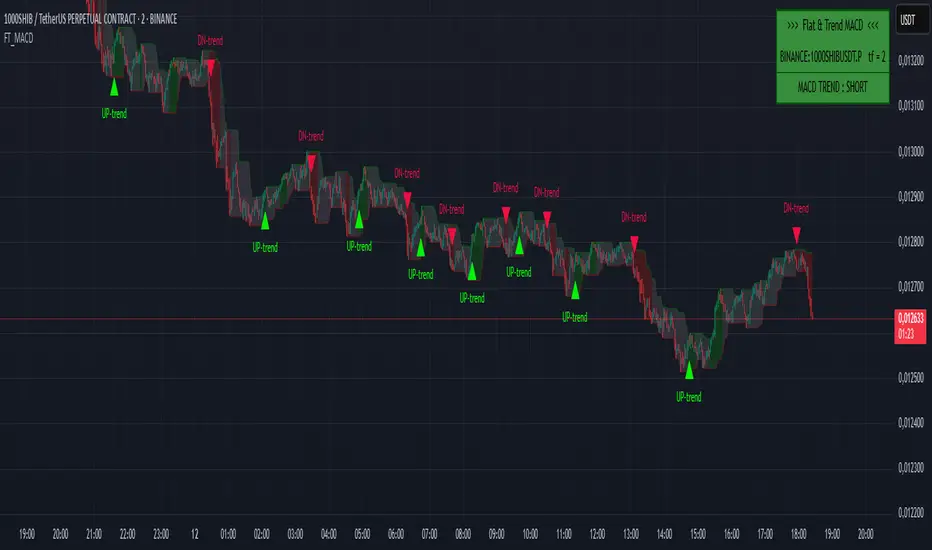
MACD Higher TimeFrameThis Pine script is an indicator called "MACD Higher TimeFrame" that calculates and displays the Moving Average Convergence Divergence (MACD) on a higher timeframe. It is designed to be used on a lower timeframe chart but show the MACD values from a specified higher timeframe.
The indicator takes several inputs, including the fast length, slow length, source data, signal smoothing length, and the types of moving averages to be used for the MACD and signal lines. The default values are set to 12, 26, the closing price, 9, and exponential moving averages (EMA) for both lines, respectively. These inputs can be modified by the user.
The script calculates the MACD and signal lines based on the specified inputs and the source data. It uses the `init_ma` function to initialize the moving average calculation based on the selected moving average type (EMA or SMA) and length.
To display the MACD and signal lines from the higher timeframe, the script utilizes the `request.security` function, fetching the values of MACD and signal lines one bar ago on the higher timeframe. It handles any gaps in data and lookahead considerations.
The script also includes a function called `int_htf_fillna`, which handles the filling of `na` (not available) values for the higher timeframe indicators. It ensures that the indicator values are carried forward if they are not available for a particular bar.
To enhance the visualization, the script includes customizable colors for the MACD line, signal line, and histogram bars. The histogram bars are styled using the `plot.style_columns` option, and their color is determined by the `color_handle_ducplicate_value` function. This function checks for duplicate values and assigns colors based on whether the indicator is rising or falling, and whether it is above or below zero.
The script also includes a zero line (color #787B86) to provide a visual reference for the zero level.
Overall, this Pine script allows users to view the MACD indicator from a higher timeframe on a lower timeframe chart, providing insights into the broader market trend.
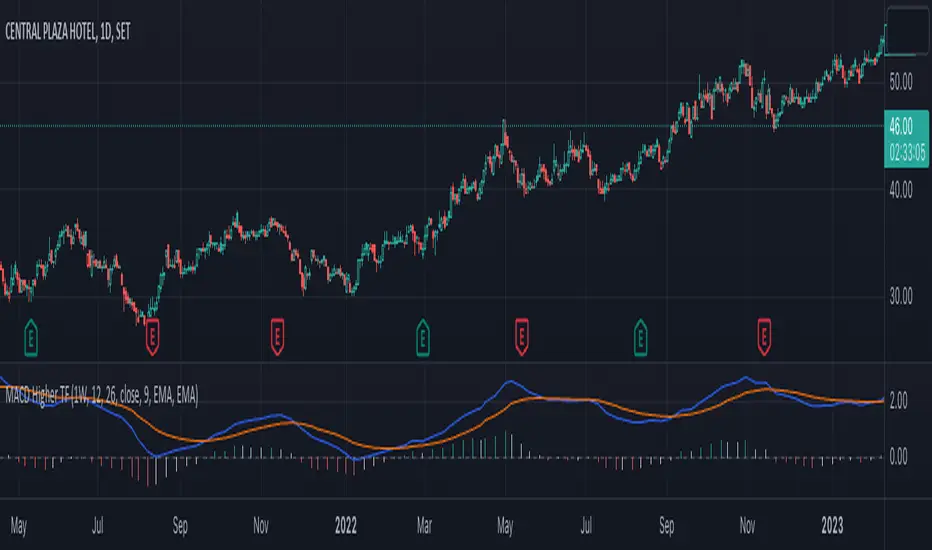
MACD Normalized [ChartPrime]Overview of MACD Normalized Indicator
The MACD Normalized indicator, serves as an asset for traders seeking to harness the power of the moving average convergence divergence (MACD) combined with the advantages of the stochastic oscillator. This novel indicator introduces a normalized MACD, offering a potentially enhanced flexibility and adaptability to numerous market conditions and trading techniques.
This indicator stands out by normalizing the MACD to its average high and average low, also factoring in the deviation of the high-low position from the mean. This approach incorporates the high and low in the calculations, providing the benefits of stochastic without its common drawbacks, such as clipping problems. As a result, the indicator becomes exceptionally versatile and suitable for various trading strategies, including both faster and slower settings.
The MACD Normalized Indicator boasts a variety of options and settings. The features include:
Enable Ribbon: Toggle the display of the ribbon accompanying the MACD Normalized, as desired.
Fast Length: Determine the movement speed of the fast line to receive advance notice of potential market opportunities.
Slow Length: Control the movement pace of the slow line for smoother signals and a comprehensive outlook on market trends.
Average Length: Specify the length used to calculate the high and low averages, providing greater control over the indicator's granularity.
Upper Deviation: Establish the extent to which the high and low values deviate from the mean, ensuring adaptability to diverse market situations.
Inner Band (Middle Deviation): Adjust the balance between the high and low deviations to create an inner band signal, giving traders a secondary level of market analysis and decision-making support.
Enable Candle Color: Enable the coloring of candles based on the MACD Normalized value for effortless visualization of trading potential.
Use Cases for the MACD Normalized Indicator
In addition to analyzing market trends and identifying potential trading opportunities, ChartPrime's MACD Normalized Indicator offers a range of applications for traders. These use cases encompass distinct trading scenarios and strategies:
Overbought and Oversold Regions
One of the key applications of the MACD Normalized Indicator is identifying overbought and oversold regions. Overbought refers to a situation where an asset's price has risen significantly and is expected to face a downturn, while oversold indicates a price drop that may subsequently lead to a reversal.
By adjusting the indicator's parameters, such as the upper and inner deviation levels, traders can set precise boundaries to determine overbought and oversold areas. When the MACD moves into the upper region, it may signal that the asset is overbought and due for a price correction. Conversely, if the MACD enters the lower region, it possibly indicates an oversold condition with the potential for a price rebound.
Signal Line Crossovers
The MACD Normalized Indicator displays two lines: the fast line and the slow line (inner band). A common trading strategy involves observing the intersection of these two lines, known as a crossover. When the fast line crosses above the slow line, it may signify a bullish trend or a potential buying opportunity. Conversely, a crossover with the fast line moving below the slow line typically indicates a bearish trend or a selling opportunity.
Divergence and Convergence
Divergence occurs when the price movement of an asset does not align with the corresponding MACD values. If the price establishes a new high while the MACD fails to do the same, a bearish divergence emerges, suggesting a potential downtrend. Similarly, a bullish divergence takes place when the price forms a new low but the MACD does not follow suit, hinting at an upcoming uptrend.
Convergence, on the other hand, is represented by the MACD lines moving closer together. This movement signifies a potential change in the trend, providing traders with a timely opportunity to enter or exit the market.
Color Changing MACDJapanese below / 日本語説明は下記
This indicator shows MACD with its colors changing based on trend strength.
The purpose of this indicator is to visually understand phases of trends, which are beginning, advancing and ending, measuring the range between MACD line and signal line.
Since MACD is originated from moving average, the range between MACD line and signal line gradually expands as trends progress while the range gets narrowed as trends come closer to the end. The indicator visualizes this characteristics.
The colors change as follows:
Green: In bullish trend, the range between MACD and signal gets expanded from previous candle, which indicates up trends continue
Purple: The range between MACD and signal gets narrowed from previous candle, which indicates trends gradually come to end.
Red: In bearish trend, the range between MACD and signal gets expanded from previous candle, which indicates down trends continue
See the chart below.
Features
Coloring
MACD line and signal line's colors change according to the logic above.
You can also fill the gap between MACD line and signal line with the same color changing logic as lines.
Signals
Golden cross and death cross signals can be displayed.
Alert
Alerts can be set when golden and death crosses occur.
---------------------
トレンドの強弱で色が変わるMACDのインジケーターです。トレンドが初期、進展期、終了期と移り変わる様子を視覚的に判断できることを目的に開発しています。
トレンドの強弱はMACDラインとシグナルラインの幅で判断します。
MACDは移動平均線を元にしたインジケーターであるため、トレンドが進展するにつれMACDラインとシグナルラインの幅は徐々に広がります。一方で、トレンドが終盤に差し掛かかるにつれ上記の幅は狭まります。インジケーターはこのMACDの特徴を色で可視化します。
色は以下の通り変化します。
緑:上昇トレンドにおいて、MACDラインとシグナルラインの幅が前のローソク足のそれよりも拡大している場合
=>トレンドの勢いが強まっていることを示唆
紫:MACDラインとシグナルラインの幅が前のローソク足のそれよりも縮小している場合
=>トレンドの勢いが弱まっていることを示唆
赤:下降トレンドにおいて、MACDラインとシグナルラインの幅が前のローソク足のそれよりも拡大している場合
=>トレンドの勢いが強まっていることを示唆
サンプルチャート
機能
色変更
上記のロジックでMACDとシグナルラインの色を変更します。また両ラインの間をラインと同じロジックで塗りつぶすことも可能です。
シグナル
ゴールデンクロスとデッドクロスでシグナルを表示
アラート
ゴールデンクロスとデッドクロスでアラートを設定可能

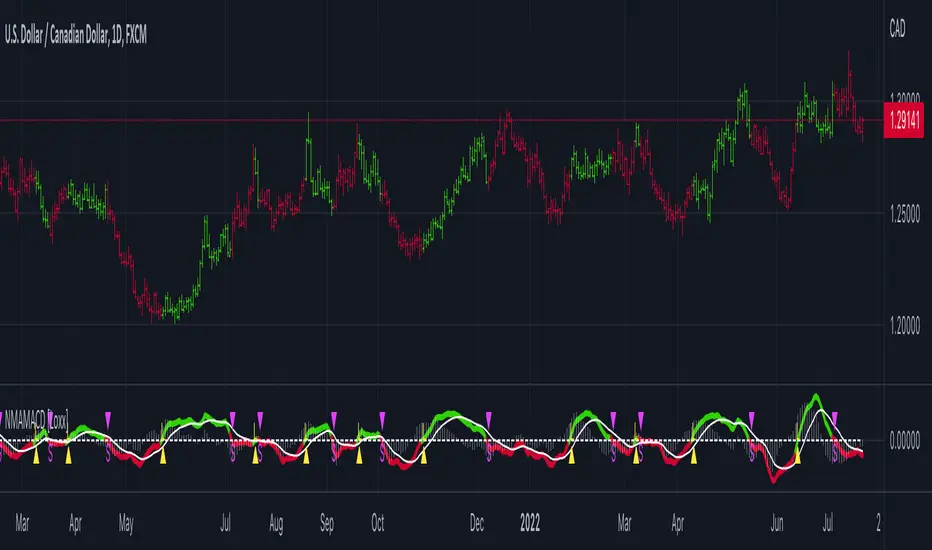
GKD-C Nyquist Moving Average (NMA) MACD [Loxx]Giga Kaleidoscope GKD-C Nyquist Moving Average (NMA) MACD is a Confirmation module included in Loxx's "Giga Kaleidoscope Modularized Trading System".
█ Giga Kaleidoscope Modularized Trading System
What is Loxx's "Giga Kaleidoscope Modularized Trading System"?
The Giga Kaleidoscope Modularized Trading System is a trading system built on the philosophy of the NNFX (No Nonsense Forex) algorithmic trading.
What is the NNFX algorithmic trading strategy?
The NNFX (No-Nonsense Forex) trading system is a comprehensive approach to Forex trading that is designed to simplify the process and remove the confusion and complexity that often surrounds trading. The system was developed by a Forex trader who goes by the pseudonym "VP" and has gained a significant following in the Forex community.
The NNFX trading system is based on a set of rules and guidelines that help traders make objective and informed decisions. These rules cover all aspects of trading, including market analysis, trade entry, stop loss placement, and trade management.
Here are the main components of the NNFX trading system:
1. Trading Philosophy: The NNFX trading system is based on the idea that successful trading requires a comprehensive understanding of the market, objective analysis, and strict risk management. The system aims to remove subjective elements from trading and focuses on objective rules and guidelines.
2. Technical Analysis: The NNFX trading system relies heavily on technical analysis and uses a range of indicators to identify high-probability trading opportunities. The system uses a combination of trend-following and mean-reverting strategies to identify trades.
3. Market Structure: The NNFX trading system emphasizes the importance of understanding the market structure, including price action, support and resistance levels, and market cycles. The system uses a range of tools to identify the market structure, including trend lines, channels, and moving averages.
4. Trade Entry: The NNFX trading system has strict rules for trade entry. The system uses a combination of technical indicators to identify high-probability trades, and traders must meet specific criteria to enter a trade.
5. Stop Loss Placement: The NNFX trading system places a significant emphasis on risk management and requires traders to place a stop loss order on every trade. The system uses a combination of technical analysis and market structure to determine the appropriate stop loss level.
6. Trade Management: The NNFX trading system has specific rules for managing open trades. The system aims to minimize risk and maximize profit by using a combination of trailing stops, take profit levels, and position sizing.
Overall, the NNFX trading system is designed to be a straightforward and easy-to-follow approach to Forex trading that can be applied by traders of all skill levels.
Core components of an NNFX algorithmic trading strategy
The NNFX algorithm is built on the principles of trend, momentum, and volatility. There are six core components in the NNFX trading algorithm:
1. Volatility - price volatility; e.g., Average True Range, True Range Double, Close-to-Close, etc.
2. Baseline - a moving average to identify price trend
3. Confirmation 1 - a technical indicator used to identify trends
4. Confirmation 2 - a technical indicator used to identify trends
5. Continuation - a technical indicator used to identify trends
6. Volatility/Volume - a technical indicator used to identify volatility/volume breakouts/breakdown
7. Exit - a technical indicator used to determine when a trend is exhausted
What is Volatility in the NNFX trading system?
In the NNFX (No Nonsense Forex) trading system, ATR (Average True Range) is typically used to measure the volatility of an asset. It is used as a part of the system to help determine the appropriate stop loss and take profit levels for a trade. ATR is calculated by taking the average of the true range values over a specified period.
True range is calculated as the maximum of the following values:
-Current high minus the current low
-Absolute value of the current high minus the previous close
-Absolute value of the current low minus the previous close
ATR is a dynamic indicator that changes with changes in volatility. As volatility increases, the value of ATR increases, and as volatility decreases, the value of ATR decreases. By using ATR in NNFX system, traders can adjust their stop loss and take profit levels according to the volatility of the asset being traded. This helps to ensure that the trade is given enough room to move, while also minimizing potential losses.
Other types of volatility include True Range Double (TRD), Close-to-Close, and Garman-Klass
What is a Baseline indicator?
The baseline is essentially a moving average, and is used to determine the overall direction of the market.
The baseline in the NNFX system is used to filter out trades that are not in line with the long-term trend of the market. The baseline is plotted on the chart along with other indicators, such as the Moving Average (MA), the Relative Strength Index (RSI), and the Average True Range (ATR).
Trades are only taken when the price is in the same direction as the baseline. For example, if the baseline is sloping upwards, only long trades are taken, and if the baseline is sloping downwards, only short trades are taken. This approach helps to ensure that trades are in line with the overall trend of the market, and reduces the risk of entering trades that are likely to fail.
By using a baseline in the NNFX system, traders can have a clear reference point for determining the overall trend of the market, and can make more informed trading decisions. The baseline helps to filter out noise and false signals, and ensures that trades are taken in the direction of the long-term trend.
What is a Confirmation indicator?
Confirmation indicators are technical indicators that are used to confirm the signals generated by primary indicators. Primary indicators are the core indicators used in the NNFX system, such as the Average True Range (ATR), the Moving Average (MA), and the Relative Strength Index (RSI).
The purpose of the confirmation indicators is to reduce false signals and improve the accuracy of the trading system. They are designed to confirm the signals generated by the primary indicators by providing additional information about the strength and direction of the trend.
Some examples of confirmation indicators that may be used in the NNFX system include the Bollinger Bands, the MACD (Moving Average Convergence Divergence), and the MACD Oscillator. These indicators can provide information about the volatility, momentum, and trend strength of the market, and can be used to confirm the signals generated by the primary indicators.
In the NNFX system, confirmation indicators are used in combination with primary indicators and other filters to create a trading system that is robust and reliable. By using multiple indicators to confirm trading signals, the system aims to reduce the risk of false signals and improve the overall profitability of the trades.
What is a Continuation indicator?
In the NNFX (No Nonsense Forex) trading system, a continuation indicator is a technical indicator that is used to confirm a current trend and predict that the trend is likely to continue in the same direction. A continuation indicator is typically used in conjunction with other indicators in the system, such as a baseline indicator, to provide a comprehensive trading strategy.
What is a Volatility/Volume indicator?
Volume indicators, such as the On Balance Volume (OBV), the Chaikin Money Flow (CMF), or the Volume Price Trend (VPT), are used to measure the amount of buying and selling activity in a market. They are based on the trading volume of the market, and can provide information about the strength of the trend. In the NNFX system, volume indicators are used to confirm trading signals generated by the Moving Average and the Relative Strength Index. Volatility indicators include Average Direction Index, Waddah Attar, and Volatility Ratio. In the NNFX trading system, volatility is a proxy for volume and vice versa.
By using volume indicators as confirmation tools, the NNFX trading system aims to reduce the risk of false signals and improve the overall profitability of trades. These indicators can provide additional information about the market that is not captured by the primary indicators, and can help traders to make more informed trading decisions. In addition, volume indicators can be used to identify potential changes in market trends and to confirm the strength of price movements.
What is an Exit indicator?
The exit indicator is used in conjunction with other indicators in the system, such as the Moving Average (MA), the Relative Strength Index (RSI), and the Average True Range (ATR), to provide a comprehensive trading strategy.
The exit indicator in the NNFX system can be any technical indicator that is deemed effective at identifying optimal exit points. Examples of exit indicators that are commonly used include the Parabolic SAR, the Average Directional Index (ADX), and the Chandelier Exit.
The purpose of the exit indicator is to identify when a trend is likely to reverse or when the market conditions have changed, signaling the need to exit a trade. By using an exit indicator, traders can manage their risk and prevent significant losses.
In the NNFX system, the exit indicator is used in conjunction with a stop loss and a take profit order to maximize profits and minimize losses. The stop loss order is used to limit the amount of loss that can be incurred if the trade goes against the trader, while the take profit order is used to lock in profits when the trade is moving in the trader's favor.
Overall, the use of an exit indicator in the NNFX trading system is an important component of a comprehensive trading strategy. It allows traders to manage their risk effectively and improve the profitability of their trades by exiting at the right time.
How does Loxx's GKD (Giga Kaleidoscope Modularized Trading System) implement the NNFX algorithm outlined above?
Loxx's GKD v1.0 system has five types of modules (indicators/strategies). These modules are:
1. GKD-BT - Backtesting module (Volatility, Number 1 in the NNFX algorithm)
2. GKD-B - Baseline module (Baseline and Volatility/Volume, Numbers 1 and 2 in the NNFX algorithm)
3. GKD-C - Confirmation 1/2 and Continuation module (Confirmation 1/2 and Continuation, Numbers 3, 4, and 5 in the NNFX algorithm)
4. GKD-V - Volatility/Volume module (Confirmation 1/2, Number 6 in the NNFX algorithm)
5. GKD-E - Exit module (Exit, Number 7 in the NNFX algorithm)
(additional module types will added in future releases)
Each module interacts with every module by passing data between modules. Data is passed between each module as described below:
GKD-B => GKD-V => GKD-C(1) => GKD-C(2) => GKD-C(Continuation) => GKD-E => GKD-BT
That is, the Baseline indicator passes its data to Volatility/Volume. The Volatility/Volume indicator passes its values to the Confirmation 1 indicator. The Confirmation 1 indicator passes its values to the Confirmation 2 indicator. The Confirmation 2 indicator passes its values to the Continuation indicator. The Continuation indicator passes its values to the Exit indicator, and finally, the Exit indicator passes its values to the Backtest strategy.
This chaining of indicators requires that each module conform to Loxx's GKD protocol, therefore allowing for the testing of every possible combination of technical indicators that make up the six components of the NNFX algorithm.
What does the application of the GKD trading system look like?
Example trading system:
Backtest: Strategy with 1-3 take profits, trailing stop loss, multiple types of PnL volatility, and 2 backtesting styles
Baseline: Hull Moving Average
Volatility/Volume: Hurst Exponent
Confirmation 1: Nyquist Moving Average (NMA) MACD as shown on the chart above
Confirmation 2: Williams Percent Range
Continuation: Fisher Transform
Exit: Rex Oscillator
Each GKD indicator is denoted with a module identifier of either: GKD-BT, GKD-B, GKD-C, GKD-V, or GKD-E. This allows traders to understand to which module each indicator belongs and where each indicator fits into the GKD protocol chain.
Giga Kaleidoscope Modularized Trading System Signals (based on the NNFX algorithm)
Standard Entry
1. GKD-C Confirmation 1 Signal
2. GKD-B Baseline agrees
3. Price is within a range of 0.2x Volatility and 1.0x Volatility of the Goldie Locks Mean
4. GKD-C Confirmation 2 agrees
5. GKD-V Volatility/Volume agrees
Baseline Entry
1. GKD-B Baseline signal
2. GKD-C Confirmation 1 agrees
3. Price is within a range of 0.2x Volatility and 1.0x Volatility of the Goldie Locks Mean
4. GKD-C Confirmation 2 agrees
5. GKD-V Volatility/Volume agrees
6. GKD-C Confirmation 1 signal was less than 7 candles prior
Volatility/Volume Entry
1. GKD-V Volatility/Volume signal
2. GKD-C Confirmation 1 agrees
3. Price is within a range of 0.2x Volatility and 1.0x Volatility of the Goldie Locks Mean
4. GKD-C Confirmation 2 agrees
5. GKD-B Baseline agrees
6. GKD-C Confirmation 1 signal was less than 7 candles prior
Continuation Entry
1. Standard Entry, Baseline Entry, or Pullback; entry triggered previously
2. GKD-B Baseline hasn't crossed since entry signal trigger
3. GKD-C Confirmation Continuation Indicator signals
4. GKD-C Confirmation 1 agrees
5. GKD-B Baseline agrees
6. GKD-C Confirmation 2 agrees
1-Candle Rule Standard Entry
1. GKD-C Confirmation 1 signal
2. GKD-B Baseline agrees
3. Price is within a range of 0.2x Volatility and 1.0x Volatility of the Goldie Locks Mean
Next Candle:
1. Price retraced (Long: close < close or Short: close > close )
2. GKD-B Baseline agrees
3. GKD-C Confirmation 1 agrees
4. GKD-C Confirmation 2 agrees
5. GKD-V Volatility/Volume agrees
1-Candle Rule Baseline Entry
1. GKD-B Baseline signal
2. GKD-C Confirmation 1 agrees
3. Price is within a range of 0.2x Volatility and 1.0x Volatility of the Goldie Locks Mean
4. GKD-C Confirmation 1 signal was less than 7 candles prior
Next Candle:
1. Price retraced (Long: close < close or Short: close > close )
2. GKD-B Baseline agrees
3. GKD-C Confirmation 1 agrees
4. GKD-C Confirmation 2 agrees
5. GKD-V Volatility/Volume Agrees
1-Candle Rule Volatility/Volume Entry
1. GKD-V Volatility/Volume signal
2. GKD-C Confirmation 1 agrees
3. Price is within a range of 0.2x Volatility and 1.0x Volatility of the Goldie Locks Mean
4. GKD-C Confirmation 1 signal was less than 7 candles prior
Next Candle:
1. Price retraced (Long: close < close or Short: close > close)
2. GKD-B Volatility/Volume agrees
3. GKD-C Confirmation 1 agrees
4. GKD-C Confirmation 2 agrees
5. GKD-B Baseline agrees
PullBack Entry
1. GKD-B Baseline signal
2. GKD-C Confirmation 1 agrees
3. Price is beyond 1.0x Volatility of Baseline
Next Candle:
1. Price is within a range of 0.2x Volatility and 1.0x Volatility of the Goldie Locks Mean
2. GKD-C Confirmation 1 agrees
3. GKD-C Confirmation 2 agrees
4. GKD-V Volatility/Volume Agrees
]█ Setting up the GKD
The GKD system involves chaining indicators together. These are the steps to set this up.
Use a GKD-C indicator alone on a chart
1. Inside the GKD-C indicator, change the "Confirmation Type" setting to "Solo Confirmation Simple"
Use a GKD-V indicator alone on a chart
**nothing, it's already useable on the chart without any settings changes
Use a GKD-B indicator alone on a chart
**nothing, it's already useable on the chart without any settings changes
Baseline (Baseline, Backtest)
1. Import the GKD-B Baseline into the GKD-BT Backtest: "Input into Volatility/Volume or Backtest (Baseline testing)"
2. Inside the GKD-BT Backtest, change the setting "Backtest Special" to "Baseline"
Volatility/Volume (Volatility/Volume, Backte st)
1. Inside the GKD-V indicator, change the "Testing Type" setting to "Solo"
2. Inside the GKD-V indicator, change the "Signal Type" setting to "Crossing" (neither traditional nor both can be backtested)
3. Import the GKD-V indicator into the GKD-BT Backtest: "Input into C1 or Backtest"
4. Inside the GKD-BT Backtest, change the setting "Backtest Special" to "Volatility/Volume"
5. Inside the GKD-BT Backtest, a) change the setting "Backtest Type" to "Trading" if using a directional GKD-V indicator; or, b) change the setting "Backtest Type" to "Full" if using a directional or non-directional GKD-V indicator (non-directional GKD-V can only test Longs and Shorts separately)
6. If "Backtest Type" is set to "Full": Inside the GKD-BT Backtest, change the setting "Backtest Side" to "Long" or "Short
7. If "Backtest Type" is set to "Full": To allow the system to open multiple orders at one time so you test all Longs or Shorts, open the GKD-BT Backtest, click the tab "Properties" and then insert a value of something like 10 orders into the "Pyramiding" settings. This will allow 10 orders to be opened at one time which should be enough to catch all possible Longs or Shorts.
Solo Confirmation Simple (Confirmation, Backtest)
1. Inside the GKD-C indicator, change the "Confirmation Type" setting to "Solo Confirmation Simple"
1. Import the GKD-C indicator into the GKD-BT Backtest: "Input into Backtest"
2. Inside the GKD-BT Backtest, change the setting "Backtest Special" to "Solo Confirmation Simple"
Solo Confirmation Complex without Exits (Baseline, Volatility/Volume, Confirmation, Backtest)
1. Inside the GKD-V indicator, change the "Testing Type" setting to "Chained"
2. Import the GKD-B Baseline into the GKD-V indicator: "Input into Volatility/Volume or Backtest (Baseline testing)"
3. Inside the GKD-C indicator, change the "Confirmation Type" setting to "Solo Confirmation Complex"
4. Import the GKD-V indicator into the GKD-C indicator: "Input into C1 or Backtest"
5. Inside the GKD-BT Backtest, change the setting "Backtest Special" to "GKD Full wo/ Exits"
6. Import the GKD-C into the GKD-BT Backtest: "Input into Exit"
Solo Confirmation Complex with Exits (Baseline, Volatility/Volume, Confirmation, Exit, Backtest)
1. Inside the GKD-V indicator, change the "Testing Type" setting to "Chained"
2. Import the GKD-B Baseline into the GKD-V indicator: "Input into Volatility/Volume or Backtest (Baseline testing)"
3. Inside the GKD-C indicator, change the "Confirmation Type" setting to "Solo Confirmation Complex"
4. Import the GKD-V indicator into the GKD-C indicator: "Input into C1 or Backtest"
5. Import the GKD-C indicator into the GKD-E indicator: "Input into Exit"
6. Inside the GKD-BT Backtest, change the setting "Backtest Special" to "GKD Full w/ Exits"
7. Import the GKD-E into the GKD-BT Backtest: "Input into Backtest"
Full GKD without Exits (Baseline, Volatility/Volume, Confirmation 1, Confirmation 2, Continuation, Backtest)
1. Inside the GKD-V indicator, change the "Testing Type" setting to "Chained"
2. Import the GKD-B Baseline into the GKD-V indicator: "Input into Volatility/Volume or Backtest (Baseline testing)"
3. Inside the GKD-C 1 indicator, change the "Confirmation Type" setting to "Confirmation 1"
4. Import the GKD-V indicator into the GKD-C 1 indicator: "Input into C1 or Backtest"
5. Inside the GKD-C 2 indicator, change the "Confirmation Type" setting to "Confirmation 2"
6. Import the GKD-C 1 indicator into the GKD-C 2 indicator: "Input into C2"
7. Inside the GKD-C Continuation indicator, change the "Confirmation Type" setting to "Continuation"
8. Inside the GKD-BT Backtest, change the setting "Backtest Special" to "GKD Full wo/ Exits"
9. Import the GKD-E into the GKD-BT Backtest: "Input into Exit"
Full GKD with Exits (Baseline, Volatility/Volume, Confirmation 1, Confirmation 2, Continuation, Exit, Backtest)
1. Inside the GKD-V indicator, change the "Testing Type" setting to "Chained"
2. Import the GKD-B Baseline into the GKD-V indicator: "Input into Volatility/Volume or Backtest (Baseline testing)"
3. Inside the GKD-C 1 indicator, change the "Confirmation Type" setting to "Confirmation 1"
4. Import the GKD-V indicator into the GKD-C 1 indicator: "Input into C1 or Backtest"
5. Inside the GKD-C 2 indicator, change the "Confirmation Type" setting to "Confirmation 2"
6. Import the GKD-C 1 indicator into the GKD-C 2 indicator: "Input into C2"
7. Inside the GKD-C Continuation indicator, change the "Confirmation Type" setting to "Continuation"
8. Import the GKD-C Continuation indicator into the GKD-E indicator: "Input into Exit"
9. Inside the GKD-BT Backtest, change the setting "Backtest Special" to "GKD Full w/ Exits"
10. Import the GKD-E into the GKD-BT Backtest: "Input into Backtest"
Baseline + Volatility/Volume (Baseline, Volatility/Volume, Backtest)
1. Inside the GKD-V indicator, change the "Testing Type" setting to "Baseline + Volatility/Volume"
2. Inside the GKD-V indicator, make sure the "Signal Type" setting is set to "Traditional"
3. Import the GKD-B Baseline into the GKD-V indicator: "Input into Volatility/Volume or Backtest (Baseline testing)"
4. Inside the GKD-BT Backtest, change the setting "Backtest Special" to "Baseline + Volatility/Volume"
5. Import the GKD-V into the GKD-BT Backtest: "Input into C1 or Backtest"
6. Inside the GKD-BT Backtest, change the setting "Backtest Type" to "Full". For this backtest, you must test Longs and Shorts separately
7. To allow the system to open multiple orders at one time so you can test all Longs or Shorts, open the GKD-BT Backtest, click the tab "Properties" and then insert a value of something like 10 orders into the "Pyramiding" settings. This will allow 10 orders to be opened at one time which should be enough to catch all possible Longs or Shorts.
█ GKD-C Nyquist Moving Average (NMA) MACD
What is the Nyquist Moving Average (NMA) MACD?
The Nyquist Moving Average (NMA) is a lesser-known type of moving average in the field of technical analysis. It is designed to reduce lag and improve the responsiveness of moving averages. The name "Nyquist" likely originates from the Nyquist-Shannon sampling theorem, which states that a continuous-time signal can be accurately reconstructed from its discrete samples if the sampling rate is at least twice the highest frequency component of the original signal. The NMA tries to apply this concept to moving averages by reducing the time lag and improving the signal's fidelity to the underlying price movement.
The Nyquist Moving Average is calculated using a primary period (nper) and a secondary period (smper). A lambda value is determined by the ratio of nper to smper, and if lambda is less than 2, it is adjusted to meet the Nyquist-Shannon sampling theorem's requirements. Then, an alpha value is calculated using lambda and nper. Two moving averages are calculated using the specified type (e.g., simple, exponential, etc.), source data, and the primary and secondary periods. The final NMA is obtained using the alpha value and the two moving averages.
While the NMA is not as popular or widely used as other types of moving averages, like the Simple Moving Average (SMA) or the Exponential Moving Average (EMA), it can still be a valuable tool for technical analysts and traders looking for a more responsive moving average with reduced lag.
As with any technical indicator, it is essential to use the Nyquist Moving Average in conjunction with other indicators and analysis methods to maximize its effectiveness and reduce the risk of false signals.
What is the MACD?
The Moving Average Convergence Divergence (MACD) is a widely used technical analysis indicator developed by Gerald Appel in the late 1970s. The MACD is a momentum oscillator that helps traders identify changes in the strength, direction, and duration of a market trend. It is calculated using exponential moving averages (EMAs) and can provide buy and sell signals based on the interaction between the MACD line, the signal line, and the MACD histogram.
The MACD consists of three components:
1. MACD Line: The MACD line is calculated by subtracting a longer-period EMA from a shorter-period EMA. Typically, a 26-day EMA is subtracted from a 12-day EMA. The resulting line represents the difference between the two EMAs and highlights the momentum of the underlying asset.
2. Signal Line: The signal line is a 9-day EMA of the MACD line. It is used to smooth out the fluctuations of the MACD line and generate trading signals based on crossovers between the MACD line and the signal line.
3. MACD Histogram: The MACD histogram is a visual representation of the difference between the MACD line and the signal line. It is plotted as vertical bars above or below the zero line, with bars above the zero line indicating positive momentum and bars below the zero line indicating negative momentum.
The MACD generates trading signals based on the interaction between the MACD line, the signal line, and the MACD histogram:
1. Bullish Crossover: A buy signal is generated when the MACD line crosses above the signal line, indicating that the short-term momentum is stronger than the long-term momentum and suggesting a potential upward move in the asset's price.
2. Bearish Crossover: A sell signal is generated when the MACD line crosses below the signal line, indicating that the short-term momentum is weaker than the long-term momentum and suggesting a potential downward move in the asset's price.
3. Histogram Divergence: The MACD histogram can also provide signals based on divergences between the histogram and the asset's price. A bullish divergence occurs when the asset's price forms a lower low while the histogram forms a higher low, suggesting a potential reversal to the upside. A bearish divergence occurs when the asset's price forms a higher high while the histogram forms a lower high, suggesting a potential reversal to the downside.
It is essential to use the MACD in conjunction with other technical analysis tools and methods to increase the reliability of the signals and reduce the risk of false signals. Additionally, the MACD is a lagging indicator, meaning it is based on historical data and may not always provide timely signals.
What is the Nyquist Moving Average (NMA) MACD
This indicator uses the Nyquist Moving averge in the MACD caculation instead of the typical EMA.
Requirements
Inputs
Confirmation 1: GKD-V Volatility / Volume indicator
Confirmation 2: GKD-C Confirmation indicator
Continuation: GKD-C Confirmation indicator
Solo Confirmation Simple: GKD-B Baseline
Solo Confirmation Complex: GKD-V Volatility / Volume indicator
Solo Confirmation Super Complex: GKD-V Volatility / Volume indicator
Stacked 1: None
Stacked 2+: GKD-C, GKD-V, or GKD-B Stacked 1
Outputs
Confirmation 1: GKD-C Confirmation 2 indicator
Confirmation 2: GKD-C Continuation indicator
Continuation: GKD-E Exit indicator
Solo Confirmation Simple: GKD-BT Backtest
Solo Confirmation Complex: GKD-BT Backtest or GKD-E Exit indicator
Solo Confirmation Super Complex: GKD-C Continuation indicator
Stacked 1: GKD-C, GKD-V, or GKD-B Stacked 2+
Stacked 2+: GKD-C, GKD-V, or GKD-B Stacked 2+ or GKD-BT Backtest
Additional features will be added in future releases.

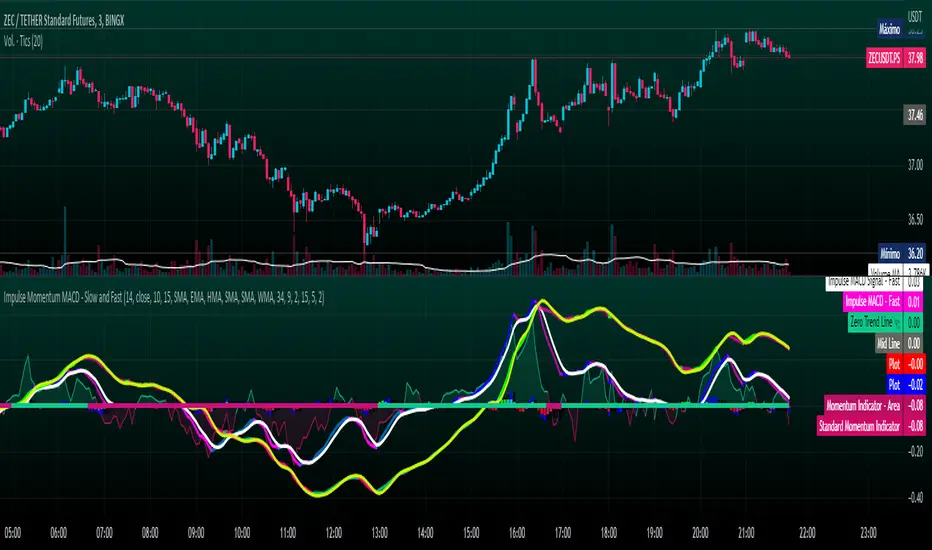
Impulse Momentum MACD - Slow and FastImpulse Momentum MACD - Slow and Fast
The Momentum indicator is a technical indicator that measures the speed and strength of the price movement of a financial asset. This indicator is used to identify the underlying strength of a trend and predict potential changes in price direction, when the indicator crosses the zero line, it can signal a change of direction in the price trend.
On the other hand, the MACD is an indicator used to identify the trend and strength of the market and shows the difference between two exponential moving averages ( EMA ) of different periods. The MACD is commonly used to determine the direction of an asset's price trend.
COPOSITION AND USE OF THE INDICATOR
This script is an implementation of the Impulse Momentum MACD indicator with two variations: slow and fast. It uses a combination of the Momentum indicator and the Moving Average Convergence/Divergence (MACD) indicator to identify trend reversals and momentum changes in an asset's price.
The combination of both indicators can help traders identify market entry and exit opportunities. The Impulse Momentum MACD is a Modified MACD, it is formed by filtering the values in a range of Modifiable Moving Averages by calculating their high and low ranges,This indicator has two parts: a slow part and a fast part. The slow part uses input values for the lengths of the moving averages and the length of the signal for the MACD indicator. The fast part uses different input values for the lengths of the moving averages. Also, each part has its own set of line colors and histogram colors for easy visualization.
The script also includes inputs to choose the type of moving average to use (SMA, EMA, etc.), the lookback period, the colors for the histogram lines and bars, and a zero trend line (also known as a horizontal trend line). ).
* Highest performing custom settings for the zero trend line. For Operations of:
- One Minute: Trend Line Time Frame = Five Minutes.
- Three Minutes: Trend Line Time Frame = Fifteen Minutes.
- Five Minutes: Trend Line Time Frame = Thirty Minutes.
- Fifteen Minutes: Trend Line Time Frame = Sixty Minutes.
Rules For Trading
🔹 Bullish:
* The Zero Horizontal Trend Line should be in Green Color.
* The Slow Histogram Bar should be in Green Color.
* The Fast Histogram Bar must be in Blue or Black Color or No Bar Appears.
* The Momentum Line or Momentum Area must be in Green Color.
crosses:
- When the Impulse Momentum MACD Slow line crosses the Impulse Momentum MACD Slow signal line upwards.
- When the Impulse Momentum MACD Fast line crosses the Impulse Momentum MACD Fast signal line upwards.
- Note 1: A Position is Opened when the condition of any of the aforementioned crossovers is met.
- Note 2: If the two aforementioned crossings anticipate the condition of the Zero Horizontal Tendency Line because it is in Red; A position is only opened immediately when the Zero Horizontal Trend line turns Green.
🔹 Bearish:
* The Zero Horizontal Trend Line should be in Red Color.
* The Slow Histogram Bar should be in Red Color.
* The Fast Histogram Bar must be in Blue or Black Color or No Bar Appears.
* The Momentum Line or Momentum Area must be in Red Color.
crosses:
- When the Impulse Momentum MACD Slow line crosses the Impulse Momentum MACD Slow signal line downwards.
- When the Impulse Momentum MACD Fast line crosses the Impulse Momentum MACD Fast signal line downwards.
- Note 1: A Position is Opened when the condition of any of the aforementioned crossovers is met.
- Note 2: If the two aforementioned crossings anticipate the condition of the Zero Horizontal Tendency Line because it is Green, an immediate position is only opened when the Zero Horizontal Tendency line turns Red.
This script can be used in different markets such as forex, indices and cryptocurrencies for analysis and trading. However, it is important to note that no trading strategy is guaranteed to be profitable, and traders should always conduct their own research and risk management.
Self Optimizing MACD [Starbots]Self Optimizing MACD Strategy. (non-repainting)
Script constantly tests 15 MACD combinations for maximum profitability and trades based on the best performing combination.
You will notice that signal lines switch sometimes, this is when the strategy optimizes to the better combination and change plots, strategy is dynamic.
There are a lot of black - shadow lines, this are the signals that are not currently active, but script keeps checking and valuating every one of them on every bar close. I recommend using dark mode chart for better view.
MACD /Signal lines in Blue/ Orange are the best performing combination and active at the moment.
*Histogram bars are always displayed based on the default MACD setting (12,26,9) - to keep the script running fast and smoothly. It's not changing plots unlike MACD /Signal lines.
-Turn on MACD Profit Dashboard and spot the worst performing combination to change it and get the better performance overall.
-Backtesting Range - backtest within your desired time window. Example: 'from 01/01/2020 to 01/01/2023'
-Optimizing range - you can decrease the amount of bars/data for optimizing script. This way you can keep it up to date to more recent market by selecting optimizing range to optimize it just from the recent 3-6months of data for example. Strategy before this selected range will normally trade (backtest) based on the first MACD parameters in your menu (12,26,9 by default) if you turn this on.
*I recommend 'Optimizing Range' turned off actually, use max amount of available bars in your history for optimization
- Strategy is trading on the bar close without repaint. You can trade Long-Sell or Long- Short. Alerts available.
- Turn on Profit Calendar for better overview of how your strategy performs monthly/annualy
- Recommended Sources : close, hl2 , hlc3, hlcc4 (when scalping/day trading and market is uptrending good, you can use 'volume' as a source, comes in handy)
- Recommended TF : 30s, 3min, 5min, 10min, 1h, 2h, 4h, 8h, 1d (low timeframes works good if you have no fees like Binance currently do on BTC for example otherwise you probably want to use 1h+ chart)
- MACD parameters : pre-set MACD combinations are very good and common in trading world, you don't need to change them, but you can do it at free will
- Notes window : add your custom comments in or save your webhook message text inside here for later use.
- Trading Session: in a session, you have to specify the time range for every day. It will trade only within this window and close trades when it's out. Session from 9am to 5pm will look like that: 0900-1700 or 7am to 4:30pm 0700-1630. After the colon, you can specify days of the week for your trading session. 1234567 trading all days, 23456 – Monday to Friday ('1 is Sunday here'). 0000-0000:1234567 by default will trade every day nonstop. 00.00am to 00.00pm and 1234567 every day of the week for example - Cryptocurrencies.
This script is simple to use for any trader as it saves a lot of time for searching good parameters on your own. It's also self-optimizing and adjusting to the markets on the go.

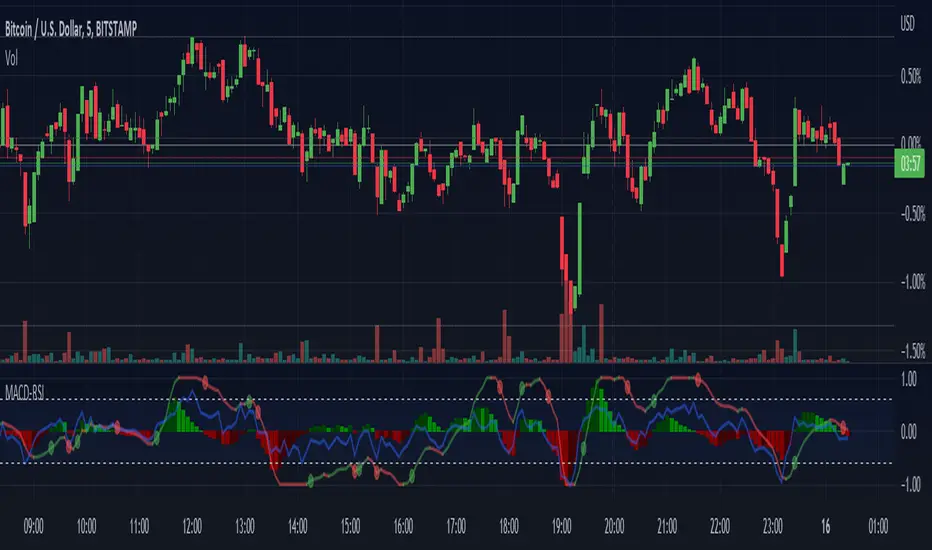
Rolling MACDThis indicator displays a Rolling Moving Average Convergence Divergence . Contrary to MACD indicators which use a fix time segment, RMACD calculates using a moving window defined by a time period (not a simple number of bars), so it shows better results.
This indicator is inspired by and use the Close & Inventory Bar Retracement Price Line to create an MACD in different timeframes.
█ CONCEPTS
If you are not already familiar with MACD, so look at Help Center will get you started www.tradingview.com
The typical MACD, short for moving average convergence/divergence, is a trading indicator used in technical analysis of stock prices, created by Gerald Appel in the late 1970s. It is designed to reveal changes in the strength, direction, momentum, and duration of a trend in a stock's price.
The MACD indicator(or "oscillator") is a collection of three time series calculated from historical price data, most often the closing price. These three series are: the MACD series proper, the "signal" or "average" series, and the "divergence" series which is the difference between the two. The MACD series is the difference between a "fast" (short period) exponential moving average (EMA), and a "slow" (longer period) EMA of the price series. The average series is an EMA of the MACD series itself.
Because RMACD uses a moving window, it does not exhibit the jumpiness of MACD plots. You can see the more jagged MACD on the chart above. I think both can be useful to traders; up to you to decide which flavor works for you.
█ HOW TO USE IT
Load the indicator on an active chart (see the Help Center if you don't know how).
Time period
By default, the script uses an auto-stepping mechanism to adjust the time period of its moving window to the chart's timeframe. The following table shows chart timeframes and the corresponding time period used by the script. When the chart's timeframe is less than or equal to the timeframe in the first column, the second column's time period is used to calculate RMACD:
Chart Time
timeframe period
1min 🠆 1H
5min 🠆 4H
1H 🠆 1D
4H 🠆 3D
12H 🠆 1W
1D 🠆 1M
1W 🠆 3M
You can use the script's inputs to specify a fixed time period, which you can express in any combination of days, hours and minutes.
By default, the time period currently used is displayed in the lower-right corner of the chart. The script's inputs allow you to hide the display or change its size and location.
Minimum Window Size
This input field determines the minimum number of values to keep in the moving window, even if these values are outside the prescribed time period. This mitigates situations where a large time gap between two bars would cause the time window to be empty, which can occur in non-24x7 markets where large time gaps may separate contiguous chart bars, namely across holidays or trading sessions. For example, if you were using a 1D time period and there is a two-day gap between two bars, then no chart bars would fit in the moving window after the gap. The default value is 10 bars.
//
This indicator should make trading easier and improve analysis. Nothing is worse than indicators that give confusingly different signals.
I hope you enjoy my new ideas
best regards
Chervolino

Normalized MACD with RSI [bkeevil]This indicator normalizes the MACD and RSI indicators to a range between -1.0 and 1.0 so they can be displayed together on the same chart to save screen real-estate.
While the MACD is a good indicator to detect trend changes, in some circumstances (such as a sideways range market) it can give false signals. The MACD is more likely to give a false signal when the RSI indicator is close to the centerline than if the RSI is signaling an overbought or oversold condition. Thus the RSI indicator and MACD indicator are commonly used together.
I have included a few features found in other MACD indicators that I have found helpful:
MACD line changes color if it is rising or falling
Dots at the MACD line to signal crossovers
The MACD signal line is hidden it by default as the information it contains is redundant. Hiding the signal line makes the indicator less busy.
DB MACD TTM SQZ HistogramDB MACD TTM SQZ Histogram
What does the indicator do?
The DB MACD TTM SQZ Histogram combines the MACD with the TTM Squeeze into a single histogram. Traders may use the "Multiplier" settings to weight MACD vs. TTM SQZ. The MACD will default have a multiplier value of 2 vs. 1 for TTM SQZ. The reasoning behind the default 2:1 multiplier is to allow the faster MACD to have a strong hand in the histogram. In addition to the histogram, the indicator will display a red dot when a BB/KC squeeze (TTM SQZ) is present. The TTM SQZ uses a length of 20, BB m-factor of 2, and KC m-factor of 1.5 to match the "Mastering the Trade" squeeze. The histogram is calculated by taking the MACD histogram and the TTM SQZ histogram and first standardizing them into reasonable decimal percentages. Once standardized, each decimal percentage is then multiplied by the individual multiplier. Finally, the two values are summed into the combined histogram value. The end result is a standardized weighted combination of the MACD (faster) with the TTM SQZ (slower) histogram.
How should this indicator be used?
The DB ETHUSD MMA Indicator should be combined with other indicators as a secondary visual indicator or market buy/sell periods. The indicator is not meant to replace the MACD or TTM SQZ. Analyzing the MACD and TTM SQZ wave patterns individually is extremely useful. The indicator allows the trader to quickly obtain a combined analysis of the two indicators with a predetermined preference (multiplier) towards one vs. the other.
In other words, the indicator is very helpful when the MACD and TTM SQZ are conflicting in providing market direction. Those familiar with MACD or TTM SQZ histograms recognize there are four periods in the full cycle; growing below zero line, growing above zero line, falling above zero line, and falling below zero line. Typically a trader would look for buying opportunities when the cycle is showing "growing below zero line." and sell when the price reaches the "falling above zero line." The qualification of the wave pattern of the four periods must be reviewed before trades. If the wave is choppy, then alternative timeframes should be reviewed. Think of wake on a lake or ocean waves. Choppy is unpredictable but smooth waves are more predictable.
The red dot on the zero line would indicate that a squeeze is present in the current timeframe, building pressure. The red dot does not indicate a pressure release of up or down. Instead, it simply means the spring is being compressed. When a squeeze is present, pressure builds and may release in either direction. You can combine this indicator with BB and KC on the plot with BB (20 len, 2 m-factor) and KC (20 len, 1.5 m-factor). You can review the BB/KC outer bands to see possible breakout resistance or support when a squeeze is on. If the price is outside the BB/KC outer banks, move to a higher timeframe.
Does the indicator include any alerts?
Not Yet. Perhaps in the Future (If Desired)
Enjoy!

Nyquist Moving Average (NMA) MACD [Loxx]Nyquist Moving Average (NMA) MACD is a MACD indicator using Nyquist Moving Average for its calculation.
What is the Nyquist Moving Average?
A moving average outlined originally developed by Dr . Manfred G. Dürschner in his paper "Gleitende Durchschnitte 3.0".
In signal processing theory, the application of a MA to itself can be seen as a Sampling procedure. The sampled signal is the MA (referred to as MA.) and the sampling signal is the MA as well (referred to as MA). If additional periodic cycles which are not included in the price series are to be avoided sampling must obey the Nyquist Criterion.
It can be concluded that the Moving Averages 3.0 on the basis of the Nyquist Criterion bring about a significant improvement compared with the Moving Averages 2.0 and 1.0. Additionally, the efficiency of the Moving Averages 3.0 can be proven in the result of a trading system with NWMA as basis.
What is the MACD?
Moving average convergence divergence (MACD) is a trend-following momentum indicator that shows the relationship between two moving averages of a security’s price. The MACD is calculated by subtracting the 26-period exponential moving average (EMA) from the 12-period EMA.
The result of that calculation is the MACD line. A nine-day EMA of the MACD called the "signal line," is then plotted on top of the MACD line, which can function as a trigger for buy and sell signals. Traders may buy the security when the MACD crosses above its signal line and sell—or short—the security when the MACD crosses below the signal line. Moving average convergence divergence (MACD) indicators can be interpreted in several ways, but the more common methods are crossovers, divergences, and rapid rises/falls.
Included
Bar coloring
2 types of signal output options
Alerts
Loxx's Expanded Source Types
MTF MACD (PPO) [TANHEF]Mult-Timeframe Moving Average Convergence Divergence (MACD) and Percentage Price Oscillator (PPO) indicator that allows for viewing of 1 to 5 different Timeframes.
Brief Summary
The primary benefit of multi-timeframe indicators is getting better entries and confirmation from viewing multiple time frames at once, which can often get overlooked.
MACD shouldn't be only used by itself, it is a lot more consistent when applied in the same direction as the trend as well as multiple other things including support, resistance, and volume improve the outcomes of the MACD results.
Personally, I look for good entries on higher and lower time frames (multiple timeframes must agree with the buying or selling). For example, if a higher timeframe looks like a good long entry (MACD line is crossing up and below the zero line), then the lower timeframes should be checked to ensure they are not oversold or overextended (the MACD line must be low or below the zero), once the lower and higher timeframes are in agreeance an entry can be made.
What is Moving Average Convergence Divergence (MACD)?
Moving average convergence divergence (MACD) is a trend-following momentum indicator that shows the relationship between two moving averages of the price. The MACD is calculated by subtracting the 26-period exponential moving average (EMA) from the 12-period EMA.
What is the Percentage Price Oscillator (PPO)?
The PPO is identical to the MACD indicator, except the PPO measures percentage difference between two EMAs, while the MACD measures absolute (or dollar) difference. The PPO has the advantage of being comparable to other assets with different prices, whereas MACD readings are not comparable. For example, regardless of the asset's price, a PPO result of 10 means the short-term average is 10% above the long-term average.
A signal line can be displayed on Timeframe, including:
- MACD & Signal Line crosses (Green when MACD above Signal Line and Red when MACD below Signal Line)
- Histogram Direction (fast and slow EMA gap)
- SuperTrend for identifying trend direction (green for uptrend, red for downtrend)
- EMA Trend for identifying trend direction (above EMA = up trend and green, below EMA = down trend and red)
Cross Dots and Potential cross dots
- Green Dot, is displayed when the MACD crosses the Signal Line
- Red Dot, is displayed when the MACD crosses the Signal Line
- Yellow Dot. Potential cross up (green dot) on next bar. Displayed when if the same distance a MACD moves on a bar is applied to the next bar will cause a MACD and Signal Line Cross. This is calculated by checking if the value change of one bar is added to the current MACD value would lead to a cross on the next bar, the it is a potential up dot.
- Purple Dot. Potential cross down (red dot) on next bar. Displayed when if the same distance a MACD moves on a bar is applied to the next bar will cause a MACD and Signal Line Cross. This is calculated by checking if the value change of one bar is added to the current MACD value would lead to a cross on the next bar, the it is a potential down dot.
Best Fit Settings
- Can be applied to the MACD, Signal Line, and Histogram to re-scale (stretch) to fit them within the space of the +2 and -2 range that each timeframe is provided on this indicator.
- The lookback distance value is used to lookback a certain distance to ensure everything scaled to fit well.
Labels are displayed on the right of the indicators, including:
- a label identifying 'line indicator' is currently being displayed
- the Timeframe corresponding to each MACD or PPO indicator
- the MACD or PPO of each Timeframe

MACD Cross [Momentum & Trend Filter]This is MTF MACD crossover and crossunder, with EMA trend filter and MTF RSI overbought/oversold filter.
Guidelines:
- User can set stop loss, take profit target and risk to reward ratio in setting
- ATR Stop and ATR Multiplier are use to set stop loss and take profit levels, setting are varies depend on what you are trading, play around and find appropriate number
- Don't trade if range between stop loss and target profit are too small or if there are too many small range try to increase multiplier
- If MACD Zero Line Filter enable, detect MACD crossover only under zero line for LONG, and detect MACD crossunder only above zero line for SHORT
- If EMA Trend Filter enable, detect MACD crossover which price above EMA for LONG, and detect MACD crossunder which price below EMA for SHORT
- RSI timeframe 1-3 should not lower than chart timeframe to display Overbought and Oversold correctly
- Enable MTF Overbought and Oversold just to display red background for Overbought, and green background for Oversold
There are 3 alert options:
(For those free user which can get only 1 alert, please choose "MACD crossover & crossunder" if you want to get alert for both long and short directions)
Have fun :)

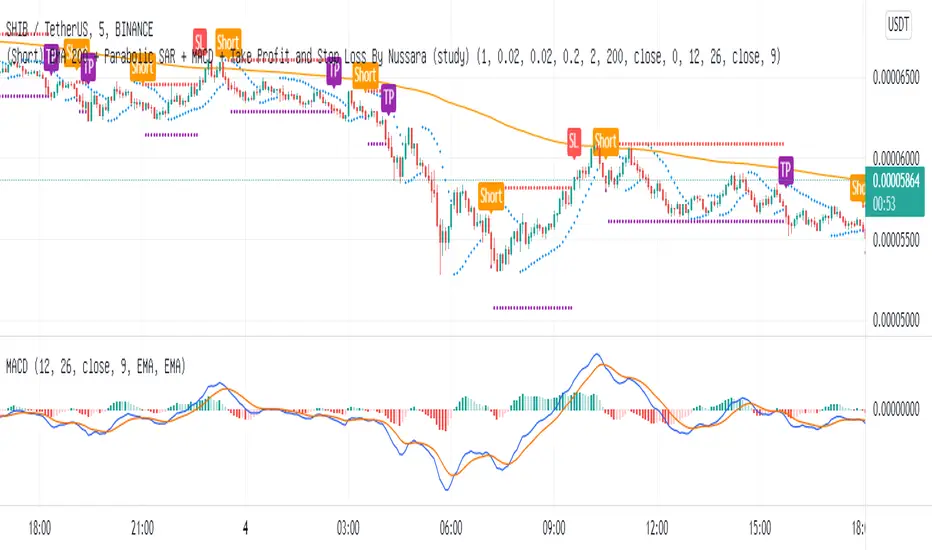
(Short) EMA200+Parabolic SAR+MACD+TP&SL By Nussara (strategy)This indicator is backtest of “ (Short) EMA 200 + Parabolic SAR + MACD + Take Profit and Stop Loss”
You can simulate trading by setting your own funds and trading fees. And you can adjust various parameter settings to get the results you want.
Exponential Moving Average
Moving averages smooth the price data to form a trend following indicator. They do not predict price direction, but rather define the current direction, though they lag due to being based on past prices. Despite this, moving averages help smooth price action and filter out the noise.
EMA=Price(t)×k+EMA(y)×(1−k)
where:
t=today
y=yesterday
N=number of days in EMA
k=2÷(N+1)
Parabolic SAR
The Parabolic SAR is a technical indicator developed by J. Welles Wilder to determine the direction that an asset is moving. The indicator is also referred to as a stop and reverse system, which is abbreviated as SAR . It aims to identify potential reversals in the price movement of traded assets.
MACD
Moving average convergence divergence ( MACD ) is a trend-following momentum indicator that shows the relationship between two moving averages of a security’s price. The MACD is calculated by subtracting the 26-period exponential moving average ( EMA ) from the 12-period EMA . The result of that calculation is the MACD line. A nine-day EMA of the MACD called the "signal line," is then plotted on top of the MACD line, which can function as a trigger for buy and sell signals. Traders may buy the security when the MACD crosses above its signal line and sell—or short—the security when the MACD crosses below the signal line.
EMA 200 + Parabolic SAR + MACD (Short) formula
1. The price closes below the ema200 line.
2. MACD Line cross down Signal Line"
3. Parabolic SAR above the bar means that it is a downtrend.
If all three are true, the indicator will have a Short signal.
Risk to Reward Ratio = 1:1
Stop loss = Parabolic SAR point.
This indicator is just a tool for technical analysis . It shouldn't be used as the only indication of trade because it causes you to lose your money. You should use other indicators to analyze together.

(Short) EMA200 + Parabolic SAR + MACD + TP&SL By Nussara (study)This strategy, I call it “ (Short) EMA 200 + Parabolic SAR + MACD + Take Profit and Stop Loss”
It’s a combination of three strategies: EMA 200, Parabolic SAR , and MACD together
Exponential Moving Average
Moving averages smooth the price data to form a trend following indicator. They do not predict price direction, but rather define the current direction, though they lag due to being based on past prices. Despite this, moving averages help smooth price action and filter out the noise.
EMA=Price(t)×k+EMA(y)×(1−k)
where:
t=today
y=yesterday
N=number of days in EMA
k=2÷(N+1)
Parabolic SAR
The Parabolic SAR is a technical indicator developed by J. Welles Wilder to determine the direction that an asset is moving. The indicator is also referred to as a stop and reverse system, which is abbreviated as SAR . It aims to identify potential reversals in the price movement of traded assets.
MACD
Moving average convergence divergence ( MACD ) is a trend-following momentum indicator that shows the relationship between two moving averages of a security’s price. The MACD is calculated by subtracting the 26-period exponential moving average ( EMA ) from the 12-period EMA . The result of that calculation is the MACD line. A nine-day EMA of the MACD called the "signal line," is then plotted on top of the MACD line, which can function as a trigger for buy and sell signals. Traders may buy the security when the MACD crosses above its signal line and sell—or short—the security when the MACD crosses below the signal line.
EMA 200 + Parabolic SAR + MACD (Short) formula
1. The price closes below the ema200 line.
2. MACD Line cross down Signal Line"
3. Parabolic SAR above the bar means that it is a downtrend.
If all three are true, the indicator will have a Short signal.
Risk to Reward Ratio = 1:1
Stop loss = Parabolic SAR point.
This indicator is just a tool for technical analysis . It shouldn't be used as the only indication of trade because it causes you to lose your money. You should use other indicators to analyze together.
พ.ย. 4
Zero-Lag MTF PSAR MACD with Bollinger Bands v1.0 [loxx]Zero-Lag MTF PSAR MACD with Bollinger Bands v1.0
This is an experimental indicator that captures PSAR movements on seven different timeframes in order to improve trend detection on the daily timeframe. The seven PSARs are averaged and then fed into a zero-lag MACD function where the average of the PSARs is the source for the slow moving average and the daily timeframe close is the sourse of the fast moving average.
Things to know:
- Dark Green Background: All seven PSAR waves are above the closes of the PSARs respective timeframes; i.e., macro trend up
- Dark Red Background: All seven PSAR waves are below the closes of the PSARs respective timeframes; i.e., macro trend down
- Histogram and bar coloration is based on the difference between close and the average of all seven PSARs
- Various color schemes included
- Indicator has neither been backtested nor tuned with a strategy backtest
How to use:
Reversal Longs and Shorts
- Bollinger Bands show movement outside of normal deviation around the zero line. Wait for MACD to reach the either side top or bottom of Bollinger Bands for reversal long and reversal short respectively
- Check that MACD has crossed over or under the Signal line; i.e., denoted with a green dot for cross up and red dot for cross down
- Check dark background colors to see where the PSAR waves are currently situated and whether PSAR wave direction has aligned on all time frames
Longs and Shorts
- Longs: Check when MACD is above the zero line and the Signal line crosses over the zero line
- Shorts: Check when MACD is below the zero line and the Signal line crosses below the zero line
Strong Confluence:
- Longs/Shorts: Whenever the MACD crosses up or crosses down over/under the Signal/Zero line while inside a candle with background highlighting
- Reversals: Whenever the MACD crosses up or crosses down over/under the Signal/Zero line while inside a candle with background highlighting and at the very top/bottom or outside the top/bottom of the Bollinger Bands
Comment below or send a PM with questions, comments, observations, or concerns.

MACD + CMF + EMA + Supertrend by TradeSmartHello everyone and welcome to our first script release!
This script is one of many upcoming scripts. This one is a test for us, how it works, how you guys like this kind of stuff, and for feedback what we should change/improve at.
SCRIPT IS OPTIMIZED FOR:
EUR/USD 30 MINUTE TIMEFRAME
Video of the Strategy:
Search for “MACD + CMF + 200 EMA + Supertrend Trading Strategy Tested 100 Times with Great Results!” on our channel.
In this video you can find the exact strategy we programmed, just one added feature: Supertrend trailing stop loss. (position gets closed once the price hits the Supertrend indicator)
Now you can modify the following:
MACD settings
Supertrend settings
EMA settings
CMF settings
We will update the script with more and more features.
The first update will be:
Modifiable risk to reward ratio.
I will make a video of how to use this indicator next week, explaining all the features and more!
Hope you like it! Don't forget to let us know what we should change or improve. Thanks, and have a great day!
STRATEGY ENTRY RULES
LONG
When CMF is above 0 and price is under EMA. Also MACD has made a double cross above the zero line (meaning one cross down and one cross up by the MACD line). Then go long!
Note:
MACD or Signal must return under 0 in order to start a new position
If either of the MACD lines touches the 0 line before entry, we skip the trade and wait for the next signal.
SHORT
When CMF is under 0 and price is under EMA. Also MACD has made a double cross under the zero line (meaning one cross up and one cross down by the MACD line). Then go short!
Note:
MACD or Signal must return under 0 in order to start a new position.
If either of the MACD lines touches the 0 line before entry, we skip the trade and wait for the next signal.
TAKE PROFIT
When price hits the exit price (calculated from stop loss with the risk ratio), then exit with 50% of the position. The other 50% will stay open until the price hits the supertrend or the base stop loss.
STOP LOSS
When price hits stop loss then exit the position. Stop loss is calculated from the Supertrend and it is a trailing one, meaning it changes based on the movement of the price.
QUANTITY TO BUY
The quantity to buy is based on the Risk Per Trade % attribute. This means that we can set how much money we want to risk on one trade. Meaning that if we lose that particular position, then a Risk Per Trade % value of our equity will be lost.
Example: if you set the Risk Per Trade % to 1 % and you have a 100$ account balance, then if you loose the trade you will loose 1$ max.

[FTA] Logarithmic MACD with Regular and Hidden DivergencesThis is a highly stable, volatility adaptive, Moving Average Convergence Divergence (MACD) that uses a modified calculation based on improved logarithmic measurements of the momentum.
1- This MACD provides the trader with most accurate detection of divergences, both regular and hidden ones, and shows them on the MACD Histogram.
2- Furthermore, the MACD/Signal divergences are also easily detectable (unlike the regular MACD which often does not provide accurate divergences; see the screenshot for comparison).
3- Finally, due to some different calculation methods, this MACD, unlike the regular MACD, is highly stable in higher time frames even in the most volatile markets (such as BTC, ETH, ADA, etc...) and thus can easily be utilized for the market prediction state in the crypto (see the screenshot for comparison).
Use it and let me know what you think about it in comparison to regular MACD!

MACD including 6-period Forecast and Divergences█ OVERVIEW
This is my personal interpretation of the classic MACD Indicator. I am using the MACD as part of my analysis, and often I was wondering when I can expect the next signal (e.g. a Histogram cross). As I had come across some EMA forecast logics on tradingview, my goal was to use the EMA forecast calculation as basis to come to a complete MACD forecast. Here is the result.
Starting point is the classic MACD which is then plotted with MACD-Line, Signal Line and Histogram. In addition to the classic MACD, a 6 period Forecast for MACD, Signal and Histogram is available and divergences can be displayed on either the Histogram or the MACD Line.
Important:
As I am considering the closing price of the current candle as the basis for the calculation, the forecast values will REPAINT. But in my opinion this is fine as this indicator will not provide direct trading signals, but more an outlook into a potential future.
█ CALCULATION LOGIC
Below some details regarding the additional functionalities:
MACD Forecast:
The MACD Forecast is mainly based on a combination of EMA Forecasts. The inspiration for this basic forecast calculation is taken from the below tradingview members:
--> EMA Forecast input taken from "Triple MA Forecast" by yatrader2
--> Forecast Bias input taken from "Fancy Bollinger Bands" by BigBitsIO
When showing the forecast, the following options are available:
- Forecast Type: Determines if the Forecast is assuming a Flat price (last values of the MA calculation are replaced by current value) or if a Linear Regression is taken
- Number of candles taken for Linear Regression Calculation
- Bias of Forecast (Based on the recent Average True Range, the forecast values are either more bullish or more bearish calculated. "Neutral" turns off this function)
- Number of ATR Periods used to calculate Bias adjustment value
- Possibility to weight the Bias via a Multiplier - Default value is 1
Based on the above inputs, the forecasted values for MACD, Signal Line and Histogram are calculated and plotted for the next 6 periods.
Divergence Detection:
Based on the default tradingview divergence script with some adjustments:
- User can select to use either Histogram or MACD Line as basis for Divergence detection (Histogram by default)
- User can select if Divergence detection should be based on the candles including Wicks or only the Candle Bodies (Wicks by default)
█ DISCLAIMER
This is an experimental indicator and I do not know if my theory works in real life. So treat this not as financial advise, but purely for entertainment and educational purposes.
I publish this code open so that everyone can re-use it or hopefully even improve it.
Let me know if you have any ideas for improvement and if it is within my coding capabilities (which to be honest are quite limited), I will try to accomodate it.
Have fun.

On Chart Reverse MACD HistogramThe On Chart Reverse MACD Histogram is a visual representational spin of the original MACD Histogram to assist the end-user in their decision making for entry, exit and risk management, as well as freeing up space for the chart.
The On Chart Reverse MACD Histogram, which very basically is a reverse engineered calculation of the MACD's Histogram gives the user a visual representation of the relationship between the current price and the MACD's Histogram on the chart instead of having to reference the MACD itself. At a glance this can then be used to visually see on the chart the closing price level needed in order to change the MACD's Histogram momentum either up or down.
Optional Settings Include:
-------------------------------
1.) Show/Hide Reverse MACD Histogram Momentum text
2.) Change the Reverse MACD Histogram Momentum information type (Basic/Detailed)
3.) Change the Reverse MACD Histogram Momentum text size
4.) Change the Reverse MACD Histogram Momentum text color
5.) Change the Reverse MACD Histogram Momentum text left margin
6.) Show/hide the Reverse MACD Histogram Momentum text currency
7.) Change the Reverse MACD Histogram Momentum text decimal value
8.) Show/hide the MACD Histogram Momentum Level
9.) Show the MACD Histogram Momentum Level As Columns *
* Please Note: When using the "Show Histogram Level As Columns" setting, in order to display this feature correctly without distorting the chart, click the ⚙️ (cog) icon in the bottom right corner of your chart and select the 'Scale Price Chart Only' option.

On Chart Reverse MACD CrossThe On Chart Reverse MACD Cross is a visual representation of the Reverse MACD Cross calculation which can be used to assist the end-user in their decision making for entry, exit and risk management, as well as freeing up space for the chart.
The On Chart Reverse MACD Cross, which very basically is a smoothed reverse engineered calculation of the MACD Signal Line gives the user a visual representation of the relationship between the current price and the MACD Signal Line instead of having to reference the MACD itself. At a glance this can then can be used to visually see on the chart the closing price level needed in order to cross the MACD either up or down.
Optional settings include:
-------------------------------
1.) Show/Hide the Reverse MACD Cross label
2.) Change the Reverse MACD Cross label text size
3.) Change the Reverse MACD Cross label left margin
4.) Show/hide the Reverse MACD Cross label currency
5.) Change the Reverse MACD Cross label decimal value
Please PM me to obtain access
