Q Impulse EntryQ Impulse Entry
A directional entry system combining impulse breakouts, Elder's momentum confirmation, and ADX trend validation. Designed for clean trade setups with multi-step filtering, entry markers, and real-time alerts.
🔧 Core Logic
This is not a basic mashup — each filter plays a distinct technical role:
1. Impulse Breakout Engine
• Detects sharp directional price breaks using ATR-adjusted dynamic zones
• Impulse window controls sensitivity to local highs/lows
2. Elder Momentum Filter
• Confirms signal using MACD histogram and EMA alignment
• Blocks entries when internal momentum contradicts price move
3. ADX Trend Strength Filter
• Uses threshold-based ADX logic to validate trend power
• Filters out noise in flat or weak markets
The system requires all three filters to agree before confirming an entry.
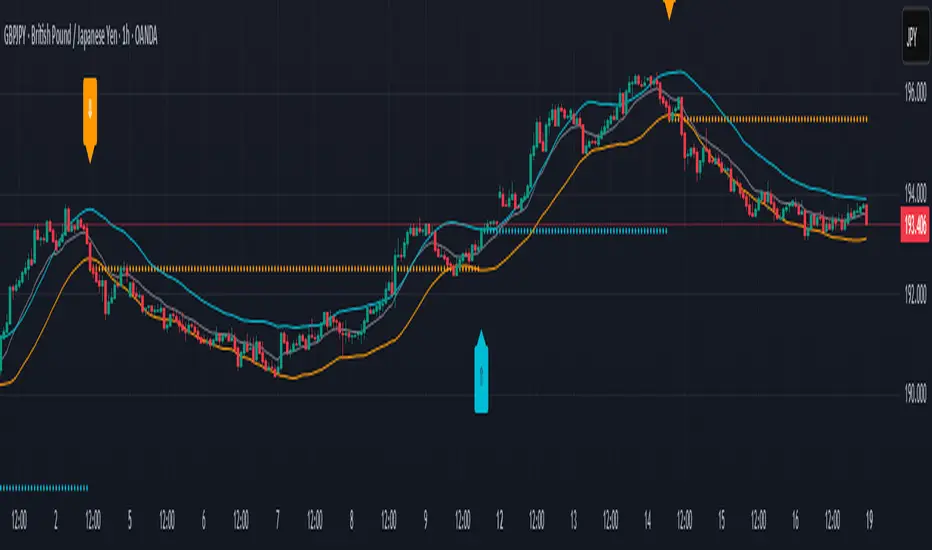
📈 Visual Feedback
• ⇑ / ⇓ arrows mark confirmed entry signals
• Colored entry dots plotted at signal price help confirm timing and aid in multi-position layering
• Impulse breakout zones and EMA are displayed for directional context
• Clean layout, no repainting, designed for real-time use
⚙️ Configurable Inputs
• Impulse Window — controls breakout signal sensitivity
• ATR Multiplier — defines width of impulse breakout zones
(Elder and ADX filters are embedded and fine-tuned)
✨ Highlights
• Triple-filter signal logic = fewer false positives
• Entry dots + arrows for visual clarity and scaling in
• Lightweight, non-repainting, and alert-ready
• Best suited for Forex and all timeframes
• Ideal for breakout, trend-following, or hybrid systems
• Built-in alerts and customizable zones
• Always apply risk management suited to your capital and strategy
Trade with clarity — stay for quality.
Indicador Pine Script®