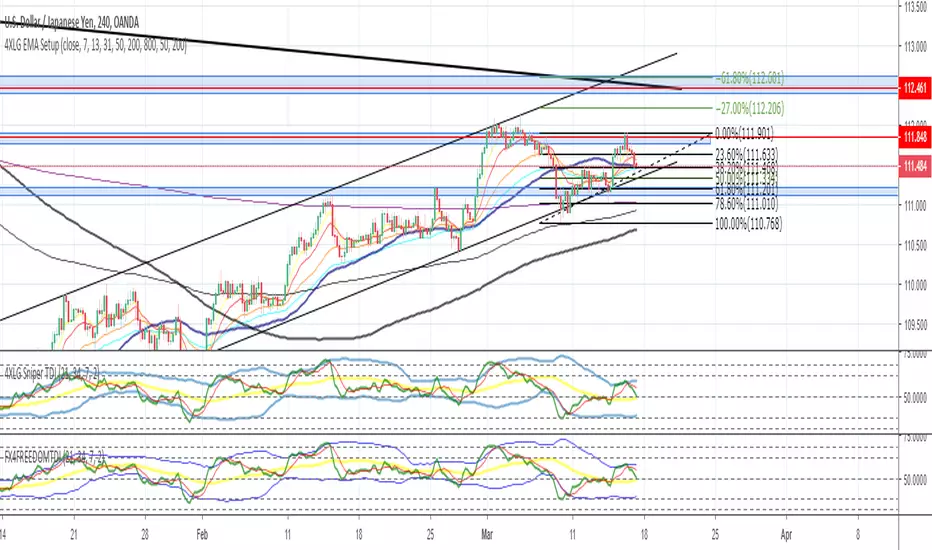
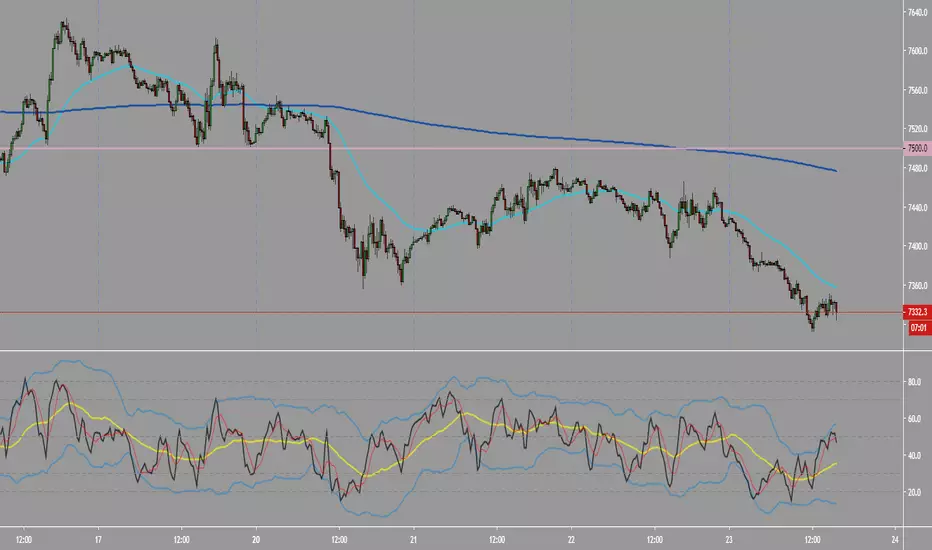
ASFX TDIThe TDI is the foundation of the ASFX systems. We use it to spot trends, RSI divergence, and beautiful entries. There are 3 components to the TDI -- the L50, the TL, and the RSI.
The L50 can be used to spot medium-term trend. When the L50 is in a certain zone since the beginning of the day, we know that the bias in the market is clear.
The TL can be used to spot short-term trend. We use the fact the slope of the TL to help us enter cleaner trades.
The RSI can be used to find divergences which may result in a reversal.
The following 3 components are nothing new to the ASFX traders. However, this version brings the RSI (At Open) to the traders as well. The new feature can be used to enter A1 trade (breakout trades) which has to take the RSI at the open into consideration whether it is above/below the L50 and the TL or not.
This can be used with the EMAs to detect trending moves as well.
Pesquisar nos scripts por "TDI"


Machine Learning: Optimal RSI [YinYangAlgorithms]This Indicator, will rate multiple different lengths of RSIs to determine which RSI to RSI MA cross produced the highest profit within the lookback span. This ‘Optimal RSI’ is then passed back, and if toggled will then be thrown into a Machine Learning calculation. You have the option to Filter RSI and RSI MA’s within the Machine Learning calculation. What this does is, only other Optimal RSI’s which are in the same bullish or bearish direction (is the RSI above or below the RSI MA) will be added to the calculation.
You can either (by default) use a Simple Average; which is essentially just a Mean of all the Optimal RSI’s with a length of Machine Learning. Or, you can opt to use a k-Nearest Neighbour (KNN) calculation which takes a Fast and Slow Speed. We essentially turn the Optimal RSI into a MA with different lengths and then compare the distance between the two within our KNN Function.
RSI may very well be one of the most used Indicators for identifying crucial Overbought and Oversold locations. Not only that but when it crosses its Moving Average (MA) line it may also indicate good locations to Buy and Sell. Many traders simply use the RSI with the standard length (14), however, does that mean this is the best length?
By using the length of the top performing RSI and then applying some Machine Learning logic to it, we hope to create what may be a more accurate, smooth, optimal, RSI.
Tutorial:
This is a pretty zoomed out Perspective of what the Indicator looks like with its default settings (except with Bollinger Bands and Signals disabled). If you look at the Tables above, you’ll notice, currently the Top Performing RSI Length is 13 with an Optimal Profit % of: 1.00054973. On its default settings, what it does is Scan X amount of RSI Lengths and checks for when the RSI and RSI MA cross each other. It then records the profitability of each cross to identify which length produced the overall highest crossing profitability. Whichever length produces the highest profit is then the RSI length that is used in the plots, until another length takes its place. This may result in what we deem to be the ‘Optimal RSI’ as it is an adaptive RSI which changes based on performance.
In our next example, we changed the ‘Optimal RSI Type’ from ‘All Crossings’ to ‘Extremity Crossings’. If you compare the last two examples to each other, you’ll notice some similarities, but overall they’re quite different. The reason why is, the Optimal RSI is calculated differently. When using ‘All Crossings’ everytime the RSI and RSI MA cross, we evaluate it for profit (short and long). However, with ‘Extremity Crossings’, we only evaluate it when the RSI crosses over the RSI MA and RSI <= 40 or RSI crosses under the RSI MA and RSI >= 60. We conclude the crossing when it crosses back on its opposite of the extremity, and that is how it finds its Optimal RSI.
The way we determine the Optimal RSI is crucial to calculating which length is currently optimal.
In this next example we have zoomed in a bit, and have the full default settings on. Now we have signals (which you can set alerts for), for when the RSI and RSI MA cross (green is bullish and red is bearish). We also have our Optimal RSI Bollinger Bands enabled here too. These bands allow you to see where there may be Support and Resistance within the RSI at levels that aren’t static; such as 30 and 70. The length the RSI Bollinger Bands use is the Optimal RSI Length, allowing it to likewise change in correlation to the Optimal RSI.
In the example above, we’ve zoomed out as far as the Optimal RSI Bollinger Bands go. You’ll notice, the Bollinger Bands may act as Support and Resistance locations within and outside of the RSI Mid zone (30-70). In the next example we will highlight these areas so they may be easier to see.
Circled above, you may see how many times the Optimal RSI faced Support and Resistance locations on the Bollinger Bands. These Bollinger Bands may give a second location for Support and Resistance. The key Support and Resistance may still be the 30/50/70, however the Bollinger Bands allows us to have a more adaptive, moving form of Support and Resistance. This helps to show where it may ‘bounce’ if it surpasses any of the static levels (30/50/70).
Due to the fact that this Indicator may take a long time to execute and it can throw errors for such, we have added a Setting called: Adjust Optimal RSI Lookback and RSI Count. This settings will automatically modify the Optimal RSI Lookback Length and the RSI Count based on the Time Frame you are on and the Bar Indexes that are within. For instance, if we switch to the 1 Hour Time Frame, it will adjust the length from 200->90 and RSI Count from 30->20. If this wasn’t adjusted, the Indicator would Timeout.
You may however, change the Setting ‘Adjust Optimal RSI Lookback and RSI Count’ to ‘Manual’ from ‘Auto’. This will give you control over the ‘Optimal RSI Lookback Length’ and ‘RSI Count’ within the Settings. Please note, it will likely take some “fine tuning” to find working settings without the Indicator timing out, but there are definitely times you can find better settings than our ‘Auto’ will create; especially on higher Time Frames. The Minimum our ‘Auto’ will create is:
Optimal RSI Lookback Length: 90
RSI Count: 20
The Maximum it will create is:
Optimal RSI Lookback Length: 200
RSI Count: 30
If there isn’t much bar index history, for instance, if you’re on the 1 Day and the pair is BTC/USDT you’ll get < 4000 Bar Indexes worth of data. For this reason it is possible to manually increase the settings to say:
Optimal RSI Lookback Length: 500
RSI Count: 50
But, please note, if you make it too high, it may also lead to inaccuracies.
We will conclude our Tutorial here, hopefully this has given you some insight as to how calculating our Optimal RSI and then using it within Machine Learning may create a more adaptive RSI.
Settings:
Optimal RSI:
Show Crossing Signals: Display signals where the RSI and RSI Cross.
Show Tables: Display Information Tables to show information like, Optimal RSI Length, Best Profit, New Optimal RSI Lookback Length and New RSI Count.
Show Bollinger Bands: Show RSI Bollinger Bands. These bands work like the TDI Indicator, except its length changes as it uses the current RSI Optimal Length.
Optimal RSI Type: This is how we calculate our Optimal RSI. Do we use all RSI and RSI MA Crossings or just when it crosses within the Extremities.
Adjust Optimal RSI Lookback and RSI Count: Auto means the script will automatically adjust the Optimal RSI Lookback Length and RSI Count based on the current Time Frame and Bar Index's on chart. This will attempt to stop the script from 'Taking too long to Execute'. Manual means you have full control of the Optimal RSI Lookback Length and RSI Count.
Optimal RSI Lookback Length: How far back are we looking to see which RSI length is optimal? Please note the more bars the lower this needs to be. For instance with BTC/USDT you can use 500 here on 1D but only 200 for 15 Minutes; otherwise it will timeout.
RSI Count: How many lengths are we checking? For instance, if our 'RSI Minimum Length' is 4 and this is 30, the valid RSI lengths we check is 4-34.
RSI Minimum Length: What is the RSI length we start our scans at? We are capped with RSI Count otherwise it will cause the Indicator to timeout, so we don't want to waste any processing power on irrelevant lengths.
RSI MA Length: What length are we using to calculate the optimal RSI cross' and likewise plot our RSI MA with?
Extremity Crossings RSI Backup Length: When there is no Optimal RSI (if using Extremity Crossings), which RSI should we use instead?
Machine Learning:
Use Rational Quadratics: Rationalizing our Close may be beneficial for usage within ML calculations.
Filter RSI and RSI MA: Should we filter the RSI's before usage in ML calculations? Essentially should we only use RSI data that are of the same type as our Optimal RSI? For instance if our Optimal RSI is Bullish (RSI > RSI MA), should we only use ML RSI's that are likewise bullish?
Machine Learning Type: Are we using a Simple ML Average, KNN Mean Average, KNN Exponential Average or None?
KNN Distance Type: We need to check if distance is within the KNN Min/Max distance, which distance checks are we using.
Machine Learning Length: How far back is our Machine Learning going to keep data for.
k-Nearest Neighbour (KNN) Length: How many k-Nearest Neighbours will we account for?
Fast ML Data Length: What is our Fast ML Length? This is used with our Slow Length to create our KNN Distance.
Slow ML Data Length: What is our Slow ML Length? This is used with our Fast Length to create our KNN Distance.
If you have any questions, comments, ideas or concerns please don't hesitate to contact us.
HAPPY TRADING!

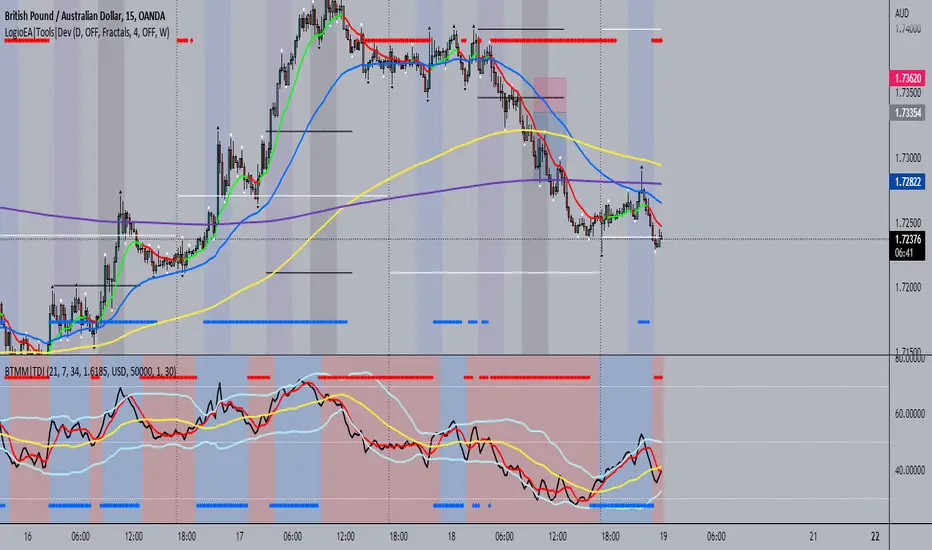
BTMM|TDIThis is the trader's dynamic index inspired by Steve Mauro's BTMM strategy.
In addition to the RSI, Trendline, Baseline, Volatility Bands I have also included additional trend biases that are painted in the background to provide more confluence when the markets break out in either direction.
For convenience, a position size calculator is included for all users to quickly calculate lot sizes on forex pairs with difference account balance currencies. The calculator works accurately on forex pairs. DO NOT USE for crypto or indices as some brokers have unique contract sizes that could not be fully incorporated into the tool.
There is also data table that displays historical values of the RSI, Trendline, Baseline, and an EMA vs Price scoring procedure that covers the current candle (t0) and up to 3 candles back. The table is meant to provide a snapshot view of either bullish or bearish dominance that can be deciphered with a quick glance.
Delorean TDI - Traders Dynamic IndexTraders Dynamic Index (for the Delorean Strategy)
===============================================================
This indicator helps to decipher and monitor market conditions related to trend direction, market strength, and market volatility.
TDI has the following components:
* Green line = RSI Price line
* Red line = Trade Signal line
* Blue lines = Volatility Bands
* Yellow line = Market Base Line
Trend Direction - Immediate and Overall:
----------------------------------------------------
* Yellow line trends up and down generally between the lines 32 & 68. Watch for Yellow line to bounces off these lines for market reversal. Trade long when price is above the Yellow line, and trade short when price is below.
Market Strength & Volatility - Immediate and Overall:
----------------------------------------------------
* Immediate = Green Line -> Strong = Steep slope up or down.
* Immediate = Green Line -> Weak = Moderate to Flat slope.
* Overall = Blue Lines -> When expanding, market is strong and trending.
* Overall = Blue Lines -> When constricting, market is weak and in a range.
* Overall = Blue Lines -> When the Blue lines are extremely tight in a narrow range, expect an economic announcement or other market condition to spike the market.
Note Credit: LazyBear - altered for the Delorean Strategy


BBA Trading - TDIMy original TDI finally republished after 20+ demands.
Thanks for the support, and sorry about what happened.


CSA 5-Step TDI+
I have found many different scripts from different authers for coding the Traders Dynamic Index and
using differetn methods / principles to color the price lines
All use the same basis to calculate the :
Volatility bands, Price line, Signal line, Market Base line
What is different in this indicator:
The color of the TDI Price Line depends on the conditions:
Price action moving up
green : Priceline is higher then Signal line
lime : Priceline is higher then Signal line AND Priceline higher then Market Base Line
Price action moving down
orange : PriceLine is lower then Signal Line
red : PriceLine is lower then Signal Line AND Priceline lower then Market Base Line
The histogram is based upon : Price Line - Signal Line
the value is plotted in the histogram with the following color coding
positive and more positive then previous bar = dark green color
positive light green color
negative and more negative then previous = dark red color
negative light red color
Bottom Window pane
The arrow up and down is based upon the SMA and the EMA to the close
Up arrow and Lime : EMA higher then previous EMA and SMA higher then previous SMA
Up arrow and green : EMA higher then previous EMA
Down arrow and Red : EMA lower then previous EMA and SMA lower then previous SMA
Down arrow and orange : EMA lower then previous EMA
Upper Window pane
The arrow up and down is based upon the Ichimoku - Conversion line and Base line to the close
Up arrow and Lime :Conversion line higher then base line and Conversion line higher then previous
Up arrow and Green :Conversion line higher then base line
Down arrow and Red : Conversion line lower then base line and Conversion line lower then previous
Down arrow and orange : Conversion line lower then base lien
Reinard Dreesmann
22 march 2019


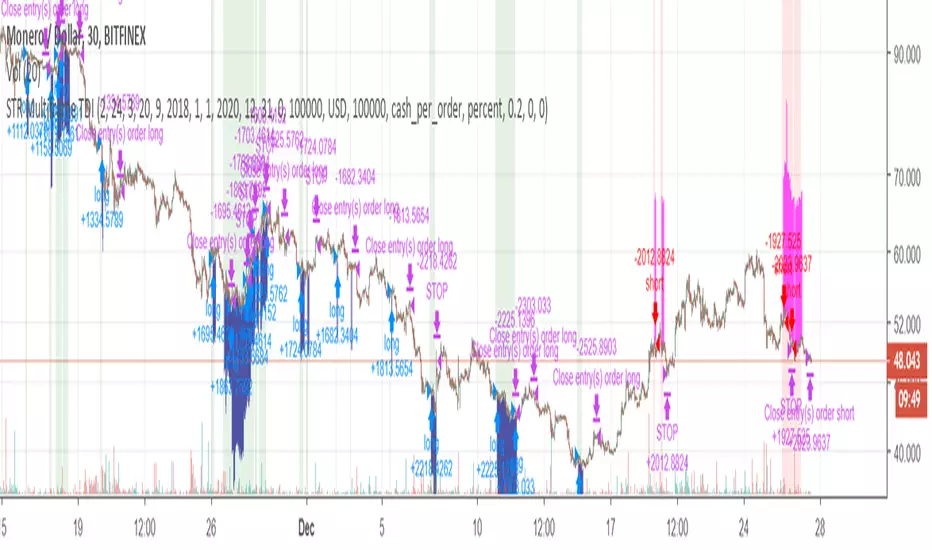
STR Multiframe TDIThis is a strategy (backtest) script which uses multitimeframe TDI (only the upper side of the indicator) to trade XMRUSD on 30 min.


TDI - Traders Dynamic Index [Aizen TDI]Green: RSI
Blue: Volatility Band
Red: Signal Line
Purple: Base Line = Price Action Bars

TDI - Traders Dynamic Index [Goldminds] with DIV RSI AlertsOriginally from Goldminds. Later modified by Jakub a Babo. I just added RSI DIV alerts. You're welcome. :)
Instruction: once you have have this indicator and press Alt + A to create alert.
TDI detector publicBarre bleu = signal achat
Barre rouge = signal vente
Zone bleu = EMA200 > EMA800
Zone rouge = EMA800 > EMA200
Exemple donné pour l'achat :
6 cas différents de signaux, 3 quand EMA200>EMA800 (zone d'achat), et 3 quand EMA800>EMA200 (achat contre tendance)
à inverser pour la vente ( RSI < 30 devient RSI > 70 pour la vente)
3 :
achat en tendance : ema 200 > ema 800 + RSI > TL et TL > L50 + cross entre les 3 courbes RSI /TL/L50 sur la bougie
achat contre tendance : ema 800 > ema 200 + RSI > TL et TL > L50 + cross entre les 3 courbes RSI /TL/L50 sur la bougie + incursion sous 30 pour le RSI dans les bougies précédentes
2 :
achat en tendance : ema200 > ema800 + RSI> TL et TL > L50 + cross haussier EMA 8 et EMA21
achat contre tendance : ema800 > ema200 + RSI> TL et TL > L50 + cross haussier EMA 8 et EMA21 + incursion sous 30 pour le RSI dans les bougies précédentes
1 :
achat en tendance : ema200 > ema 800 + RSI> TL et TL > L50 + dans les 10 dernières bougies cross EMA 8 et EMA 21 + RSI> TL et TL > L50 au moment du cross
achat contre tendance : ema800 > ema200 + RSI> TL et TL > L50 + dans les 10 dernières bougies cross EMA 8 et EMA 21 + RSI> TL et TL > L50 au moment du cross + incursion sous 30 pour le RSI dans les bougies précédentes


Traders Dynamic Index [FX4FREEDOM]TDI for the benefit of the fx4freedom members and anyone interested in further development as forex trader