M.H Pee indicatorsHere is a collection of Trend Indicators as defined by M.H Pee and presented
in various articles of the "STOCKS & COMMODITIES Magazine"
The actual implementation of the indicators here are made by: everget
I thought they were rather cool, so I have gather them here so that they easily can be tested.
My own test was made using 15 companies from the OMXS30 list
during the time period of 2016-2018, and I only went LONG.
The result was as follows (Average Net Profit , StdDev):
TDI 3.04% 5.97
TTF 1.22%. 5.73
TII 1.07% 6.2
TCF 0.32% 2.68
Would be interesting to hear what other people get as test result from these indicators.
To do that just run this strategy, and chose the indicator from the setup menu.
Pesquisar nos scripts por "TDI"

LOSS2PROFIT_TDITraders Dynamic Index (TDI) - For Naked/Blind Trader..
Combination Of MACD , Bollinger Band And RSI ..(All in One)
Indicate Market condition related to Trend Direction , Momentum and Market Volatility..
PL (Price Line)
TSL (Trade Signal Line)
MBL (Market Base Line)
UVB (Upper Volatility Band)
LVB (Lower Volatility Band)

[BACKTEST]Traders Dynamic Index Indicator Alert by JustUncleLBy request, this script is a "strategy" version of my "Traders Dynamic Index Indicator Alert" script, made available for backtesting to help find optimal trade settings for a particular asset.

Yung TDITraders Dynamic Index. Consider trading the signal line with the sentiment line for direction on the 4 hour. Adjusted the FAST MA to exponential (no repaint)

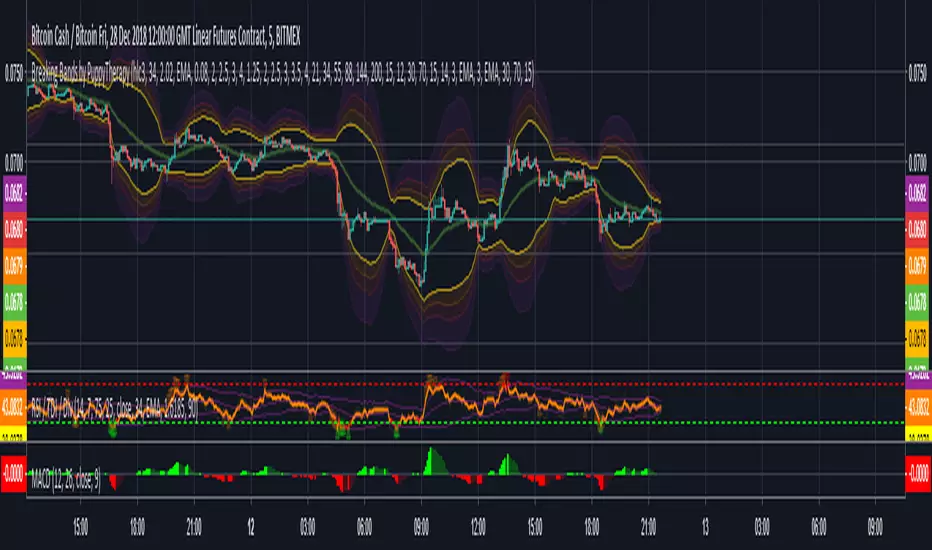
MFI Reloaded @ByPuppyTherapyThe goal was to create a nicer cleaner and yet a practical version of the
MFI indicator. MFI or Money Flow Index is a momentum-based oscillator. It is very similar to the RSI but enhanced with
volume in its calculation.
This version of MFI features :
- Cleaner visualization
- EMA Band Ribbon to see the trend without noise
- Long Term MFI smoothed via T3 that sets the actual trend
- basic TDI like functionality with two bands and Sharkfins / Hooks
- the Sharkfins / Hook signals are generated in the direction of the MFI Trend

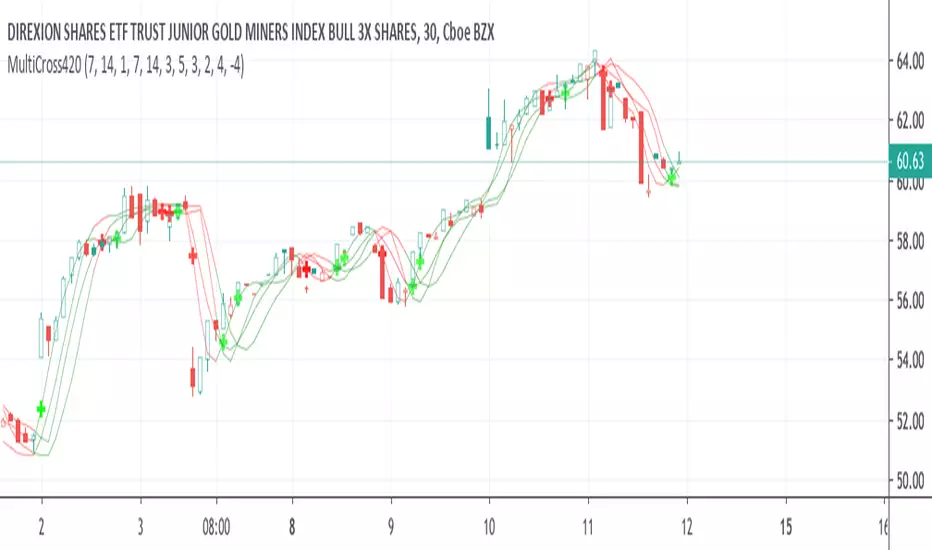

The Market Maker Method - Moving AveragesPlots the 5, 13, 50, 200 and 800 Exponential Moving Averages as per Market Maker Method. Add the TDI indicator (GoldMinds) to complete the setup.
Moving averages, when used in the appropriate way (i.e. in the context of the market maker methodology) can give:
1. A true reading of market direction
2. A reading of market momentum
3. Entry and exit signals
4. Moving support and resistance points
5. Targets for a take profit
Traders Dynamic Index [Mattia Broili]Traders Dynamic Index, aka TDI
Coded by Mattia Broili, 31.01.2019

Traders Dynamic Index [unofficial]Traders Dynamic Index is a recreation of Steve Mauro's TDI+;
It features two short period SMAs RSI-based that acts as "signal", a long period SMAs as a dynamic baseline, and two bands based on the baseline.


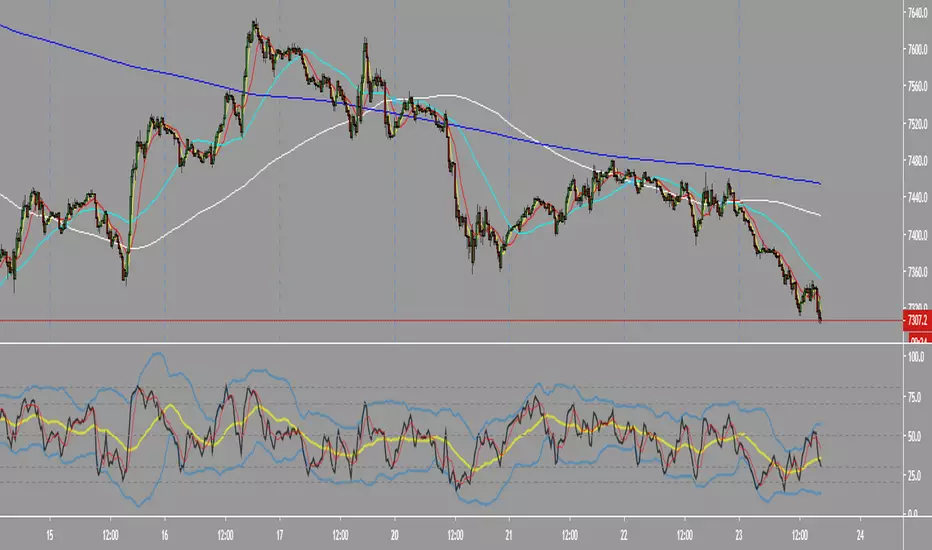
RSI - Div - TDIBasic RSI with BBs length 34
Ability to show divergences inspired by
Added Sharkfins - when rsi moves sharply out of BBs and below / above 75 / 25 RSI
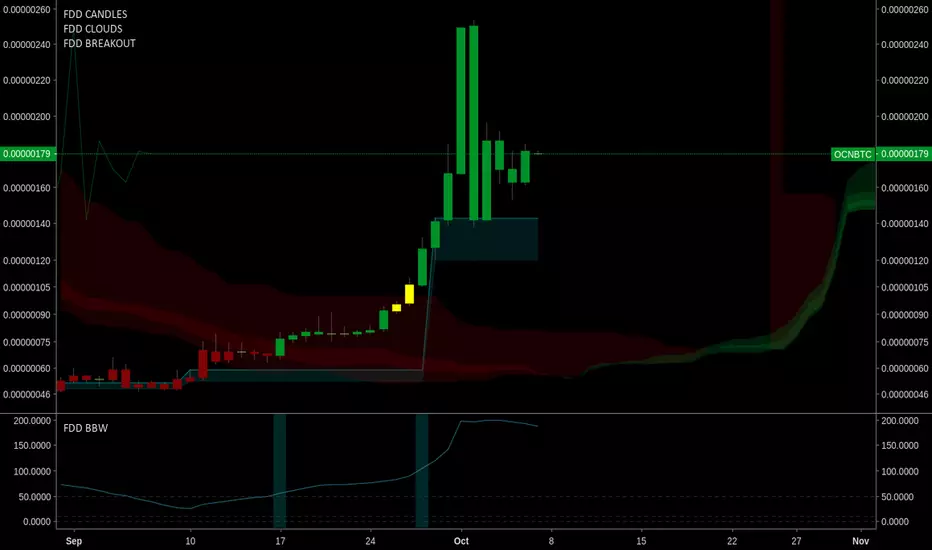
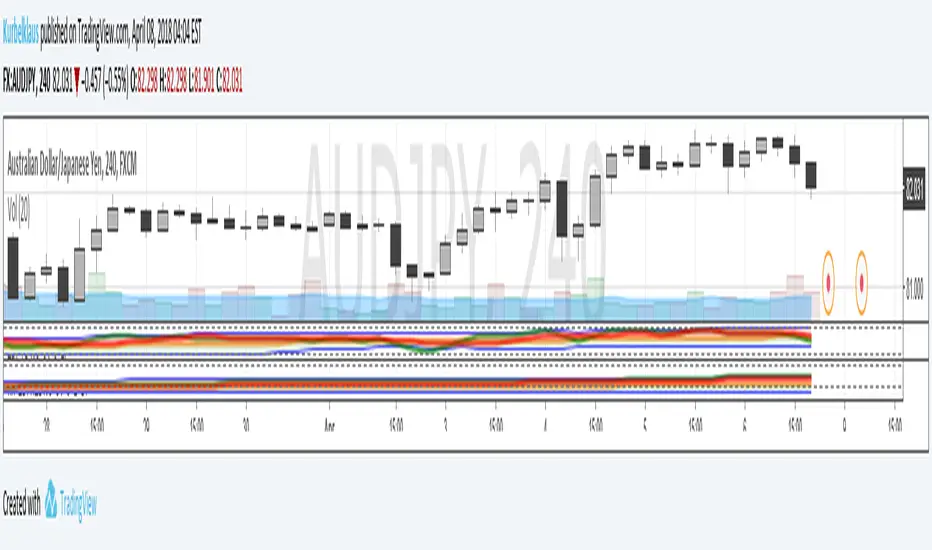
FOMO DRIVEN BREAKOUT INDICATORFomo Driven Developments Breakout Indicator
Works well with FDD Super Candles Indicator and Super Clouds.
This is the breakout indicator that F-DAS uses.
For access please go to www.fomodd.io.
Twitter = Telegram = @dgnsrekt
FOMO DRIVEN DEVELOPMENT
www.youtube.com
This video shows the F-DAS system watching TDI. F-DAS is a modular trading alert system that can easily be programmed to watch any exchange, market, or trading strategy. The video shows F-DAS watching TDI and FDD breakouts.

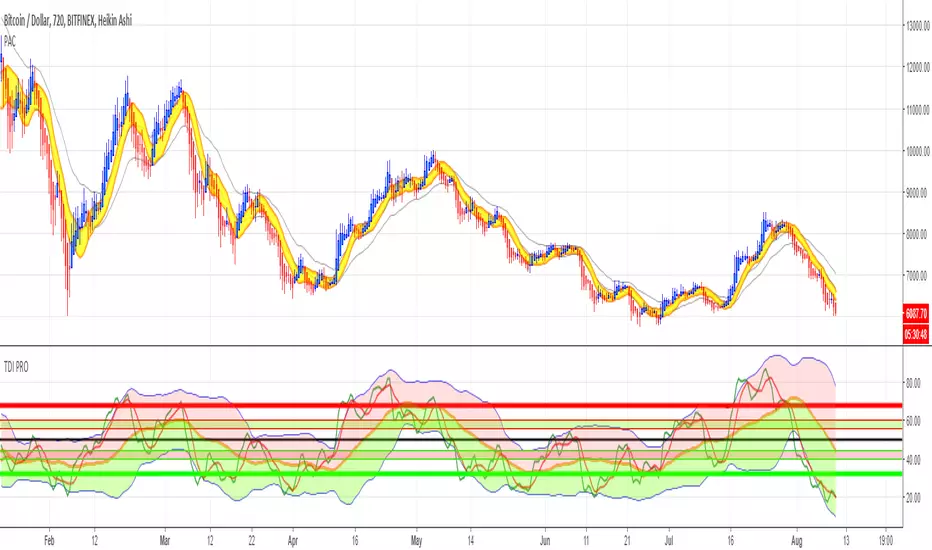
Price Action Channel ( PAC ) - Restoration by YardleyRosetteOriginal script PACMASTER by JustUncleL.
I (YardleyRosette) have republished this indicator with the fixed and optimal settings nearest to MetaTrader4 Traders Dynamic Index ("SYNERGY") Price Action Channel.
Therefore I feel I have to accredit myself for selecting the optimal settings as best intended by CompassFX .
Basic Rules:
Solid filled Heikin Ashi above (golden) yellow PAC indicates strong upmove, trend trade ( Buy ). Solid filled Heikin Ashi under (golden) yellow PAC indicates strong downmove, trend trade ( Sell ).
Weak Heikin Ashi bars signal weakness as if of ranging/consolidating market conditions, especially when price is within PAC . This is an alert zone in which not to trade or to close trade for possible reversed direction.
2nd Channel made for assistance due to the unfixable precision settings when compared to MetaTrader4's Price Action Channel. MT4 displaces PAC in a certain manner TradingView has no script for programming.
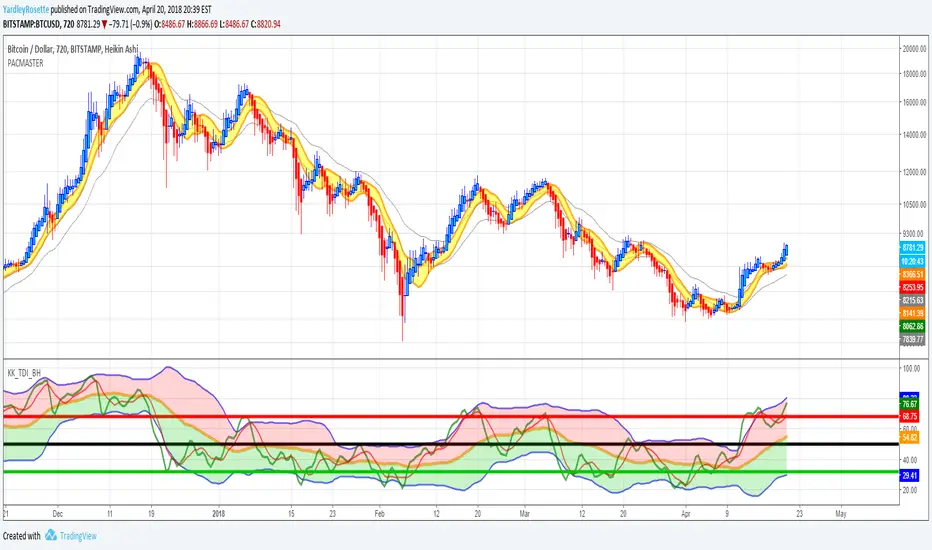
Price Action Channel Master by JustUncleL Restored by YZRJustUncleL did a fabulous job in the making of this overlay indicator. With the intent of making Traders Dynamic Index's Price Action Channel based from MT4 CompassFX Traders Dynamic Index PAC.
I had saved it time ago and came to find the best settings by comparing to MT4 data points and believe to have come the closest to the best setting for trading with the PAC Master.
It must be used freely, and I will only protect the source code.
If the original author purposefully erased it, deleted it or something else occurred yet desires to have the original source code I will hand over the original source code (I have saved) to its proper owner.
___________________
Canal Maestro de Acción de Precio por JustUncleL restaurado y corregido por YardleyRosette.
______________
KK_Traders Dynamic Index Higher TimeframeHi Guys,
I was asked to create a script that can access TDI values from higher timeframes - here it is.
You can choose the timeframe in the settings just put the following there:
Weekly - W
Daily - D
4h - 240
1h - 60
...
This only works for higher timeframes than the one you're currently on.
I whish you all good luck trading!
Best regards
KK
Slickwater Strategy [frac]This indicator is the culmination of various other indicators and attempts to help traders assess the actual current trend and filter out all the noise.
In reality, this indicator is extremely similar to the Traders Dynamic Index in concept and the overall results of the indicator across any time frame. The differences though are that while TDI uses just RSI, this uses RSI, CCI, MFI, and TSI, and also includes an assessment of the momentum associated with the move, to better enable traders to detect divergence.
The default settings generate the best returns across any time frame, however can be ultra sensitive and generate too many trade signals on high resolution time frames (i.e., the 15M or 30M). If one desires less sensitive results, one can use (14,12,9) for the first 3 inputs. This generates consistent signals, but is not as sensitive as the default.
In general:
GO LONG:
- Scalp: Wt1 crosses over Wt2
- Short Term: Wt1 crosses over Wt2 and the middle band. Wt2 is above the middle band as well
- Medium Term: Same as short term, but there are extended oversold trading signals (yellow dots)
- Long term: Same as medium term, but there is divergence in the momentum as well (i.e. it is increasing while price decreases)
GO SHORT:
- Scalp: Wt1 crosses under Wt2
- Short Term: Wt1 crosses under Wt2 and the middle band. Wt2 is below the middle band as well.
- Medium Term: Same as short term, but there are extended overbought trading signals (yellow dots)
- Long term: Same as medium term, but there is divergence in the momentum as well (i.e., it is decreasing while price increases)


KK_Price Action Channel (TDI BH)Hey guys,
this little script is an addition to another one I will release right after this.
This is the Price Action Channel. The bands are calculated using a smoothed moving average of the highs/lows. I have taken the smoothed moving average script from the public library in order to create this, so all props to whoever created that one.
I am fairly new to creating scripts so use it with caution and let me know what you think!
EDIT: Here is the script I have written this one for:
