Easy Strategy BuilderHello, I focused on making this indicator as user-friendly as possible while designing it. I avoided complex structures, and as a result, I believe I have created an indicator that everyone can easily use.
With the Strategy Builder indicator, you can automate the strategy you use and visualize signals on the chart. This allows you to scale your strategy and stay informed of new signals through alerts.
How it works?
Firstly, we need to determine the entry condition for the trade. For this, you have 15 different sources at your disposal.
1. Price
2. RSI
3. RSI MA
4. CCI
5. STOCH K
6. STOCH D
7. MA 1
8. MA 2
9. ATR
10. DMI+
11. DMI-
12. SUPERTREND
13. BB Lower
14. BB Middle
15. BB Upper
Using the relationship between these sources or with a key level, we can generate signals. There are 7 different conditions available to control this relationship.
1. > x is greater than y
2. > = x is greater than or equal to y
3. < x is less than y
4. ≤ x is less than or equal to y
5. = x is equal to y
6. Cross Up = x has crossed above y. One bar ago, x was less than y, now x is greater than y.
7. Cross Down = x has crossed below y. One bar ago, x was greater than y, now x is less than y.
Let’s make a few examples
1.
- Entry Condition: RSI crosses above RSI moving average.
- Exit Condition: RSI crosses below RSI moving average.
Let's use more than one condition together
2.
Entry Condition: rsi<30 ve rsi cross up rsi Ma
Exit Condition: Rsi>70 ve rsi cross down rsi Ma
Let's strengthen the signal by adding different indicators and price.
3.
Entry Condition: rsi<30 and price70 and price> bb middle and rsi cross down rsi ma
What if things go wrong? Let's add stop loss
4.
Entry Condition: rsi<30 and price70 and price> bb higher and rsi cross down rsi ma
Stoploss: %2
That's how simple it is to create a strategy. Need a more complex strategy? Feel free to contact me.
Important notes:
1. Avoid continuously triggered conditions.
Example:
Entry Condition: RSI > 0
2. Determine logical entry and exit conditions.
3. Avoid placing stop losses too close to entry points.
Pesquisar nos scripts por "CCI"

RSI-HeatmapThis unique indicator is a comprehensive tool designed for traders seeking to gain an edge in the market. It consists of three main components: a revised RSI, a dynamic heatmap, and an integrated alert system.
1.Modified RSI:
Unlike the traditional RSI that calculates delta as the difference between the current price and the previous price (Δ = {price} - {previous price}), this version computes delta by comparing the current price with the price n periods ago (Δ = {price} - {n-th previous price}). This delta is then smoothed using a Volume Weighted Moving Average (VWMA) with a short length to preserve the RSI's core characteristics while adapting it to capture longer-term momentum shifts more effectively.
2.Heatmap:
The heatmap feature introduces a novel approach to visualize market conditions, with 5 high levels and 5 low levels identified around the current price. When the price crosses these thresholds, the RSI-based heatmap changes colors, ranging from blue (indicative of oversold conditions) to red (signaling overbought conditions). This visual tool helps traders quickly gauge the strength and potential reversal points in the market.
3.Alert:
The Alert system employs MACD (Moving Average Convergence Divergence) and CCI (Commodity Channel Index) indicators to signal potential buy or sell opportunities. It categorizes alerts into four color-coded recommendations:
Green and Lighter Green: Strong buy signal, suggesting favorable conditions for entering buy positions.
Blue and Lighter Blue: Moderate buy signal, indicating less robust but potentially profitable buy conditions.
Red and Lighter Red: Strong sell signal, advising traders to consider taking sell positions.
Orange and Lighter Orange: Moderate sell signal, hinting at sell conditions that are not as compelling as those indicated by red.

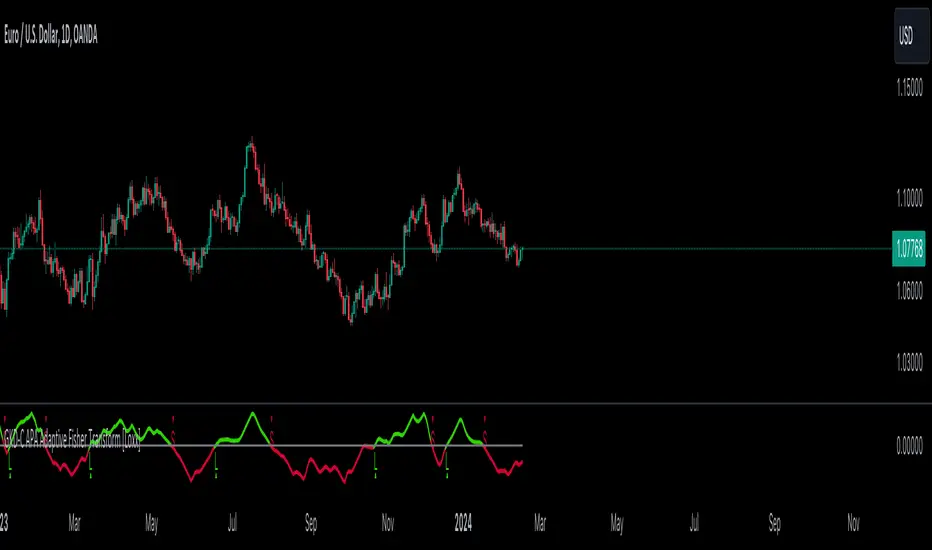
GKD-C APA Adaptive Fisher Transform [Loxx]The Giga Kaleidoscope GKD-C APA Adaptive Fisher Transform is a confirmation module included in Loxx's "Giga Kaleidoscope Modularized Trading System."
█ GKD-C APA Adaptive Fisher Transform
APA Adaptive Fisher Transform is an adaptive cycle Fisher Transform using Ehlers Autocorrelation Periodogram Algorithm to calculate the dominant cycle period.
What is an adaptive cycle, and what is Ehlers Autocorrelation Periodogram Algorithm?
From Ehlers' book Cycle Analytics for Traders Advanced Technical Trading Concepts by John F. Ehlers , 2013, page 135:
"Adaptive filters can have several different meanings. For example, Perry Kaufman’s adaptive moving average ( KAMA ) and Tushar Chande’s variable index dynamic average ( VIDYA ) adapt to changes in volatility . By definition, these filters are reactive to price changes, and therefore they close the barn door after the horse is gone.The adaptive filters discussed in this chapter are the familiar Stochastic , relative strength index ( RSI ), commodity channel index ( CCI ), and band-pass filter.The key parameter in each case is the look-back period used to calculate the indicator. This look-back period is commonly a fixed value. However, since the measured cycle period is changing, it makes sense to adapt these indicators to the measured cycle period. When tradable market cycles are observed, they tend to persist for a short while.Therefore, by tuning the indicators to the measure cycle period they are optimized for current conditions and can even have predictive characteristics.
The dominant cycle period is measured using the Autocorrelation Periodogram Algorithm. That dominant cycle dynamically sets the look-back period for the indicators. I employ my own streamlined computation for the indicators that provide smoother and easier to interpret outputs than traditional methods. Further, the indicator codes have been modified to remove the effects of spectral dilation.This basically creates a whole new set of indicators for your trading arsenal."
What is Fisher Transform?
The Fisher Transform is a technical indicator created by John F. Ehlers that converts prices into a Gaussian normal distribution.
The indicator highlights when prices have moved to an extreme, based on recent prices. This may help in spotting turning points in the price of an asset. It also helps show the trend and isolate the price waves within a trend.
█ Giga Kaleidoscope Modularized Trading System
Core components of an NNFX algorithmic trading strategy
The NNFX algorithm is built on the principles of trend, momentum, and volatility. There are six core components in the NNFX trading algorithm:
1. Volatility - price volatility; e.g., Average True Range, True Range Double, Close-to-Close, etc.
2. Baseline - a moving average to identify price trend
3. Confirmation 1 - a technical indicator used to identify trends
4. Confirmation 2 - a technical indicator used to identify trends
5. Continuation - a technical indicator used to identify trends
6. Volatility/Volume - a technical indicator used to identify volatility/volume breakouts/breakdown
7. Exit - a technical indicator used to determine when a trend is exhausted
8. Metamorphosis - a technical indicator that produces a compound signal from the combination of other GKD indicators*
*(not part of the NNFX algorithm)
What is Volatility in the NNFX trading system?
In the NNFX (No Nonsense Forex) trading system, ATR (Average True Range) is typically used to measure the volatility of an asset. It is used as a part of the system to help determine the appropriate stop loss and take profit levels for a trade. ATR is calculated by taking the average of the true range values over a specified period.
True range is calculated as the maximum of the following values:
-Current high minus the current low
-Absolute value of the current high minus the previous close
-Absolute value of the current low minus the previous close
ATR is a dynamic indicator that changes with changes in volatility. As volatility increases, the value of ATR increases, and as volatility decreases, the value of ATR decreases. By using ATR in NNFX system, traders can adjust their stop loss and take profit levels according to the volatility of the asset being traded. This helps to ensure that the trade is given enough room to move, while also minimizing potential losses.
Other types of volatility include True Range Double (TRD), Close-to-Close, and Garman-Klass
What is a Baseline indicator?
The baseline is essentially a moving average, and is used to determine the overall direction of the market.
The baseline in the NNFX system is used to filter out trades that are not in line with the long-term trend of the market. The baseline is plotted on the chart along with other indicators, such as the Moving Average (MA), the Relative Strength Index (RSI), and the Average True Range (ATR).
Trades are only taken when the price is in the same direction as the baseline. For example, if the baseline is sloping upwards, only long trades are taken, and if the baseline is sloping downwards, only short trades are taken. This approach helps to ensure that trades are in line with the overall trend of the market, and reduces the risk of entering trades that are likely to fail.
By using a baseline in the NNFX system, traders can have a clear reference point for determining the overall trend of the market, and can make more informed trading decisions. The baseline helps to filter out noise and false signals, and ensures that trades are taken in the direction of the long-term trend.
What is a Confirmation indicator?
Confirmation indicators are technical indicators that are used to confirm the signals generated by primary indicators. Primary indicators are the core indicators used in the NNFX system, such as the Average True Range (ATR), the Moving Average (MA), and the Relative Strength Index (RSI).
The purpose of the confirmation indicators is to reduce false signals and improve the accuracy of the trading system. They are designed to confirm the signals generated by the primary indicators by providing additional information about the strength and direction of the trend.
Some examples of confirmation indicators that may be used in the NNFX system include the Bollinger Bands, the MACD (Moving Average Convergence Divergence), and the MACD Oscillator. These indicators can provide information about the volatility, momentum, and trend strength of the market, and can be used to confirm the signals generated by the primary indicators.
In the NNFX system, confirmation indicators are used in combination with primary indicators and other filters to create a trading system that is robust and reliable. By using multiple indicators to confirm trading signals, the system aims to reduce the risk of false signals and improve the overall profitability of the trades.
What is a Continuation indicator?
In the NNFX (No Nonsense Forex) trading system, a continuation indicator is a technical indicator that is used to confirm a current trend and predict that the trend is likely to continue in the same direction. A continuation indicator is typically used in conjunction with other indicators in the system, such as a baseline indicator, to provide a comprehensive trading strategy.
What is a Volatility/Volume indicator?
Volume indicators, such as the On Balance Volume (OBV), the Chaikin Money Flow (CMF), or the Volume Price Trend (VPT), are used to measure the amount of buying and selling activity in a market. They are based on the trading volume of the market, and can provide information about the strength of the trend. In the NNFX system, volume indicators are used to confirm trading signals generated by the Moving Average and the Relative Strength Index. Volatility indicators include Average Direction Index, Waddah Attar, and Volatility Ratio. In the NNFX trading system, volatility is a proxy for volume and vice versa.
By using volume indicators as confirmation tools, the NNFX trading system aims to reduce the risk of false signals and improve the overall profitability of trades. These indicators can provide additional information about the market that is not captured by the primary indicators, and can help traders to make more informed trading decisions. In addition, volume indicators can be used to identify potential changes in market trends and to confirm the strength of price movements.
What is an Exit indicator?
The exit indicator is used in conjunction with other indicators in the system, such as the Moving Average (MA), the Relative Strength Index (RSI), and the Average True Range (ATR), to provide a comprehensive trading strategy.
The exit indicator in the NNFX system can be any technical indicator that is deemed effective at identifying optimal exit points. Examples of exit indicators that are commonly used include the Parabolic SAR, and the Average Directional Index (ADX).
The purpose of the exit indicator is to identify when a trend is likely to reverse or when the market conditions have changed, signaling the need to exit a trade. By using an exit indicator, traders can manage their risk and prevent significant losses.
In the NNFX system, the exit indicator is used in conjunction with a stop loss and a take profit order to maximize profits and minimize losses. The stop loss order is used to limit the amount of loss that can be incurred if the trade goes against the trader, while the take profit order is used to lock in profits when the trade is moving in the trader's favor.
Overall, the use of an exit indicator in the NNFX trading system is an important component of a comprehensive trading strategy. It allows traders to manage their risk effectively and improve the profitability of their trades by exiting at the right time.
What is an Metamorphosis indicator?
The concept of a metamorphosis indicator involves the integration of two or more GKD indicators to generate a compound signal. This is achieved by evaluating the accuracy of each indicator and selecting the signal from the indicator with the highest accuracy. As an illustration, let's consider a scenario where we calculate the accuracy of 10 indicators and choose the signal from the indicator that demonstrates the highest accuracy.
The resulting output from the metamorphosis indicator can then be utilized in a GKD-BT backtest by occupying a slot that aligns with the purpose of the metamorphosis indicator. The slot can be a GKD-B, GKD-C, or GKD-E slot, depending on the specific requirements and objectives of the indicator. This allows for seamless integration and utilization of the compound signal within the GKD-BT framework.
How does Loxx's GKD (Giga Kaleidoscope Modularized Trading System) implement the NNFX algorithm outlined above?
Loxx's GKD v2.0 system has five types of modules (indicators/strategies). These modules are:
1. GKD-BT - Backtesting module (Volatility, Number 1 in the NNFX algorithm)
2. GKD-B - Baseline module (Baseline and Volatility/Volume, Numbers 1 and 2 in the NNFX algorithm)
3. GKD-C - Confirmation 1/2 and Continuation module (Confirmation 1/2 and Continuation, Numbers 3, 4, and 5 in the NNFX algorithm)
4. GKD-V - Volatility/Volume module (Confirmation 1/2, Number 6 in the NNFX algorithm)
5. GKD-E - Exit module (Exit, Number 7 in the NNFX algorithm)
6. GKD-M - Metamorphosis module (Metamorphosis, Number 8 in the NNFX algorithm, but not part of the NNFX algorithm)
(additional module types will added in future releases)
Each module interacts with every module by passing data to A backtest module wherein the various components of the GKD system are combined to create a trading signal.
That is, the Baseline indicator passes its data to Volatility/Volume. The Volatility/Volume indicator passes its values to the Confirmation 1 indicator. The Confirmation 1 indicator passes its values to the Confirmation 2 indicator. The Confirmation 2 indicator passes its values to the Continuation indicator. The Continuation indicator passes its values to the Exit indicator, and finally, the Exit indicator passes its values to the Backtest strategy.
This chaining of indicators requires that each module conform to Loxx's GKD protocol, therefore allowing for the testing of every possible combination of technical indicators that make up the six components of the NNFX algorithm.
What does the application of the GKD trading system look like?
Example trading system:
Backtest: Multi-Ticker CC Backtest
Baseline: Hull Moving Average
Volatility/Volume: Hurst Exponent
Confirmation 1: Advance Trend Pressure as shown on the chart above
Confirmation 2: uf2018
Continuation: Coppock Curve
Exit: Rex Oscillator
Metamorphosis: Baseline Optimizer
Each GKD indicator is denoted with a module identifier of either: GKD-BT, GKD-B, GKD-C, GKD-V, GKD-M, or GKD-E. This allows traders to understand to which module each indicator belongs and where each indicator fits into the GKD system.
? Giga Kaleidoscope Modularized Trading System Signals
Standard Entry
1. GKD-C Confirmation gives signal
2. Baseline agrees
3. Price inside Goldie Locks Zone Minimum
4. Price inside Goldie Locks Zone Maximum
5. Confirmation 2 agrees
6. Volatility/Volume agrees
1-Candle Standard Entry
1a. GKD-C Confirmation gives signal
2a. Baseline agrees
3a. Price inside Goldie Locks Zone Minimum
4a. Price inside Goldie Locks Zone Maximum
Next Candle
1b. Price retraced
2b. Baseline agrees
3b. Confirmation 1 agrees
4b. Confirmation 2 agrees
5b. Volatility/Volume agrees
Baseline Entry
1. GKD-B Baseline gives signal
2. Confirmation 1 agrees
3. Price inside Goldie Locks Zone Minimum
4. Price inside Goldie Locks Zone Maximum
5. Confirmation 2 agrees
6. Volatility/Volume agrees
7. Confirmation 1 signal was less than 'Maximum Allowable PSBC Bars Back' prior
1-Candle Baseline Entry
1a. GKD-B Baseline gives signal
2a. Confirmation 1 agrees
3a. Price inside Goldie Locks Zone Minimum
4a. Price inside Goldie Locks Zone Maximum
5a. Confirmation 1 signal was less than 'Maximum Allowable PSBC Bars Back' prior
Next Candle
1b. Price retraced
2b. Baseline agrees
3b. Confirmation 1 agrees
4b. Confirmation 2 agrees
5b. Volatility/Volume agrees
Volatility/Volume Entry
1. GKD-V Volatility/Volume gives signal
2. Confirmation 1 agrees
3. Price inside Goldie Locks Zone Minimum
4. Price inside Goldie Locks Zone Maximum
5. Confirmation 2 agrees
6. Baseline agrees
7. Confirmation 1 signal was less than 7 candles prior
1-Candle Volatility/Volume Entry
1a. GKD-V Volatility/Volume gives signal
2a. Confirmation 1 agrees
3a. Price inside Goldie Locks Zone Minimum
4a. Price inside Goldie Locks Zone Maximum
5a. Confirmation 1 signal was less than 'Maximum Allowable PSVVC Bars Back' prior
Next Candle
1b. Price retraced
2b. Volatility/Volume agrees
3b. Confirmation 1 agrees
4b. Confirmation 2 agrees
5b. Baseline agrees
Confirmation 2 Entry
1. GKD-C Confirmation 2 gives signal
2. Confirmation 1 agrees
3. Price inside Goldie Locks Zone Minimum
4. Price inside Goldie Locks Zone Maximum
5. Volatility/Volume agrees
6. Baseline agrees
7. Confirmation 1 signal was less than 7 candles prior
1-Candle Confirmation 2 Entry
1a. GKD-C Confirmation 2 gives signal
2a. Confirmation 1 agrees
3a. Price inside Goldie Locks Zone Minimum
4a. Price inside Goldie Locks Zone Maximum
5a. Confirmation 1 signal was less than 'Maximum Allowable PSC2C Bars Back' prior
Next Candle
1b. Price retraced
2b. Confirmation 2 agrees
3b. Confirmation 1 agrees
4b. Volatility/Volume agrees
5b. Baseline agrees
PullBack Entry
1a. GKD-B Baseline gives signal
2a. Confirmation 1 agrees
3a. Price is beyond 1.0x Volatility of Baseline
Next Candle
1b. Price inside Goldie Locks Zone Minimum
2b. Price inside Goldie Locks Zone Maximum
3b. Confirmation 1 agrees
4b. Confirmation 2 agrees
5b. Volatility/Volume agrees
Continuation Entry
1. Standard Entry, 1-Candle Standard Entry, Baseline Entry, 1-Candle Baseline Entry, Volatility/Volume Entry, 1-Candle Volatility/Volume Entry, Confirmation 2 Entry, 1-Candle Confirmation 2 Entry, or Pullback entry triggered previously
2. Baseline hasn't crossed since entry signal trigger
4. Confirmation 1 agrees
5. Baseline agrees
6. Confirmation 2 agrees
Machine Learning: Radius Neighbors Regressor[Pofatoezil] My native language is Chinese. The following introduction is translated using ChatGPT, and I hope the translation is fluent.
Introduction
This indicator is based on the machine learning model, Radius Neighbors Regressor, which predicts the target based on the similarity of past 500 input data. The provided indicator itself is merely a tool, requiring users to input features for comparison based on their preferences. In this indicator, you can utilize up to seven types of data for regression analysis and predict target values for up to three different time periods. It is essential for users to identify features suitable for their specific commodity on their own.
What is Radius Neighbor
The Radius Neighbors Regressor is a machine learning model used for regression tasks, specifically within the realm of supervised learning. It operates based on the principle of radius-based neighbor searches, where the algorithm predicts a target variable by considering the similarity of data points within a specified radius.
Unlike KNN, which considers a fixed number of nearest neighbors, Radius Neighbors Regressor allows for a flexible definition of neighborhoods by specifying a radius. This can be advantageous when dealing with varying densities in the dataset.
The radius-based approach may offer improved robustness in situations where the distribution of neighbors is not uniform or when dealing with outliers, as it considers all data points within the specified radius.
Parameter Settings and Output
Users need to import data(such as KD,RSI,ATR,CCI,MA,Volume....) from the TradingViewChart into the indicator first, and they can choose up to seven types. Then, they select the forecasting period and the regression target (such as Close, MA....). Afterward, set the maximum search radius, where the maximum value of the radius is the square root of N, where N is the number of features used. I recommend using 10% to 15% of the square root of N as the initial parameters.
Left Table
Neighbors: Indicates how many data points among the past 500 records are sufficiently close to the current data.
Ev: The target value predicted by the model.
WR: The probability of predicting a value greater than 0, noting that this is only meaningful for data values related to prices (Close, MA...).
Right Table
Distribution of predicted values for different periods. For example, 90% represents the predicted values at the 90th percentile among the past 500 data points. RK represents the real-time data ranking among past data, ranging from 0 to 100, where a higher number is more suitable for a long position, and vice versa for a short position.
example
I believe that this indicator has many suitable applications, but relying solely on it as a basis for trading decisions may pose risks. I'll leave it to you to explore.
DayChart
H1Chart
After Open Position
First, I observed on the DayChart that the indicator showed a neutral stance in the short, medium, and long term. Additionally, on the H1Chart, I noticed stronger bullish signals in the short, medium, and long-term data. Consequently, I decided to go long for an intraday position.

WinningWave By Sercan V1Winningwave is a hurricane algorithm that works in all time frames and all transactions (stock exchange-coin), is too comprehensive to be explained in detail and includes many strategies.
To explain briefly; It is a layered oracle algorithm that gives signals by filtering the formations (Normal and Harmonic formations) created by multiple account movements containing many calculations and algorithms, based on the instantaneous momentum of the price and the overbought or oversold levels in a certain time period. Of course, formations refer to situations in which price movements occur in a certain order in financial markets. These patterns are specific patterns seen on the price chart and can often provide clues about future movements of prices. For example; Reverse Shoulder, Head and Shoulder, Symmetrical Triangle etc. Dozens of formation formation conditions and targets were filtered and made suitable for signaling. It also creates bands using YDK3 with the channel algorithm it contains. This band is usually calculated using the standard deviation method to measure price movements and indicate a specific deviation. The upper and lower bands obtained as a result of standard deviation calculations are drawn on the price chart. After a certain band is created, automatic expansion is carried out in order to predict possible movements of future prices. Additionally, Winningwave includes Ema calculations and has identified stop points after the main entry signal to help you in case you miss the main exit signal or choose a different strategy.
STRATEGY 1: As I mentioned in the general statement, the signals that emerged after many formations were filtered in 2 stages (SMI and CCI values served as filters for the formations) and the false signal rate was reduced to a minimum. You can combine signals into your own strategy using oscillators and tactics you trust.
It is important to remember that no indicator or tactic works 100% accurately. That's why filters and combinations are the right methods for you.
STRATEGY 2: Channel programs often create bands using the standard deviation method to indicate price movements and a specific deviation. Standard deviations are a measure of how far prices are generally from the mean. Channel programs draw price charts by creating upper and lower bands using these standard deviation values.
These bands can become very narrow depending on the playability of the price and the strength of the trends. In this way it can change the normal range of movement of prices and indicate potential overbought or oversold.
Once the channel is created, it is automatically expanded and gives us some clues about the direction of price movements. This expansion automatically signals the change according to the price movements of the bands. This feature becomes a predictive tool to predict price movements on the indicator.
Thus, using channel updates and standard deviation, the bands show the normal range of prices and these bands expand or contract dynamically, giving an idea about possible changes in prices. This can help investors gain insight into potential trend reversals or overbought or oversold prices.
In channel band strategy . It is a second strategy in which we calculate the profit rate with the most logical calculations when the prices touch the channel bottoms and channel tops and move up or down.
STRATEGY 3: We aimed to create a stop zone by blending the most appropriate ema values with buy signals. In some cases where you don't want to follow the signals or are confident in the transaction (written to filter out successive sell signals where price action generally rises without correction), it has created a more reliable stopping point for your trading strategy. It gives you a stopping point.
*** Calculations and mathematical settings will be in the menu. For healthy signals and filters, do not play with the numbers. For your personal use, color options or On-Off settings of each feature are available in the menu.

Targets For Many Indicators [LuxAlgo]The Targets For Many Indicators is a useful utility tool able to display targets for many built-in indicators as well as external indicators. Targets can be set for specific user-set conditions between two series of values, with the script being able to display targets for two different user-set conditions.
Alerts are included for the occurrence of a new target as well as for reached targets.
🔶 USAGE
Targets can help users determine the price limit where the price might start deviating from an indication given by one or multiple indicators. In the context of trading, targets can help secure profits/reduce losses of a trade, as such this tool can be useful to evaluate/determine user take profits/stop losses.
Due to these essentially being horizontal levels, they can also serve as potential support/resistances, with breakouts potentially confirming new trends.
In the above example, we set targets 3 ATR's away from the closing price when the price crosses over the script built-in SuperTrend indicator using ATR period 10 and factor 3. Using "Long Position Target" allows setting a target above the price, disabling this setting will place targets below the price.
Users might be interested in obtaining new targets once one is reached, this can be done by enabling "New Target When Reached" in the target logic setting section, resulting in more frequent targets.
Lastly, users can restrict new target creation until current ones are reached. This can result in fewer and longer-term targets, with a higher reach rate.
🔹 Dashboard
A dashboard is displayed on the top right of the chart, displaying the amount, reach rate of targets 1/2, and total amount.
This dashboard can be useful to evaluate the selected target distances relative to the selected conditions, with a higher reach rate suggesting the distance of the targets from the price allows them to be reached.
🔶 DETAILS
🔹 Indicators
Besides 'External' sources, each source can be set at 1 of the following Build-In Indicators :
ACCDIST : Accumulation/distribution index
ATR : Average True Range
BB (Middle, Upper or Lower): Bollinger Bands
CCI : Commodity Channel Index
CMO : Chande Momentum Oscillator
COG : Center Of Gravity
DC (High, Mid or Low): Donchian Channels
DEMA : Double Exponential Moving Average
EMA : Exponentially weighted Moving Average
HMA : Hull Moving Average
III : Intraday Intensity Index
KC (Middle, Upper or Lower): Keltner Channels
LINREG : Linear regression curve
MACD (macd, signal or histogram): Moving Average Convergence/Divergence
MEDIAN : median of the series
MFI : Money Flow Index
MODE : the mode of the series
MOM : Momentum
NVI : Negative Volume Index
OBV : On Balance Volume
PVI : Positive Volume Index
PVT : Price-Volume Trend
RMA : Relative Moving Average
ROC : Rate Of Change
RSI : Relative Strength Index
SMA : Simple Moving Average
STOCH : Stochastic
Supertrend
TEMA : Triple EMA or Triple Exponential Moving Average
VWAP : Volume Weighted Average Price
VWMA : Volume-Weighted Moving Average
WAD : Williams Accumulation/Distribution
WMA : Weighted Moving Average
WVAD : Williams Variable Accumulation/Distribution
%R : Williams %R
Each indicator is provided with a link to the Reference Manual or to the Build-In Indicators page.
The latter contains more information about each indicator.
Note that when "Show Source Values" is enabled, only values that can be logically found around the price will be shown. For example, Supertrend , SMA , EMA , BB , ... will be made visible. Values like RSI , OBV , %R , ... will not be visible since they will deviate too much from the price.
🔹 Interaction with settings
This publication contains input fields, where you can enter the necessary inputs per indicator.
Some indicators need only 1 value, others 2 or 3.
When several input values are needed, you need to separate them with a comma.
You can use 0 to 4 spaces between without a problem. Even an extra comma doesn't give issues.
The red colored help text will guide you further along (Only when Target is enabled)
Some examples that work without issues:
Some examples that work with issues:
As mentioned, the errors won't be visible when the concerning target is disabled
🔶 SETTINGS
Show Target Labels: Display target labels on the chart.
Candle Coloring: Apply candle coloring based on the most recent active target.
Target 1 and Target 2 use the same settings below:
Enable Target: Display the targets on the chart.
Long Position Target: Display targets above the price a user selected condition is true. If disabled will display the targets below the price.
New Target Condition: Conditional operator used to compare "Source A" and "Source B", options include CrossOver, CrossUnder, Cross, and Equal.
🔹 Sources
Source A: Source A input series, can be an indicator or external source.
External: External source if 'External" is selected in "Source A".
Settings: Settings of the selected indicator in "Source A", entered settings of indicators requiring multiple ones must be comma separated, for example, "10, 3".
Source B: Source B input series, can be an indicator or external source.
External: External source if 'External" is selected in "Source B".
Settings: Settings of the selected indicator in "Source B", entered settings of indicators requiring multiple ones must be comma separated, for example, "10, 3".
Source B Value: User-defined numerical value if "value" is selected in "Source B".
Show Source Values: Display "Source A" and "Source B" on the chart.
🔹 Logic
Wait Until Reached: When enabled will not create a new target until an existing one is reached.
New Target When Reached: Will create a new target when an existing one is reached.
Evaluate Wicks: Will use high/low prices to determine if a target is reached. Unselecting this setting will use the closing price.
Target Distance From Price: Controls the distance of a target from the price. Can be determined in currencies/points, percentages, ATR multiples, ticks, or using multiple of external values.
External Distance Value: External distance value when "External Value" is selected in "Target Distance From Price".

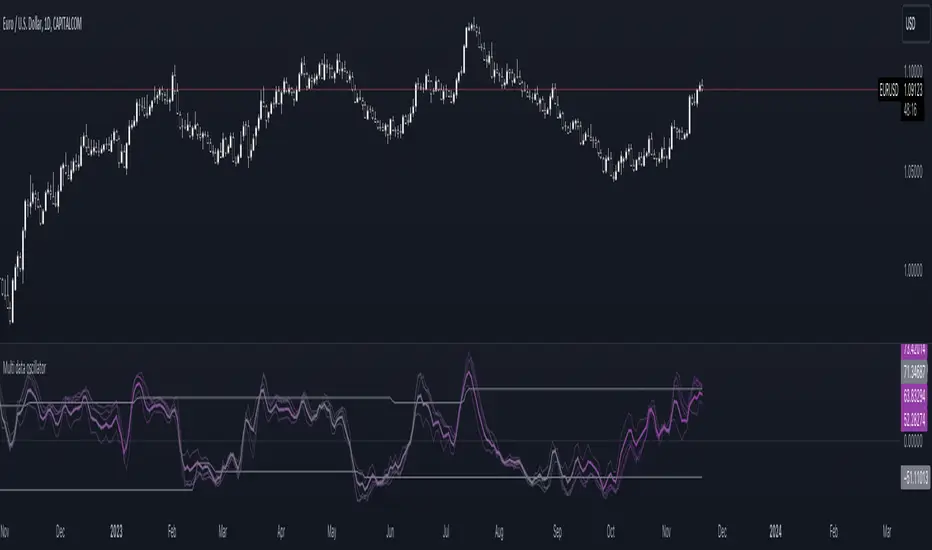
Multi-data oscillatorThe multi-data oscillator is a tool created to help traders visualize clearly how an oscillator works and moves considering different input parameters.
In this tool, you can choose to visualize the script as the RSI, the CCI, the LOC indicator, a custom-created formula that simply shows the location of the data considering X past values, or the average of all of these three indicators.
In the settings, you can choose both the length of the indicator and the smoothing factor.
Additionally, the indicator has a gradient color that changes considering the deviation and the variance of the different lines used to calculate the average line, displayed with more thickness.
Oscillator Volume Profile [Trendoscope®]The Oscillator Volume Profile indicator is designed to construct a volume profile based on predefined oscillator levels. It integrates volume data with oscillator readings to offer a unique perspective on market dynamics.
🎲 Selectable Oscillators:
Users can select from an array of oscillator options for the basis of the volume profile, including:
Relative Strength Index (RSI)
Chande Momentum Oscillator (CMO)
Center of Gravity (COG)
Money Flow Index (MFI)
Rate of Change (ROC)
Commodity Channel Index (CCI)
Stochastic Oscillator (Stoch)
True Strength Index (TSI)
Williams %R (WPR)
The length parameters - Length, Fast Length, Slow Length allows users to define the period over which the chosen oscillator is calculated, tailoring the sensitivity of the indicator to their trading strategy.
🎲 Dynamic Overbought/Oversold Ranges:
This indicator enhances traditional concepts by introducing dynamic overbought and oversold levels. These adaptable thresholds are calculated using various methods, including:
🎯 Highest/Lowest Range Method : This method establishes the range based on the highest and lowest values of the oscillator within the last N bars.
🎯 Moving Average Range Method : The range is derived from a moving average of the oscillator, providing a smoothed threshold that reflects more recent market conditions.
In addition to these methods, the indicator incorporates a unique 'Sticky Border' feature:
🎯 Sticky Border: With this option enabled, the dynamic ranges maintain their levels until the oscillator breaks out of the range. Once a breakout occurs, the levels are recalculated and updated. This mechanism ensures that the borders remain consistent and relevant, only adjusting to significant market movements that warrant a recalculation.
Users can select their preferred method for determining dynamic ranges, allowing for a customized approach that aligns with their analysis and trading strategy. The sticky border feature further refines this functionality, offering continuity until a decisive market move occurs.
🎲 Volume Profile Calculation Parameters:
🎯 Trend Filter: The indicator provides a versatile trend filter with four selectable options:
Uptrend: The volume profile is calculated when the oscillator indicates an uptrend.
Downtrend: The volume profile is calculated when the oscillator indicates a downtrend.
Any: The volume profile is calculated regardless of the trend.
External: Users can input values from an external indicator. The volume profile is then calculated only when the external indicator's value is non-zero, integrating external analysis into the volume profile construction.
🎯 Precision: Users have the option to define the precision for calculating the volume profile, which is crucial due to the varying scales of different oscillators (e.g., some oscillators range from 0 to 100, while others from -1 to 1). Selecting an appropriate precision ensures that the volume profile is accurately aligned with the minimal price range significant to the chosen oscillator. This setting requires user intervention for optimal configuration, as automatic calculation is not feasible due to the diverse nature of oscillator ranges.
🎯 Number of Bars: Users can select a specific number of bars for volume profile calculation, or opt to include all available historical bars for a comprehensive profile.
🎲 Selecting the right precision:
Users must select the right precision based on their choice of indicator. For example, RSI values range from 0-100. Hence, the default precision of 1 work fine on RSI as the volume profiles are plotted from 0 to 100 at the interval of 0.1
But, the default precision of 1 will not be ok on TSI because TSI values range from -1 to 1. Hence, using 1 as precision will result in very less volume profile lines as shown below.
Due to this, it is necessary to increase the precision for oscillators such as TSI where the range between highest and lowest value is far less. Once we set the precision to 2, we can see more appropriate volume profile division.
🎲 Note of thanks:
This publication uses polyline feature for drawing volume profiles. The advantage of using polyline is that we can overcome max 500 lines issue that we face by using the regular line objects. More details of polyline can be found in the tradingview blog post
Further, using polyline for display of volume profiles is inspired by the publications of fikira and KioseffTrading

Auto Fibo on IndicatorsThis drawing tool aims to draw auto Fibonacci Retracement Levels on desired indicators.
Users can define the target indicator to draw Auto Fibo Lines, from the "settings tab":
There are six commonly used indicators below the charts that can be selected to draw Fibonacci Retracement lines on:
RSI : Relative Strength Index
CCI : Commodity Channel Index
MFI : Money Flow Index
STOCHASTIC : Stochastic Oscillator
CMF : Chaikin Money Flow
CMO : Chande Momentum Oscillator
Fibonacci Retracement Levels will appear automatically after applying the indicator.
The "Auto Fibo on Indicators" tool looks back. It checks the indicator levels for a desired number of bars and then draws the Fibonacci Levels automatically in the right way, considering the final movements of the indicator.
There are five commonly used Fibonacci Levels added between the Highest and Lowest values such as:
%23.6
%38.2
%50 (Not precisely a Fibonacci Level, indeed)
%61.8 (Golden Ratio)
%78.6
Four extra levels can be added from the settings tab by checking their boxes:
%127.2 (adjustable level)
%161.8
%261.8
%361.8
Default lookback bars of Auto Fibo Levels: 144 (which is also a Fibonacci number)
Default Indicator: RSI
Default Indicator length: 14
Default data source: CLOSE
Users can also define and show overbought and oversold levels by unchecking the "Do not Show Indicator Overbought / Oversold Levels?" button from the settings menu.
In technical analysis, Fibonacci Levels on price can guide valuable trading signals for investors.
Levels can be significant support and resistance levels for breakouts and turning points.
This drawing tool aims to follow those necessary levels on indicators to observe critical levels and breakouts.

Divergences RefurbishedJust as "a butterfly can flap its wings over a flower in China and cause a hurricane in the Caribbean" (Edward Lorenz), small divergences in markets can signal big trading opportunities.
█Introduction
This is a script forked from LonesomeTheBlue's Divergence for Many Indicators v4.
It is a script that checks for divergence between price and many indicators.
In this version, I added more indicators and also added 40 symbols to check for divergences.
More info on the original script can be found here:
█ Improvements
The following improvements have been implemented over v4:
1. Added parameters to customize indicators.
2. Added new indicators:
- Stoch RSI
- Volume Oscillator
- PVT (Price Volume Trend)
- Ultimate Oscillator
- Fisher Transform
- Z-Score/T-Score
3. Now there is the possibility of using 2 external indicators.
4. New option to show tooltips inside labels.
This allows you to save space on the screen if you choose the option to only show the number of divergences or just the abbreviations.
5. New option to show additional text next to the indicator name.
This allows for grouping of indicators and symbols and better visualization, whether through emojis, for example.
6. Added 40 customizable symbols to check for divergences.
7. Option "show only the first letter" of the indicator replaced by: "show the abbreviation of the indicator".
Reason: the indicator abbreviation is more informative and easier to read.
8. Script converted to PineScript version 5.
█ CONCEPTS
Below I present a brief description of the available indicators.
1. Moving Average Convergence/Divergence (MACD):
Shows the difference between short-term and long-term exponential moving averages.
2. MACD Histogram:
Shows the difference between MACD and its signal line.
3. Relative Strength Index (RSI):
Measures the relative strength of recent price gains to recent price losses of an asset.
4. Stochastic Oscillator (Stoch):
Compares the current price of an asset to its price range over a specified time period.
5. Stoch RSI:
Stochastic of RSI.
6. Commodity Channel Index (CCI):
Measures the relationship between an asset's current price and its moving average.
7. Momentum: Shows the difference between the current price and the price a few periods ago.
Shows the difference between the current price and the price of a certain period in the past.
8. Chaikin Money Flow (CMF):
A variation of A/D that takes into account the daily price variation and weighs trading volume accordingly. Accumulation/Distribution (A/D) identifies buying and selling pressure by tracking the flow of money into and out of an asset based on volume patterns.
9. On-Balance Volume (OBV):
Identify divergences between trading volume and an asset's price.
Sum of trading volume when the price rises and subtracts volume when the price falls.
10. Money Flow Index (MFI):
Measures volume pressure in a range of 0 to 100.
Calculates the ratio of volume when the price goes up and when the price goes down.
11. Volume Oscillator (VO):
Identify divergences between trading volume and an asset's price. Ratio of change of volume, from a fast period in relation to a long period.
12. Price-Volume Trend (PVT):
Identify the strength of an asset's price trend based on its trading volume. Cumulative change in price with volume factor. The PVT calculation is similar to the OBV calculation, but it takes into account the percentage price change multiplied by the current volume, plus the previous PVT value.
13. Ultimate Oscillator (UO):
Combines three different time periods to help identify possible reversal points.
14. Fisher Transform (FT):
Normalize prices into a Gaussian normal distribution.
15. Z-Score/T-Score: Shows the difference between the current price and the price a few periods ago. I is a statistical measurement that indicates how many standard deviations a data point is from the mean of a data set.
When to use t-score instead of z-score? When the sample size is small (length < 30).
Here, the use of z-score or t-score is chosen automatically based on the length parameter.
█ What to look for
The operation is simple. The script checks for divergences between the price and the selected indicators.
Now with the possibility of using multiple symbols, it is possible to check divergences between different assets.
A well-described view on divergences can be found in this cheat sheet:
◈ Examples with SPY ETF versus indicators:
1. Regular bullish divergence with external indicator:
1. Regular bearish divergence with Fisher Transform:
1. Positive hidden divergence with Momentum indicator:
1. Negative hidden divergence with RSI:
◈ Examples with SPY ETF versus other symbols:
1. Regular bearish divergence with European Stoch Market:
2. Regular bearish divergence with DXY inverted:
3. Regular bullish divergence with Taiwan Dollar:
4. Regular bearish divergence with US10Y (10-Year US Treasury Note):
5. Regular bullish divergence with QQQ ETF (Nasdaq 100):
6. Regular bullish divergence with ARKK ETF (ARK Innovation):
7.Positive hidden divergence with RSP ETF (S&P 500 Equal Weight):
8. Negative hidden divergence with EWZ ETF (Brazil):
◈ Examples with BTCUSD versus other symbols:
1. Regular bearish divergence with BTCUSDLONGS from Bitfinex:
2. Regular bearish divergence with BLOK ETF (Amplify Transformational Data Sharing):
3. Negative hidden divergence with NATGAS (Natural Gas):
4. Positive hidden divergence with TOTALDEFI (Total DeFi Market Cap):
█ Conclusion
The symbols available to check divergences were chosen in such a way as to cover the main markets, in the most generic way possible.
You can adjust them according to your needs.
A trader in the American market, for example, could add more ETFs, American stocks, and sectoral indices, such as the XLF (Financial Select Sector SPDR Fund), the XLK (Technology Select Sector SPDR), etc.
On the other hand, a cryptocurrency trader could add more currency pairs and sector indicators, such as BTCUSDSHORTS (Bitfinex), USDT.D (Tether Dominance), etc.
If the chart becomes too cluttered, you can use the option to show only the number of divergences or only the indicator abbreviations.
Or even disable certain indicators and symbols, if they are not of interest to you.
I hope this script is useful.
Don't forget to support LonesomeTheBlue's work too.

DIY Custom Strategy Builder [ZP] - v1DISCLAIMER:
This indicator as my first ever Tradingview indicator, has been developed for my personal trading analysis, consolidating various powerful indicators that I frequently use. A number of the embedded indicators within this tool are the creations of esteemed Pine Script developers from the TradingView community. In recognition of their contributions, the names of these developers will be prominently displayed alongside the respective indicator names. My selection of these indicators is rooted in my own experience and reflects those that have proven most effective for me. Please note that the past performance of any trading system or methodology is not necessarily indicative of future results. Always conduct your own research and due diligence before using any indicator or tool.
===========================================================================
Introducing the ultimate all-in-one DIY strategy builder indicator, With over 30+ famous indicators (some with custom configuration/settings) indicators included, you now have the power to mix and match to create your own custom strategy for shorter time or longer time frames depending on your trading style. Say goodbye to cluttered charts and manual/visual confirmation of multiple indicators and hello to endless possibilities with this indicator.
What it does
==================
This indicator basically help users to do 2 things:
1) Strategy Builder
With more than 30 indicators available, you can select any combination you prefer and the indicator will generate buy and sell signals accordingly. Alternative to the time-consuming process of manually confirming signals from multiple indicators! This indicator streamlines the process by automatically printing buy and sell signals based on your chosen combination of indicators. No more staring at the screen for hours on end, simply set up alerts and let the indicator do the work for you.
Available indicators that you can choose to build your strategy, are coded to seamlessly print the BUY and SELL signal upon confirmation of all selected indicators:
EMA Filter
2 EMA Cross
3 EMA Cross
Range Filter (Guikroth)
SuperTrend
Ichimoku Cloud
SuperIchi (LuxAlgo)
B-Xtrender (QuantTherapy)
Bull Bear Power Trend (Dreadblitz)
VWAP
BB Oscillator (Veryfid)
Trend Meter (Lij_MC)
Chandelier Exit (Everget)
CCI
Awesome Oscillator
DMI ( Adx )
Parabolic SAR
Waddah Attar Explosion (Shayankm)
Volatility Oscillator (Veryfid)
Damiani Volatility ( DV ) (RichardoSantos)
Stochastic
RSI
MACD
SSL Channel (ErwinBeckers)
Schaff Trend Cycle ( STC ) (LazyBear)
Chaikin Money Flow
Volume
Wolfpack Id (Darrellfischer1)
QQE Mod (Mihkhel00)
Hull Suite (Insilico)
Vortex Indicator
2) Overlay Indicators
Access the full potential of this indicator using the SWITCH BOARD section! Here, you have the ability to turn on and plot up to 14 of the included indicators on your chart. Simply select from the following options:
EMA
Support/Resistance (HeWhoMustNotBeNamed)
Supply/ Demand Zone ( SMC ) (Pmgjiv)
Parabolic SAR
Ichimoku Cloud
Superichi (LuxAlgo)
SuperTrend
Range Filter (Guikroth)
Average True Range (ATR)
VWAP
Schaff Trend Cycle ( STC ) (LazyBear)
PVSRA (TradersReality)
Liquidity Zone/Vector Candle Zone (TradersReality)
Market Sessions (Aurocks_AIF)
How it does it
==================
To explain how this indictor generate signal or does what it does, its best to put in points.
I have coded the strategy for each of the indicator, for some of the indicator you will see the option to choose strategy variation, these variants are either famous among the traders or its the ones I found more accurate based on my usage. By coding the strategy I will have the BUY and SELL signal generated by each indicator in the backend.
Next, the indicator will identify your selected LEADING INDICATOR and the CONFIRMATION INDICATOR(s).
On each candle close, the indicator will check if the selected LEADING INDICATOR generates signal (long or short).
Once the leading indicator generates the signal, then the indicator will scan each of the selected CONFIRMATION INDICATORS on candle close to check if any of the CONFIRMATION INDICATOR generated signal (long or short).
Until this point, all the process is happening in the backend, the indicator will print LONG or SHORT signal on the chart ONLY if LEADING INDICATOR and all the selected CONFIRMATION INDICATORS generates signal on candle close. example for long signal, the LEADING INDICATOR and all selected CONFIRMATION INDICATORS must print long signal.
The dashboard table will show your selected LEADING and CONFIRMATION INDICATORS and if LEADING or the CONFIRMATION INDICATORS have generated signal. Signal generated by LEADING and CONFIRMATION indicator whether long or short, is indicated by tick icon ✔. and if any of the selected CONFIRMATION or LEADING indicator does not generate signal on candle close, it will be indicated with cross symbol ✖.
how to use this indicator
==============================
Using the indicator is pretty simple, but it depends on your goal, whether you want to use it for overlaying the available indicators or using it to build your strategy or for both.
To use for Building your strategy: Select your LEADING INDICATOR, and then select your CONFIRMATION INDICATOR(s). if on candle close all the indicators generate signal, then this indicator will print SHORT or LONG signal on the chart for your entry. There are plenty of indicators you can use to build your strategy, some indicators are best for longer time frame setups while others are responsive indicators that are best for short time frame.
To use for overlaying the indicators: Open the setting of this indicator and scroll to the SWITCHBOARD section, from there you can select which indicator you want to plot on the chart.
For each of the listed indicators, you have the flexibility to customize the settings and configurations to suit your preferences. simply open indicator setting and scroll down, you will find configuration for each of the indicators used.
I will also release the Strategy Backtester for this indicator soon.

Economic Events: FOMC, CPI, PPI, NFP, etcThis script plots vertical lines on major U.S. economic events that can impact a trading day. Allowing you to decide if you want to trade on that day or to help with back testing (limited in how far back one can go).
The indicator preview chart doesn't show the vertical lines for whatever reason.
Here is a snapshot image.
This is completely different code from Economic Calendar Events: FOMC, CPI, and more by @jdehorty and uses different logic but provides similar features using the same public library for U.S. economic events.
Differences:
Substantial Improved Performance.
Legend setting to only show when there is an event today.
Abbreviations for events.
More Legend Settings (Position, Text Size, Color...)
WARNING: Does NOT use the same 'built-in logic to retroactively adjust larger time intervals' , so possible there could be differences but shouldn't be. No noticeable difference on USDJPY.
Note: Was purposely made to not work on timeframes greater than one day.
Economic Events
FOMC Meetings
FOMC Minutes
Producer Price Index (PPI)
Consumer Price Index (CPI)
Consumer Sentiment Index (CSI)
Consumer Confidence Index (CCI)
Non-Farm Payroll (NFP)
To read a description of the economic events see Economic Calendar Events: FOMC, CPI, and more by @jdehorty
This script uses economic data from Library "EconomicCalendar" and will be updated when said library is updated.

Multiple Percentile Ranks (up to 5 sources at a time)This indicator is a visual percentile rank indicator that can display 1 to 5 sources at one time.
The options:
“Sources”
Choose the number of sources you would like to display. The minimum is 1, the maximum is 5.
“Label percent position”
The label for the current percentage of where the source candle ranks.
“Label position”
This displays the source/s you’ve selected, and the chosen bottom rank % and top rank %.
“Label text size”
Displays the text size of all labels.
“Display current % labels”
Switches the labels on/off only for the current percentage rank of each source.
Source options:
ATR: Average True Range
CCI: Commodity Channel Index
COG: Centre of Gravity
Close: closing price
Close Percent: close percentage from previous close
Dollar Value: volume * (high * low * close / 3)
EOM: Ease of Movement: how much volume it takes to move the price in a certain direction
OBV: On-Balance Volume
RANGE: percentage range of the close price
RSI: Relative Strength Index
RVI: Relative Vigor Index
Time Close: if you select the 1 second timeframe it will provide the gap of time between each 1 second close
Volume: each bar’s volume
Volume (MA): volume moving average
Source # where # is the number of the source. Selects the source you’d like.
Ma Length is the number of previous candles to consider when calculating the moving average of the source. Note, the “MA Length” only applies to sources that have the “(MA)” at the end of their name.
Bottom % is the bottom percentage rank of the source you’ve selected. This is a filter to display the candle line graph in red once the percentage rank is equal to the percentage you’ve chosen or below.
Top % is the top percentage rank of the source you’ve selected. This is a filter to display the candle line graph in green once the percentage rank is equal to the percentage you’ve chosen or higher.
A simple example of how to use the indicator:
Select the dropdown menu for source 1 and select volume.
As the candles populate, it will look at previous candles and assign a percentage rank of where the candles are in relation to previous candles.
*Note, the way Tradingview works is it will populate the first candle the chart was active, and continue on. So, let’s say the 3rd candle was the highest volume day. This candle will show up as 100%. If the next day, the 4th candle has an even higher volume, it will show up as 100% also, the previous candles won’t “repaint” to other values and are instead set based on when they were confirmed. So, this indicator works best when there are a lot of previous candles to compare itself to.
To use the bottom % rank filter enter a percentage such as 5%. As it comes across a candle that is 5% or less compared to previous volume candles, then the line graph will shade in red.
The same can be said for the top % rank. So, if you want to see the line graph change to green when it comes across the top 99th percentile rank of volume bars, then set the top % rank to 1% and it will give you extremely high-volume bars in green instead of blue.

Swing Point Oscillator with Trend Filter [Quantigenics]The "Swing Point Oscillator with Trend Filter" is a sophisticated trading oscillator designed to enhance trading decisions by adapting to market conditions. Oscillators typically signal overbought/oversold market states, often yielding false signals in strong trends. This trend indicator addresses this by implementing a 'Trend Filter' which changes color in strong trends, alerting traders to avoid typical oscillator reversals. In strong trends (when the trend Filter is red), mid-high or mid-low levels can be used for pullback entries. In more neutral markets (when the trend Filter is close to blue), extreme high and low levels (top and bottom) can be used, as a true 'over bought / over sold' oscillator. The oscillator combines components of the Stochastic Oscillator and the CCI, then normalizes the result, providing a unique, adaptive signal. The color-coded lines and Trend Filter offer clear visual cues, making this a comprehensive tool for various market scenarios.
Caution: Always use the indicator in conjunction with other tools and analysis methods to confirm trading decisions. Avoid trading solely based on this indicator.
GOLD 4HR
CL1! 4HR
How to Use:
Swing Point Oscillator: Displays the momentum of the price relative to its recent high and low.
Trend Filter: Highlights the general direction of the market trend.
Zones: Visual representation to categorize oscillator values (Up Zone and Down Zone).
Interpretation:
Oscillator:
When the oscillator moves upward and approaches or enters the Up Zone, it indicates increasing bullish momentum.
When the oscillator moves downward and approaches or enters the Down Zone, it suggests increasing bearish momentum.
Values near the middle (around zero) often indicate indecision or consolidation in the market.
Trend Filter:
A trend filter line above the Mid-High or below the Mid-Low suggests a strong trend.
When the trend filter is between the Mid-High and Mid-Low, it might indicate a weaker or sideways trend.
Its color will change based on its position relative to the zones. For instance, it turns red when indicating a stronger trend.
Zones:
Up Zone: The area between the Top Line and the Mid-High. Indicates strong bullish momentum when the oscillator is within this zone.
Down Zone: The area between the Mid-Low and the Bottom Line. Indicates strong bearish momentum when the oscillator is in this zone.
Trading Tips:
Bullish Scenario: Consider long positions when the oscillator is rising, and the trend filter indicates a strong upward trend.
Bearish Scenario: Consider short positions when the oscillator is falling, and the trend filter indicates a strong downward trend.

Relative Strength Volume ComparisonThe Relative Strength Volume Comparison is a powerful tool that can help traders identify the current trend based on volume pressure and potential reversals.
This oscillator is made of two lines and the overbought and oversold levels. Each of these two lines is a relative-strength formula that contains both the famous RSI and CCI formulas, smoothed by a Hull moving average.
The two lines are different for input. The colored line is based just on price and changes color based on the relation with the other line. The second line uses as input an average of three different popular volume indicators: The OBV, the Accumulation/Distribution, and the PVT.
Thanks to this tool, which uses 6 different formulas combined, traders can:
- Identify the current trend direction, based on the color of the area fill and the first colored line
- Identify potential reversal areas thanks to the overbought and oversold levels, customizable in the input section alongside the length and smoothing parameters.

multiple consecutive regular divergencesThis indicator helps you to display multiple consecutive regular divergences.
- Ability to detect single, double and triple divergences (consecutive divergences)
A (bearish) single divergence occurs when the price peaks higher than the previous peak, but the oscillator value (e.g. RSI) decreases.
These conditions are a sign of reduced demand and there is a possibility of a price drop.
Although a single divergence indicates a decrease in demand, it alone cannot be a strong signal of change in price direction.
Sometimes after a divergence, we see the formation of another divergence. The price continues to grow and experience a higher peak, while the RSI value continues to decrease.
The formation of the second divergence (double divergence) indicates a further decrease in buyers and this signal will be more reliable.
In addition to single divergence, this indicator can also identify double and triple divergences.
multiple divergences are shaping after one another and can potentially improve the signal quality, compared to single divergences.
The pivot at the beginning of each divergence coincides with the pivot at the end of the previous divergence.
Check the divergence between the current pivot and all previous pivots in the desired range and not being limited to the previous pivot
Most divergence detection indicators measure divergence conditions between the current peak (valley) and only the previous peak (valley), so some divergences may not be correctly detected due to some internal minor peaks (valleys).
But in this indicator, the current peak (valley) is compared with all previous peaks (valleys).
optional parameters
A candle is considered as a peak (valley) whose high (low) value is higher (lower) than 5 candles before and after it. This number ( pivot period ) can be changed from the indicator settings.
At the last peak to receive the signal, 5 candles should be formed after the peak to have a fixed peak, which may lead to a delay in the signal. For faster detection of divergence, the number of candles required to stabilize the last peak ( last pivot confirm candles ) is optional and can be considered different from the pivot period .
In order to eliminate divergences that occur between two very close or very far peaks (valleys), you can change the minimum and maximum allowed distance between two peaks (valleys).
The divergence line drawn between the two peaks may touch the candles between the two peaks.
If the rejected touch is in the candle mode, any collision of the divergence line with any middle candle will cause rejection of the divergence.
But if the rejected touch is in body mode, the collision of the divergence line with the shadow of the candles is ineffective in detecting the divergence, and only the collision of the divergence line with the body of the candles will reject the divergence.
Optional oscillator for divergence detection
Instead of RSI oscillator, you can also use CCI or MACD. The settings of each oscillator can also be changed.
Setting alarms and receiving alerts when divergence is confirmed
Draw three divergences in three different colors

EMA Power BandsHello!
Today, I am delighted to introduce you to the "EMA Power Bands" indicator, designed to assist in identifying buying and selling points for assets moving in the markets.
Key Features of the Indicator:
EMA Bands: "EMA Power Bands" utilizes Exponential Moving Average (EMA) to create trend lines. These bands automatically expand or contract based on the price trend, adapting to market conditions.
ATR-Based Volatility: The indicator measures price volatility using the Average True Range (ATR) indicator, adjusting the width of the EMA bands accordingly. As a result, wider bands form during periods of increased volatility, while they narrow during lower volatility.
RSI-Based Buy-Sell Signals: "EMA Power Bands" uses the Relative Strength Index (RSI) to identify overbought and oversold zones. Entering the overbought zone generates a sell signal, while entering the oversold zone produces a buy signal.
Trend Direction Identification: The indicator assists in determining the price trend direction by analyzing the slope of the EMA bands. This allows you to identify periods of uptrends and downtrends.
Visualization of Buy-Sell Signals: "EMA Power Bands" visually marks the buy and sell signals:
- When RSI enters the overbought zone, it displays a sell signal (🪫).
- When RSI enters the oversold zone, it indicates a buy signal (🔋).
- When a candle closes above the emaup line, it displays a bearish signal (🔨).
- When a candle closes below the emadw line, it indicates a bullish signal (🚀).
By using the "EMA Power Bands" (EMA Güç Bantları) indicator, especially in trend-following strategies and periods of volatility, you can make more informed and disciplined trading decisions. However, I recommend using it in conjunction with other technical analysis tools and fundamental data.
*You can also use it with CCI as an example.
With this indicator, you can identify potential trend reversals in advance and strengthen your risk management strategies.
So, go ahead and try the "EMA Power Bands" (EMA Güç Bantları) indicator to enhance your technical analysis skills and make more informed trading decisions!

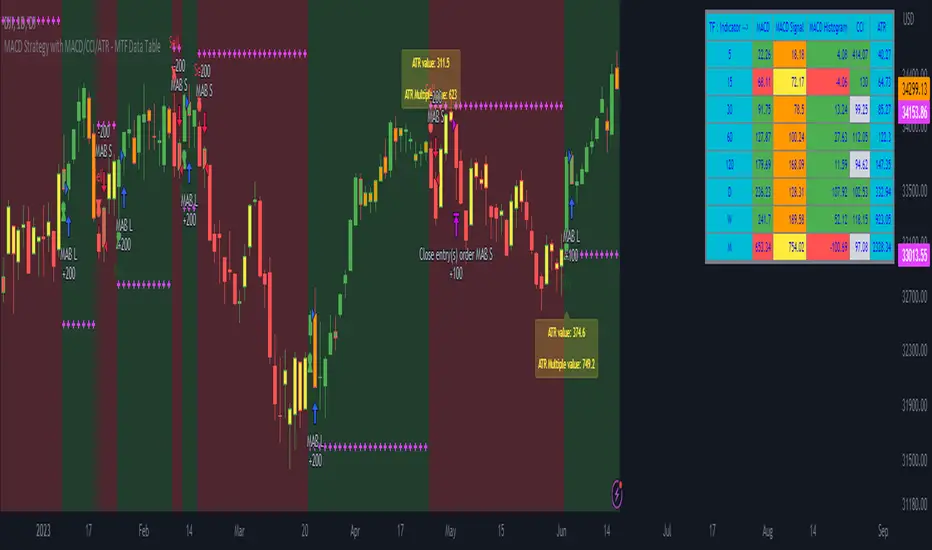
MACD Strategy with MACD/CCI/ATR - MTF Data Table MACD Strategy and MTF Table Provide you Indicator Value for MTF 5,15,30,45,60,120,D,W,M in table format
user can also able to change value of Fast Length, slow length, Smoothing Line as per users requirement
also provided ATR Value and ATR based Stoploss along with Strategy Alert
Ultimate Balance StrategyThe Ultimate Balance Oscillator Strategy harnesses the power of the Ultimate Balance Oscillator to deliver a comprehensive and disciplined approach to trading. By combining the insights of the Rate of Change (ROC), Relative Strength Index (RSI), Commodity Channel Index (CCI), Williams Percent Range, and Average Directional Index (ADX) from TradingView, this strategy offers traders a systematic way to navigate the markets with precision.
The core principle of this strategy lies in its ability to identify optimal entry and exit points based on the movement of the Ultimate Balance Oscillator. When the oscillator line crosses below the 0.75 level, a buy signal is generated, indicating a potential opportunity for a bullish trend reversal. Conversely, when the oscillator line crosses above the 0.25 level, it triggers an exit signal, suggesting a possible end to a bullish trend.
Key Features:
1. Objective Market Analysis: The Ultimate Balance Oscillator Strategy provides a disciplined and objective approach to market analysis. By relying on the quantified insights of multiple indicators, it helps traders cut through market noise and focus on key signals, improving decision-making and reducing emotional biases.
2. Enhanced Timing and Precision: This strategy's entry and exit signals are based on the specific thresholds of the Ultimate Balance Oscillator. By waiting for confirmation through the crossing of these levels, traders can potentially enter trades at opportune moments and exit with greater precision, maximizing profit potential and minimizing risk exposure.
3. Customizability and Adaptability: The strategy offers flexibility, allowing traders to customize the parameters to fit their preferred trading style and timeframes. Whether you're a short-term trader or a long-term investor, the Ultimate Balance Oscillator Strategy can be adjusted to suit your specific needs, making it adaptable to various market conditions.
4. Real-time Alerts: Stay informed and never miss a potential trade opportunity with the strategy's built-in alert system. Set personalized alerts for buy and exit signals to receive timely notifications, ensuring you're always aware of the latest developments in the market.
5. Backtesting and Optimization: Before applying the strategy to live trading, it's recommended to conduct thorough backtesting and optimization. By testing the strategy's performance over historical data and fine-tuning the parameters, you can gain insights into its strengths and weaknesses, enabling you to make informed adjustments and increase its effectiveness.
Trading involves risk. Use the Ultimate Balance Oscillator Strategy at your own discretion. Past performance is not indicative of future results.

Ultimate Balance OscillatorIntroducing the Ultimate Balance Oscillator: A Powerful Trading Indicator
Built upon the renowned Rate of Change (ROC), Relative Strength Index (RSI), Commodity Channel Index (CCI), Williams Percent Range, and Average Directional Index (ADX) from TradingView, this indicator equips traders with an unparalleled understanding of market dynamics.
What sets the Ultimate Balance Oscillator apart is its meticulous approach to weighting. Each component is assigned a weight that reflects its individual significance, while carefully mitigating the influence of highly correlated signals. This strategic weighting methodology ensures an unbiased and comprehensive representation of market sentiment, eliminating dominance by any single indicator.
Key Features and Benefits:
1. Comprehensive Market Analysis: The Ultimate Balance Oscillator provides a comprehensive view of market conditions, enabling traders to discern price trends, evaluate momentum shifts, identify overbought or oversold levels, and gauge the strength of prevailing trends. This holistic perspective empowers traders to make well-informed decisions based on a thorough understanding of the market.
2. Enhanced Signal Accuracy: With its refined weighting approach, the Ultimate Balance Oscillator filters out noise and emphasizes the most relevant information. This results in heightened signal accuracy, providing traders with a distinct advantage in identifying optimal entry and exit points. Say goodbye to unreliable signals and welcome a more precise and dependable trading experience.
3. Adaptability to Various Trading Scenarios: The Ultimate Balance Oscillator transcends the constraints of specific markets or timeframes. It seamlessly adapts to diverse trading scenarios, accommodating both short-term trades and long-term investments. Traders can customize this indicator to suit their preferred trading style and effortlessly navigate ever-changing market conditions.
4. Simplicity and Ease of Use: The Ultimate Balance Oscillator simplifies trading analysis by providing a single line on the chart. Its straightforward interpretation and seamless integration into trading strategies make decision-making effortless. By observing bullish or bearish crossovers with the moving average, recognizing overbought or oversold levels, and tracking the overall trend of the oscillator, traders can make well-informed decisions with confidence.
5. Real-time Alerts: Stay ahead of the game with the Ultimate Balance Oscillator's customizable alert system. Traders can set up personalized alerts for bullish or bearish crossovers, breaches of overbought or oversold thresholds, or any specific events that align with their trading strategy. Real-time notifications enable timely action, ensuring traders never miss lucrative trading opportunities.
The Ultimate Balance Oscillator is a robust trading companion, empowering traders to make shrewd and calculated decisions. Embrace its power and elevate your trading endeavors to new heights of precision and success. Discover the potential of the Ultimate Balance Oscillator and unlock a world of trading possibilities.

TWA - HTF Candle ColorOverview:
This indicator is designed to assist trend traders by confirming the market's direction on a higher timeframe and providing overlays to determine the strength and longevity of the current trend. Its goal is to help traders develop a probability-based mindset, enabling them to remain in profitable trades for longer periods and to identify when the trend might be shifting.
Main features and how to use:
The main feature of the indicator is the green and red coloring of the candles. The candles can be used to determine market direction and use that bias to pick a trading direction. The contrarian candle overlay is another useful feature that helps trend traders identify potential trend reversals. To use this feature, traders should wait until the overlay candle coloring "clicks off" to determine the probability that the current move has reached its peak or bottom and to look for a larger retracement. The unique flexibility of this feature allows trend traders to see both sides of the story.
Calculations and what makes this original:
- It finds breaks of common fibonacci retracement and extension values on a higher time frame using my proprietary williams % R indicator to find
trend direction
- To help add more confirmation to trend direction the proprietary algorithm combines the above fibonacci breaks with confirmation from price
breaking beyond multiple deviations measured from bollinger bands.
- From your current charts timeframe it automatically calculates which higher timeframe to analyze.
- The above algorithm from the higher timeframe is distilled down to a green or red candle color on the chart to show market direction.
- It uses a blend of rsi and CCI to calculate contrarian candle coloring to show trend exhaustion.
Additional features
Contrarian candle coloring:
The contrarian candle coloring feature is designed to help trend traders see possible reversals. It overlays a different candle color on top of the HTF candles at certain periods. The unique feature of this addition is its ability to transform a trend-following indicator into a tops and bottom reversion indicator all in one. This flexibility allows traders to see both the contrarian and trend-following perspectives.
Enhanced probability:
This feature helps traders determine the probability of their potential trades long-running potential by changing the background color to green or red. Traders can use this information to help define their risk per trade. For example, if the candle coloring matches the background color, they might choose a long-running move, whereas if the candle coloring does not match the background color, they might opt for a scalping trade. The unique feature of this addition is how it gives traders the ability to view the market from different perspectives all on one screen.
Use Alternate Symbol:
Allows for the candle color to be derived from a separate symbol than the current chart .
Candle Color as Line:
Plots a line across the top or bottom of the chart showing the current color which allows users the ability to use an additional indicator that colors candles.
Contrarian Color as Line:
Plots a line across the top or bottom of the chart showing the current candle color which allows users the ability to use an additional indicator that colors candles.
Candle Color as Background:
Colors the chart background the color of the current HTF candle color which allows users the ability to use an additional indicator that colors candles.
Increase Market Sensitivity:
Quickens the response time for candles to change color which can be helpful for scalping on 1 minute charts.
ALERTS
- Get an alert when the candle color changes to green or red
-Get an alert when the enhanced probability color changes to green or red
-Get an alert when the candle color and enhanced probability color align green or red
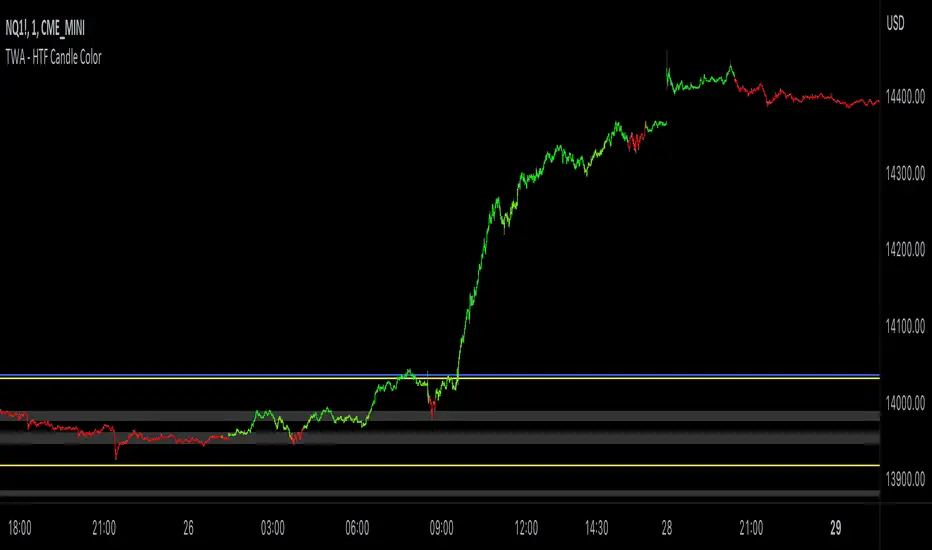
TrendFollow-1HThis is a trading strategy specially used on btcusdtperp in binance 1H chart
The most important part of this strategy is to use Support and Resistance with trading volume
Auxiliary indicators are include Directional Movement Index, trading volume, Commodity Channel Index,volume-weighted average price,Range Filter
Why is it not applicable to other trading varieties or exchanges?
Because the activity of each trading target is different from the trading volume, this strategy is very focused on the change of trading volume, so it may not be applicable to every trading variety
The idea of this strategy is to chase when the trend in the market is clear
Determine whether to break support or resistance to identify trends
But the market is full of false breakouts
Therefore, trading volume is an important indicator for judging the true and false.
Therefore, when the price breaks through support or resistance, accompanied by a huge trading volume, and forms a resonance with auxiliary indicators, the strategy will follow the trend, a time stop loss is also set. After entering the market, if there is no immediate profit to the stop profit, you will leave the market first.
But the market is always random, so the profit and loss ratio must be taken into account
Use a fixed stop loss space in exchange for a larger profit space, and ensure that the expected value is positive to make stable profits in the market
Therefore, this strategy uses 3.2% stop loss, 3.3% Take profit1 and 7.2% take profit2
About 1.5:1 profit and loss ratio to ensure positive expected value
Because the market has a clear trend only about 10% of the time
So the trading frequency of this strategy is very low
According to the backtest of up to 2021-01-01 till now , it takes about 5 days to make a transaction
User can choose their own leverage to obtain higher returns. But be sure to prioritize risk.
In order to prevent you from using this strategy without knowing it, the trading date of this strategy is only executed until the release date, and positions will not be opened and closed for subsequent markets.
You can contact me if you want to know more about this strategy
這是專門用於幣安1H圖表中btcusdtperp的交易策略
本策略最重要的部分是將支撐和阻力與交易量一起使用
輔助指標包括ADX,成交量,CCI,VWAP,Range Filter等
為什麼不適用於其他交易品種或交易所?
由於每個交易標的的活躍度與交易量不同,本策略非常注重交易量的變化,因此不一定適用於每個交易品種
這個策略的方法是在趨勢明朗的時候進行趨勢跟隨
確定是否打破支撐或阻力以識別趨勢
但市場充滿假突破
因此,成交量是判斷真假的重要指標。
當價格突破支撐位或阻力位,伴隨著巨大的成交量,並與輔助指標形成共振時,策略會順勢而為,同時設置時間止損。進場後,如果沒有立即獲利到止盈,就離場。
但市場總是隨機的,所以必須考慮盈虧比
用固定的止損空間換取更大的盈利空間,保證預期值為正,才能在市場中穩定獲利
因此,該策略使用 3.2% 止損、3.3% 止盈1 和 7.2% 止盈2
約1.5:1盈虧比,確保正期望值
因為市場只有大約 10% 的時間有明顯的趨勢
所以這個策略的交易頻率很低
根據2021-01-01至今的回測,交易頻率大約5天一次
用戶也可以選擇適合自己的槓桿以獲得更高的收益。但一定要優先考慮風險。
為防止您在不知情的情況下使用本策略,本策略的運行交易的日期僅至2023-05-30止,後續日期將不開倉和平倉。
如果您想了解更多有關此策略的信息,可以聯繫我。
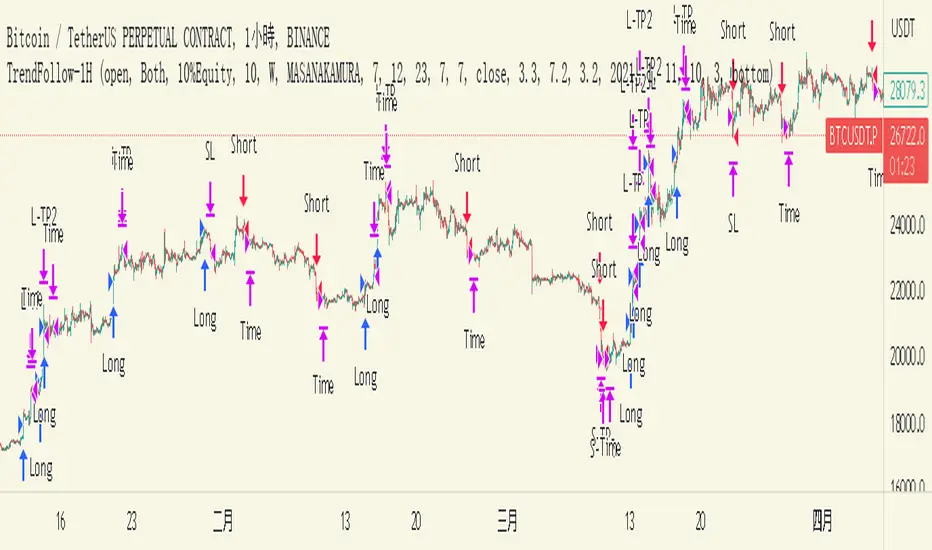
Chuff by Monty V2This is the second version of the indicator ‘Chuff by Monty’ we made a while back.
This indicator uses multiple previously available indicators as well as some newly calculated scripts to provide information on chart that uses one indicator slot but is telling you more than what one indicator could’ve.
The indicator also includes alerts which can be used to find potential signals generated by the indicator, So be sure to check those out as well.
Features of the indicator:
Ichimoku Cloud
TK Crosses: Label on chart when the Conversion Line (Tenken Sen) and Base line (Kijun Sen) is crossing each other. There are five types of crosses that are marked in the indicator. Each will have Bullish or Bearish aspect but, you have to look at the image below to really understand which is worth considering signal.
TK Lines: This checkbox will enable the Conversion and Base line, the crosses of which are labeled through the TK Crosses Checkbox above.
Bullish TK: Now when the orange line crosses the red line to the up side which should be flat at that time, this generates a bullish signal showing that this can lead price to the upwards direction. And a label print as Bullish TK in red color.
Bearish TK: Now when the orange line crosses the red line to the down side which should be flat at that time, this generates a bearish signal showing that this can lead price to the downwards direction. And a label print as Bearish TK in Golden color.
Kumo Cloud: There are two types of clouds in the indicator as well, This is calculated with a bit different approach then conventional Ichimoku Cloud indicator. Both red and green Kumo cloud acts as resistance and support respectively.
Trading Edge to Edge: This phenomenon in ichimoku suggests that when there’s a close in the cloud as 1. For longs, Green candles should close in the red cloud and at that time, The other side of the cloud should be flat and 2. For shorts, Red candles should close in the green cloud and at that time, the other side of the cloud should be flat. This opens up the window for the price to go to the other flat side of the cloud after retesting the cloud through the inside. An example is shared in the snapshot.
Divergences:
This part of the indicator uses 10 different types of oscillators including MACD, Histogram, RSI, Stochastic, CCI, Momentum, On-Balance Volume, Volume Weighted MACD, CMF, Money Flow Index and EXT to calculate divergences. By default, the indicator will show hidden and regular divergences at once, but you can choose to have just hidden or just regular divergences as per your liking. I specifically hard coded the indicator to calculate divergences from candle closes rather than from wicks, so that’s what it’s doing.
Harmonic Patterns:
I personally trade three and only three harmonics, these are bat, butterfly and Gartley. This part of indicator will analyze each swing and check if these swings are falling in any of those three harmonic pattern ranges. As we all know that these patterns don’t complete their retracement to the last digit exactly each time, so there’s a liberty range that has 10% error flexibility. Which means that if a retracement is supposed to be at 0.618, the error flexibility will check it in a range of +10% and -10% of 0.618 which comes out to be 0.556-0.678. Three of the harmonics, bullish (Green) and bearish (Red) is posted in the snapshot.
You can trade these harmonics by either waiting for the indicator to print them, either by putting an alert for each type of a harmonic pattern or by pre-predicting a harmonic which is taught in our community’s premium discord discord.gg .
Golden/Death cross:
Just like TK Crosses, this will print you Goldencross and Deathcross labels each time 55sma and 200sma cross each other. If the 55sma is crossing the 200sma to the upside, A Goldencross label will appear and if 55sma is crossing the 200sma to the downside, A Deathcross label will appear. Golden cross means the coin is turning bullish and can go high. Death cross shows that the coin is turning bearish and the price can fall.
Moving Averages:
Default lengths are 13EMA, 21EMA, 55SMA, 200SMA and 355SMA. You can change it as you like but I use these lengths for my analysis. One feature that this set of moving average has is that each MA is labeled as it’s length and the calculation method (SMA or EMA). So, when you are analyzing with multiple Moving Averages enabled, you can easily know which MA is which.
SR Band:
It has three mods. Fast/Weak which is going to be quick and sensitive to the price but will a weak support and resistance area. Slow/Strong which is going to be slow and less sensitive to the price but will be a very strong support and resistance area. The normal settings which is set as default is kind of in-between these two. You can use this SR band as a way of getting in and out of the trades as it represents Supports and resistances. The colors of the band changes when the price is above, below and is in the band.
Here’s an example trade using the confluences provided by the indicator.
This is how that trade would’ve looked like with indicator:
And this is how that trade would’ve looked like without the indicator:
Do ask questions in the comment section about the indicator or the trading strategy here if you feel like this is too complex. I’ll be glad to help.
All the settings and features which were worth customizing are customizable in this version of the indicator. Feel free to change those settings as per your liking.
Thank you.
