RSI & CCi SIGNAlUsing the RSA cross-indicator at points 70 and 30
Using the CCI cross indicator at points 100 and -100
Simultaneous use of RSA or CCI signal or both
Exit at 0.5% profit
Pesquisar nos scripts por "CCI"

3GBH - CCI + HMAsCommodity Channel Index w/ Hull Moving Average's.
Included in this indicator:
- CCI
- 3x HMA's that use the CCI as the source.
-----
User-friendly.
You can change all the inputs, they are labelled for ease-of-use.
You can toggle On/Off any or all of the options.

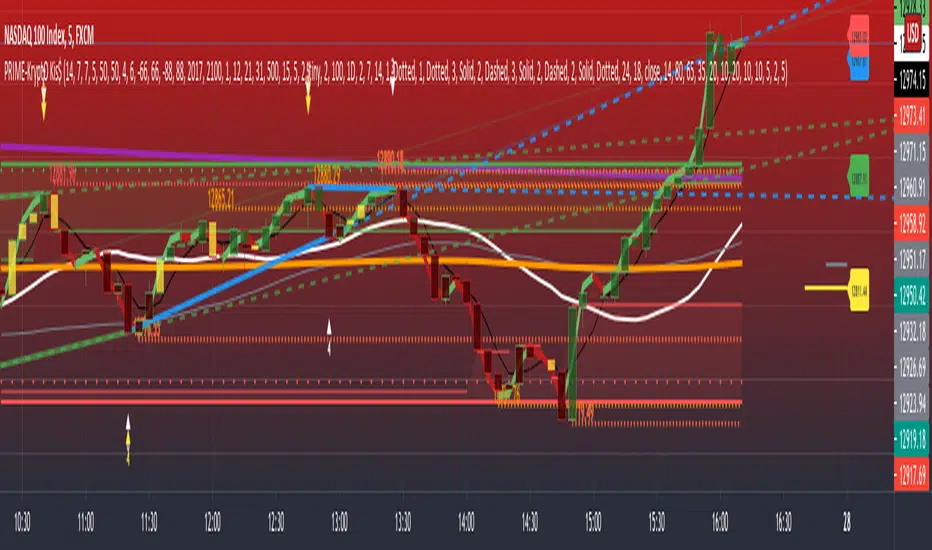
PRIME - Krypto Kiss+CCI+VPIntroducing from Prime Academy, the experimental "KryptO Kis$" algorithm, which combines our most powerful scripts all in one indicator. Available to the user are a full options platform to adjust parameters as well as individually blind indications for precise chart analysis. The following algorithms have been utilized:
* Prime Pulse (3 Candle System) - The original impulse and momentum indication system, it take rsi and tsi data to provide users with the indication of initial impulses, as well as a yellow candle to ascertain when there is a possible change of momentum in the current impulse.
* 5 SMA - The original Sniper Cross system seen from previous strategies, using the 4, 21, 50, 185, and 800 SMA's to determine changes of trend, continuation and support levels.
*CCI Indication on Chart - The system provides realtime CCI data in correlation to price positions within the general chart matrix, receiving system variables from various crosses on the 100 to -100 scale for CCI. Bullish and Bearish indications are clearly defined by separate colors.
* Volume Profile with tags - This system provides current volume data for the current time frame and sequence, also giving available tags at prices holding high volume orders, historically and present as indicated by the difference in length of indications. color saturations indicate the intensity of volume at the price in question .
* Shadow ZoneZ - Provides Support and resistance levels using rsi overbought and over sold data, sourced on the close of previous prices. Also embedded in the code is an additional volume confluence via indications of dotted lines with prices available, giving sequence positions of "Whales" and their support and resistance levels by order volume at price.
* An added bonus of the Shadow ZoneZ is the auto trend line and trend channel function , as well as the highlighted zones of liquidity waiting to be filled from previous impulses and lack of present retracements.
Any questions can be directed here on site via Direct Message. Any feedback is welcomed, and thank you in advance. Trade Well, Family!
- Dee Prime
//Disclaimer:
//Trading success is all about following your trading strategy and the indicators should fit within your trading strategy, and not to be traded upon solely
//The script is for informational and educational purposes only. Use of the script does not constitute professional and/or financial advice.
//You alone have the sole responsibility of evaluating the script output and risks associated with the use of the script.
//In exchange for using the script, you agree not to hold the publishing TradingView user liable for any possible claim for damages arising from any decision you make based on use of the script.
TSI HMA CCIHi!
This strategy has TSI and CCI indicators with the CCI being based on a HMA instead of the Price.
There is a number of conditions that must combine to create buy or sell signals, but it is basically a couple of MA crossovers.
The strategy opens new orders on each candle if the conditions are met, Either direction, so it is hedging.
It wont open new orders if there is a floating loss, and so is constantly attempting to hold a floating profit (drawup instead of drawdown)
But It has a StopLoss (set by user) for closing of losing orders, and it closes all orders in basket style when account is in profit to users set amount target profit.
Low commission set to simulate swap but Forex pairs generally dont have commission like the crypto exchanges do. So if you use this on cryptos, remember to increase the commission to your brokers amount.
Crypto users will likely find that because this opens so many orders the commission could erase its profits.
So i recommend this for Forex only, and perhaps, only NZDUSD 4H chart. other pairs, change settings for.
The strategy has settings for testing on target time spans, so you could test it on just Jan-Feb 2020 for example, if you want, or from Jan 2020 to present day.
Have Fun! Open Script for copy/paste/edit/publish your own version :)

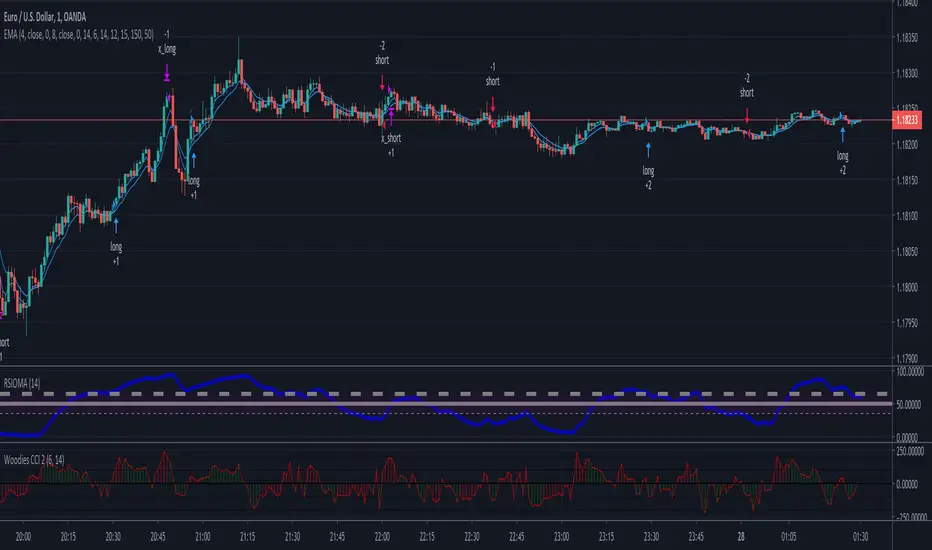
Daytrade strategy RSI CCI EMA 4/8This strategy is designed for daytrade charts.
Its made from
EMA 4 / EMA 8 to check for crosses
RSI levels for overbough/oversold
CCI levels
For entry, we check first if the ema 4 crossed ema 8
Secondly we confirm by checking the level of RSI level
Finally we confirm with CCI level
If all of them are on the same page we enter.
For exit we have a fixed pip points system for TP/SL
TSI CCI Hull with profit$$$This is a modified version of @SeaSide420 TSI CCI Hull with profits exit on long and short order
ORIGINAL SCRIPT:
/// /// feel free to edit/improve and comment

Trend Lines for RSI, CCI, Momentum, OBVHello Traders!
After publishing Trend Lines for RSI yesterday, I realized that Trend Lines for more indicators needed by the traders. so I decided to make it for four different indicators: RSI, CCI, OBV, Momentum
In the indicator options you can choose the indicator from pull-down menu.
How it works?
- On each bar it finds last 10 higher and lower Pivot Points (PP) for the indicator.
- from first bar to 10. Pivot Point it searchs if a trend line is possible
- for each PP it starts searching from the last PP .
- it checks if drawing a trend line possible or not and also it's broken or not
- if it's broken then optionally it shows broken trend lines as dotted (or you can option not to see broken lines)
- if it finds a continues trend line then it stops searhing more and draw trend line, this is done by checking angles (I did this to make the script faster, otherwise you may get error because of it needs time more than .2sec)
- the script makes this process for each PP
- then shows the trend lines
P.S. it may need 3-10 seconds when you added the script to the chart at first (because of calculations)
Trend lines for CCI:
Trend Lines for OBV
Trend Lines for Momentum:
You may want to watch how Trend Lines script works (that was made for RSI)
s3.tradingview.com
If you still didn't see Trend Lines v2 then visit:
All Comments are welcome..
Enjoy!

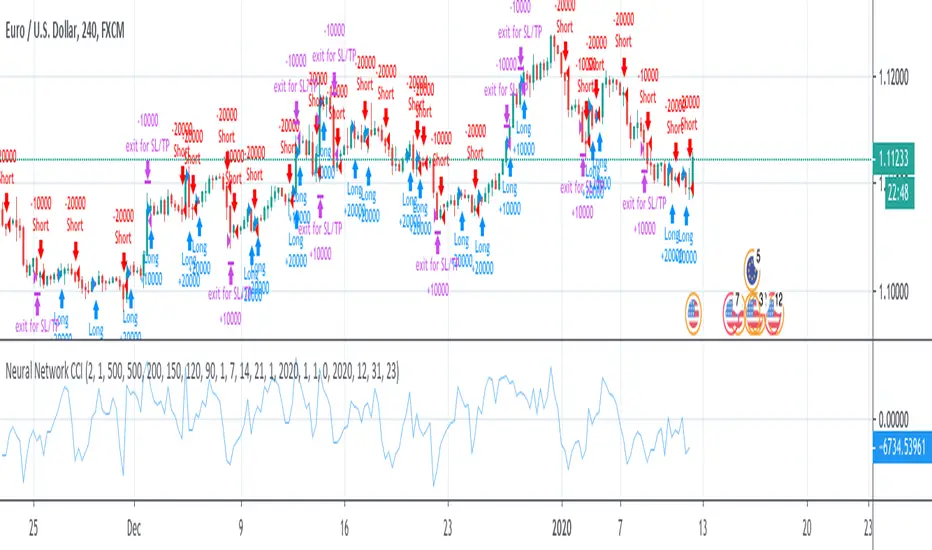
Neural Network CCI - RSIThis is a test of neural network with one layer.
Two layers will follow soon.
Signals are given by CCI or RSI.
Method 1 triggers a change of oscillator (buy if >0)
Method 2 triggers oscillator over 0 (for CCI only)
How to use:
1- launch the strategy on a chart,
2- open "Strategy Tester" tab
3- open startegy option panel
4- modify x11, x12, x13 and x14 to get the best results (net profit, profit factor, drawdown, etc...)
5- repeat once a week
Need help with self-optimization: I couldn't yet found a formula to optimize profit or win% or whatever changing values of x11, x12, x13 and x14 inside the strategy.
TSI CCI HullThis is TSI and CCI combined. The CCI is customized and is using HullMA, but the TSI is default TSI
For use with the HMAv420 indicator, to form trading strategy based on the 3 indicators.
Best as all 3 indicators used on 3 timeframes at once, ie 1m 5m 1H

HARA BB on Stochastic / CCI coded OBVThis indicator contains
- 1 Bollinger Bands based on a Stochastic / CCI coded OBV
- 1 Fibonacci Bollinger Bands based on the Stochastic / CCI coded OBV
Composed by HARA


Quad Bollinger Bands CCI Splash by ZekisQuad Bollinger Bands CCI Splash combine four Bollinger Bands with modified standard deviations and some other calcs and CCI indicator.
It's working very well in trending market (obviously) with a very high win/loss ratio.
It's working in any time frame.
The long threshold should be opposed to the short one (ex.: Long T. 50 / Short T. -50), but it can be 0 for both.
Greater difference between thresholds means fewer trades.
There are standard entries for Longs and Shorts and reentries marked with RE.
Also there are exits correlated with standard entries only.
Enjoy!
@Zekis

Donochian CCISo this indicator have the following:
1. MTF CCI
2. donochian channel MTF both non repaint mode
buliish and bearish zone determine by ratio of the the donochian cahnnel
enter or exit can be either the bullish or bearish change of color or by cross over or under of the CCI
or combination of both
The high max and low max of the donochian channel show in hilated bar

[SC]CCI - RainbowOverlay CCI lines of various durations are displayed.
36 CCI lines between min period and max period are calculated.
And ema is applied to those lines twice.

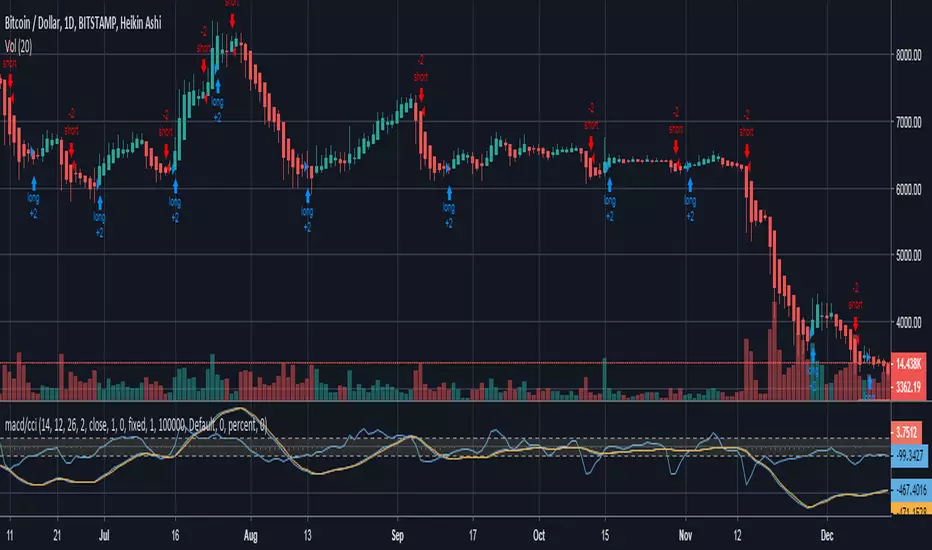
MACD+CCI Strategya simple strategy based on Joseph Nemeth MACD+CCI strategy
Reference reading: sites.google.com
Avalon T3-CCI v1My first official version based on T3-CCI with a few adjustments with Buy & Sell Signals.
Better seen on a dark theme on default values.
You can adjust the top line & bottom line for a tighter or wider entry or exit.
The signals are triggered when CCI crosses the bottom or top line upwards or downwards.
It works with every chart and better on longer timeframes.
Please use it in conjunction with other indicators as not every entry is perfect but quite a profitability %
Don't forget to place stop losses to protect your capital if it doesn't go your way.

TA-CCI (Trend Denormalized CCI)The idea is to account for the trend on the CCI calculation. On trade systems it is intended to be used in the same way as the original CCI.

Commodity Channel Index Plus (CCI+)Same CCI you love, but with a candle highlighter, control over Overbought & Oversold Line placement, and Alert Conditions for Overbought & Oversold and Recoveries, built right in.
Set the Overbought/Oversold Lines anywhere you want... use them to create CCI+ Alerts.

VW EMA CCI + TTM Volume Weighted EMA CCI + TTM squeeze in one indicator
Credit goes to SpreadEagle 71 for the CCI and Greeny for the TTM

BB %B + Woodies CCIBB %B + Woodies CCI
Divergnece of Bollinger bands and Divegence of CCI look very similar.
This is an indicator of the similar size of the Bollinger Band & B and Woodis CCI.

CryptoVN - Woodies CCI with Buy/Sell signals - Backtest
As the request for someone who's donated for the indicator CryptoVN - Woodies CCI with Buy/Sell signals:
Here is the backtest with currency pair: XBTUSD (Bitmex)
Feel free to contact me on Telegram or Discord: @Cuongitl
- The Trend Is Your Friend. TRADE WHAT YOU SEE, NOT WHAT YOU THINK. ^_^

RIZ OBV with coloured CCIThis ones useful for spotting divergence on OBV, and also includes CCI to show overbought and oversold areas in the volume. I've coloured the OBV bar with the CCI levels. Look for divergence (best results on 5min chart I believe) with this and you can spot where to sell if a second peak is not supported by volume, also shows where the big guns are dumping lots of volume!
A volume study is always a good addition to any analysis I feel, and this is one of my day to day always on indicators.

Protege Simple CCI / RSI strategy - Free editionAfter so much demands, i decided to publish a basic script using the CCI / RSI strategy.
CCI show us when to enter position when it cross 100 or - 100 .
Its better if the rsi is overbought / oversold to ge the best risks / reward ratio.
I hope it will help you all.
