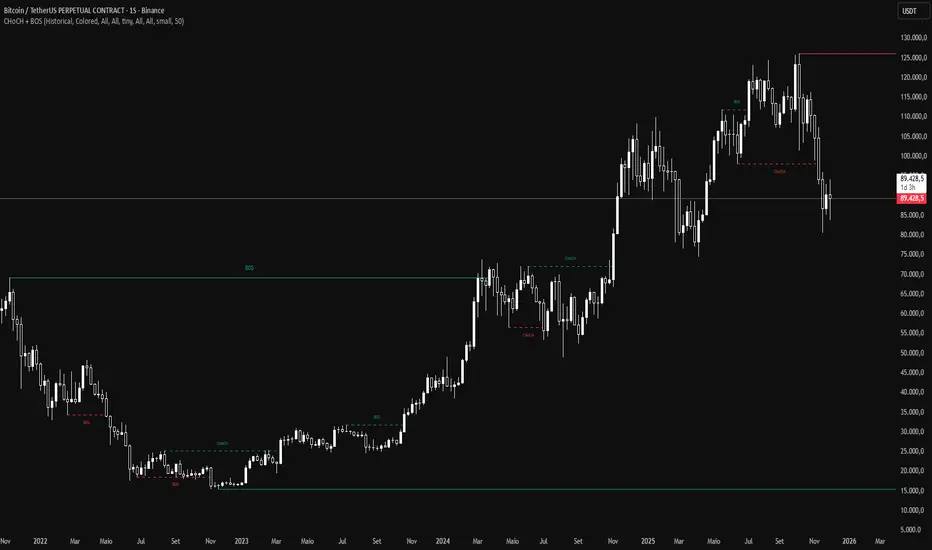
CHoCH and BOS - Market StructureIdentifies Break of Structure (BOS) and Change of Character (CHoCH) in real-time. Displays swing and internal market structure with configurable alerts.
Features:
Real-time BOS and CHoCH detection
Swing and internal structure
8 alert conditions
Full customization
Based on Smart Money Concepts (SMC) - Fork of LuxAlgo's original work
For price action and Smart Money Concepts traders.
Pesquisar nos scripts por "BOS"
ZynIQ Market Structure Master v2 - (Pro Pack)Overview
ZynIQ Market Structure Master v2 (Pro) maps structural shifts in price action using automated BOS/CHOCH detection, swing analysis and directional flow. It provides a clear view of when the market transitions between expansion, pullback and reversal phases.
Key Features
• Automated BOS (Break of Structure) and CHOCH detection
• Swing high/low mapping with optional filtering
• Directional flow logic for identifying trend vs reversal phases
• Optional EQ levels and mitigation markers
• Configurable structure sensitivity for different timeframes
• Clean labels and minimal clutter for fast interpretation
• Suitable for intraday and swing structure analysis
Use Cases
• Identifying key structural shifts in trend
• Spotting early reversal signals via CHOCH
• Assessing trend continuation vs distribution/accumulation
• Combining structure with liquidity, FVG or breakout tools
Notes
This tool provides structural context using break-of-structure and swing logic. It is not a trading system by itself. Use alongside your own confirmation and risk management.

4H Confirmation + 1H SFP BOS Retest4H Confirmation + 1H Entry (SFP + BOS + Retest)Run it on 1H
Uses 4H EMAs for higher-timeframe direction (confirmation)
Uses 1H SFP + BOS + retest + RSI for entries
This gives you more trades, still guided by the 4H trend

Swing High/Low with Trend & BOSSwing High/Low Indicator with Multi-Timeframe Trend Analysis
This indicator identifies swing highs and swing lows on the chart with visual labels and connecting lines, plus provides trend analysis across multiple timeframes.
FEATURES:
- Swing High Detection: Green "H" labels mark pivot highs with customizable lookback periods
- Swing Low Detection: Red "L" labels mark pivot lows with customizable lookback periods
- Connection Lines: Visual lines connect consecutive swing points for easy trend visualization
- Multi-Timeframe Panel: Displays trend direction (Bullish/Bearish) for 1H and 4H timeframes
- Break of Structure (BOS): Shows whether price has recently broken key levels on higher timeframes
SETTINGS:
- Left Bars: Number of bars to the left for pivot detection (default: 10)
- Right Bars: Number of bars to the right for pivot detection (default: 10)
- Show Connection Lines: Toggle to show/hide lines connecting swing points
USAGE:
Use this indicator to identify key swing points for support/resistance levels, trend analysis, and potential reversal zones. The multi-timeframe panel helps confirm trend direction across different time horizons.
NOTES:
- Works best on active markets with sufficient price movement
- Swing points are confirmed after the specified number of right bars
- BOS detection uses EMA crossovers and recent high/low breaks

Smart Risk - Three Institutional Models📘 Smart Risk – Three Institutional Entry Models
A precision-engineered institutional framework that blends liquidity, structure, and multi-time-frame confirmation.
🧠 Concept Overview
The Smart Risk indicator models how institutional traders and algorithms engineer entries around liquidity, imbalance, and structural shifts .
It unifies t hree distinct institutional entry models —each built around core Smart Money Concepts (SMC)—and enhances them with a Multi-Time-Frame Confluence (MTF) engine for directional alignment.
This tool doesn’t simply merge indicators.
It connects l iquidity sweeps, order-block reactions, breaker validation, and fair-value-gap mitigation into one cohesive trading logic—filtering every setup through trend, structure, and volume confirmation.
⚙️ How It Works
Setup #1 – Liquidity Sweep + Order Block Revisit + FVG Mitigation
Identifies engineered stop-hunts where price sweeps external liquidity and returns to a prior Order Block or Fair Value Gap (FVG).
Signals reversal-style entries with high probability of mean-reversion or mitigation.
Setup #2 – Supply/Demand + Mitigation / Breaker / FVG Continuation
Captures continuation trades inside trending structure.
When trend bias (via moving-average context) aligns with breaker or mitigation blocks, signals confirm institutional continuation sequences.
Setup #3 – Sweep + Classic FVG Reaction
Tracks clean displacement gaps following a liquidity sweep—ideal for scalpers and intraday reversals where imbalances act as magnets for price.
Each setup can be independently enabled or disabled from the panel.
A built-in signal-cooldown prevents repetitive triggers on the same leg.
🕒 Multi-Time-Frame Confluence
The new MTF module aligns lower-time-frame precision entries with higher-time-frame market structure.
When enabled, each setup only validates if the HTF trend confirms the same directional bias as the LTF pattern—e.g. a 5-minute bullish FVG signal requires a bullish 1-hour structure.
This ensures institutional logic respects global liquidity flow and avoids counter-trend traps.
MTF Controls:
• ✅ Enable MTF Confluence toggle
• ⏱️ Lower Time-Frame (LTF) selector (default 5 min)
• ⏱️ Higher Time-Frame (HTF) selector (default 1 hour)
• 🔄 Automatic SMA-based HTF trend detection
🎨 Visualization & Dashboard
• Order Block / Supply–Demand Zones — highlight institutional footprints
• Fair Value Gaps (FVGs) — reveal displacement inefficiencies
• Liquidity Sweeps (X / $) — mark engineered stops
• BOS & CHoCH — confirm structure continuation or reversal
• Compact Dashboard — live “Armed” state for each setup and MTF bias
Color-coded background cues emphasize active trade phases without clutter.
🧩 Core Algorithm Highlights
• Dynamic swing and pivot structure detection
• Breaker / Mitigation / Volume confirmation filters
• Fair-Value-Gap logic with directional alignment
• Cooldown control for signal throttling
• Multi-Time-Frame bias filter for contextual precision
⸻
📈 How to Use
1. Apply indicator to any asset or timeframe.
2. Select which institutional setups you want active.
3. Optionally enable MTF Confluence (5 min → 1 hr recommended).
4. Wait for BOS/CHoCH confirmation + zone alignment before entry.
5. Use OB and FVG zones for entry/exit planning with risk management.
⸻
💡 Originality Statement
This script introduces a multi-layered institutional logic engine that merges liquidity, mitigation, and imbalance behavior into a unified framework—augmented with time-frame synchronization and signal-cooldown management.
All logic, calculations, and visualization structure were built from scratch for this model.
It is not a mash-up of existing public indicators and offers measurable analytical value through MTF-aware trade validation.
⸻
⚠️ Disclaimer
This tool is intended for educational and analytical purposes only.
It does not provide financial advice or guaranteed trading outcomes.
Always back-test, validate setups, and apply proper risk management.

Market Structure Smart Money Concept - BOS + CHOCH + IDMThis tool is designed for traders working with Smart Money Concepts (SMC) and analyzing market structure.
Key Elements
It automatically identifies and marks:
- **BOS (Break of Structure)** – confirmed breaks signaling trend continuation
- **CHoCH (Change of Character)** – reversal points marking trend changes
- **IDM (Internal Market Structure)** – a critically important element that helps distinguish true reversals from temporary corrections
- **Inside Bars** – automatic detection of inside bars to filter out "noise"
Why IDM is Important
Traders often mistake ordinary liquidity collection for the beginning of a new trend. IDM acts as an additional filter - only after its break can we speak of a true change in market structure.
Flexible Settings
- Label sizes and colors
- Line styles
- Separate settings for shadow and body breaks
- Search period configuration for initial points (1-100% of available history)
- Option to display current structure level lines
- Information table
Main Advantages
- Clear real-time market structure visualization
- Separation of body and shadow breaks for more precise analysis
- Flexibility of use: suitable for both intraday scalping and medium-term trading
- Minimization of subjectivity through strict algorithm
- Works on any timeframe and liquid instruments
**This indicator allows you to clearly see the current market structure, quickly assess market conditions, track key turning points, identify the active trend and potential reversals.**
==================================================================================
Этот инструмент создан для трейдеров, работающих по Smart Money Concepts (SMC) и анализирующих рыночную структуру.
### Ключевые элементы
Он автоматически определяет и отмечает:
- **BOS (Break of Structure)** – подтверждённые пробои, сигнализирующие о продолжении тренда
- **CHoCH (Change of Character)** – разворотные точки, фиксирующие смену тренда
- **IDM (Internal Market Structure)** – критически важный элемент, который помогает отличить истинные развороты от временных коррекций
- **Inside Bars** – автоматическое определение внутренних баров для фильтрации "шума"
Почему IDM важен
Часто трейдеры принимают обычный сбор ликвидности за начало нового тренда. IDM действует как дополнительный фильтр - только после его пробоя можно говорить об истинном изменении структуры рынка.
Гибкие настройки
- Размеры и цвета меток
- Стили линий
- Отдельные настройки для теневых и полнотелых пробоев
- Настройка периода поиска начальных точек (1-100% от доступной истории)
- Опция отображения линий текущих структурных точек
- Информационная таблица
Основные преимущества
- Чёткая визуализация структуры рынка в реальном времени
- Разделение полнотелых и теневых пробоев для более точного анализа
- Гибкость использования: подходит как для интрадей-скальпинга, так и для среднесрочной торговли
- Минимизация субъективности через строгий алгоритм
- Подходит для любых таймфреймов и ликвидных инструментов
**Этот индикатор позволяет ясно видеть текущую рыночную структуру, быстро оценить ситуацию на рынке, отслеживать ключевые переломные моменты, определить активный тренд и возможный разворот.**

ICT SMC ToolKit By VIPIN | High Volume OB + BOS, CHoCH, FVG📌 ICT Smart Money Concepts (SMC) Toolkit
This indicator provides traders with a complete Smart Money Concepts (SMC) framework inside a single tool. It helps to visualize institutional trading footprints and market structure shifts more effectively without the need to combine multiple separate indicators.
---
🔹 Key Features
1. **Order Blocks (OB):**
- Automatically detects bullish and bearish order blocks.
- Helps traders identify institutional buying/selling zones where large players may be active.
- Volume filters included for more accurate signals.
2. **Break of Structure (BOS):**
- Marks market structure breaks that indicate continuation of the trend.
- Useful for identifying trend direction and confirming order flow.
3. **Change of Character (CHoCH):**
- Highlights early signs of market reversals.
- Shows when price transitions from bullish to bearish order flow (or vice versa).
4. **Fair Value Gaps (FVG):**
- Automatically draws zones of price imbalance.
- Traders can use these zones as possible retracement or entry levels.
- Helps to spot areas where price may return to "rebalance".
5. **Liquidity Sweeps:**
- Identifies liquidity grabs around recent highs and lows.
- Useful for spotting stop hunts and smart money manipulation before reversals.
6. **Custom Presets & Filters:**
- Users can toggle between OB-only, FVG-only, Sweep-only, or full SMC mode.
- Multiple color settings available for clear chart visualization.
---
🎯 Purpose of the Script
- Brings all major SMC tools (OB, BOS, CHoCH, FVG, Liquidity Sweep) together in one indicator.
- Reduces the need for multiple overlapping indicators.
- Helps traders simplify their workflow and keep charts clean.
- Focused on education, analysis, and market structure visualization.
---
⚠️ Disclaimer
This script is intended **for educational and analytical purposes only**.
It does not provide financial advice, trade recommendations, or guaranteed profits.
Traders should always manage their own risk and confirm setups with additional confluences.
---
ℹ️ Notes for Users
- This indicator works on multiple timeframes and instruments (Forex, Commodities, Indices, Crypto).
- Best used with a strong understanding of Smart Money Concepts (SMC) and ICT methodology.
- Combining this tool with your own analysis will provide the best results.

OrderBlock / FVG / BoS / Pivots (Multi-Tools) v 1.3Questo indicatore identifica e visualizza diversi pattern di price action utilizzati nel trading Smart Money Concepts (SMC). Ecco cosa fa:
Funzionalità Principali
-Order Blocks (OB) - Identifica blocchi di ordini istituzionali dove il prezzo potrebbe rimbalzare
-Fair Value Gaps (FVG) - Rileva gap di prezzo che potrebbero essere riempiti
-Break of Structure (BoS) - Segnala rotture di strutture di mercato importanti
-Rejection Blocks (RJB) - Trova zone di rifiuto del prezzo
-Premium Premium Discount Discount (PPDD) - Identifica order blocks formati dopo sweep di liquidità
Caratteristiche Aggiuntive
-Pivot Points - Visualizza massimi e minimi di mercato
-High Volume Bars - Evidenzia candele con volume anomalo
-Stacked OB+FVG - Segnala quando order block e fair value gap si sovrappongono
Personalizzazione
L'indicatore offre controlli completi per:
-Colori personalizzabili per ogni elemento
-Numero massimo di box visualizzabili
-Trasparenza e stili dei bordi
-Etichette e dimensioni
-Opzioni per evidenziare zone "mitigate" (già testate dal prezzo)
È uno strumento molto utile per trader che seguono la metodologia "Smart Money" e cercano di identificare dove gli operatori istituzionali potrebbero aver piazzato i loro ordini.
////////////////////////////////////////////////////////////////////////////////
This indicator identifies and displays various price action patterns used in Smart Money Concepts (SMC) trading. Here's what it does:
Main Features
-Order Blocks (OB) - Identifies institutional order blocks where the price could bounce
-Fair Value Gaps (FVG) - Detects price gaps that could be filled
-Break of Structure (BoS) - Alerts breakouts of important market structures
-Rejection Blocks (RJB) - Finds price rejection zones
-Premium Premium Discount Discount (PPDD) - Identifies order blocks formed after liquidity sweeps
Additional Features
-Pivot Points - Displays market highs and lows
-High Volume Bars - Highlights candles with abnormal volume
-Stacked OB+FVG - Alerts when order blocks and fair value gaps overlap
Customization
The indicator offers complete controls for:
-Customizable colors for each element
-Maximum number of displayable boxes
-Transparency and border styles
-Labels and sizes
-Options to highlight "mitigated" zones (already tested by the price)
It's a tool Very useful for traders following the "Smart Money Concepts" and trying to identify where institutional traders may have placed their orders.

智能资金BOS指标“智能资金BOS指标”是一个复杂的主图指标,整合了多种市场分析工具,基于智能资金(Smart Money)理念,分析市场结构(Market Structure)、订单块(OB)、公平价值缺口(FVG)以及溢价/折扣区域
The "Smart Money BOS Indicator" is a complex main chart indicator that integrates multiple market analysis tools. Based on the concept of Smart Money, it analyzes market structure, order block (OB), fair value gap (FVG), and premium/discount areas

AMOGH smc bo/bd - Delta Bot IntegrationAMOGH SMC BO/BD – Delta Bot Integration ek advanced Pine Script indicator hai jo CHoCH ke baad breakout/breakdown (BO/BD) entries detect karta hai. Ye structure flip, SL, aur smart alerts ke sath auto-trading bots ke liye optimized hai. Entry precision aur exit logic strategy-grade hai.

CHoCH + BOS + LQ Sweep v6.3.8 PRO+The CHoCH + BOS + LQ Sweep PRO indicator is a comprehensive Smart Money Concepts (SMC) tool designed to identify market structure shifts, liquidity sweeps, and key supply-demand zones across multiple timeframes. It helps traders visualize crucial price action patterns like Change of Character (CHoCH), Break of Structure (BOS), and liquidity grabs that often precede significant market reversals or continuations.
This tool is especially suited for traders applying multi-timeframe analysis and liquidity-based trading strategies on Forex, crypto, indices, or commodities.
1. Liquidity Sweeps (LQ Sweeps)
Identifies when price sweeps previous highs/lows (stop hunts/liquidity grabs).
Configurable strength setting to filter minor vs. major sweeps.
Optional stop at wick or stop at close logic for more precise entries.
Old sweeps can be displayed or hidden, with user-defined limits for historical sweeps.
2. Multi-Timeframe (HTF) Sweeps
Displays liquidity sweeps from higher timeframes (M15, H1, H4, D1, W1).
Individual checkboxes allow flexible combinations (e.g., show only H1 & H4 sweeps).
Unique colors for each timeframe to differentiate visually on the chart.
3. Supply/Demand Zones
Automatically plots zones around swing highs and lows.
Zones are dynamically updated and locked once price interacts with them.
Configurable view: Show both bullish/bearish zones or filter for one side only.
Option to display/hide old zones and limit the number of zones shown.
4. Historical Sweep Management
Stores up to 5000 sweeps internally, while adhering to TradingView’s rendering limits (max 500 drawn).
Ensures chart clarity by prioritizing the most recent sweeps.

Smart Money Breakouts [iskess 01-02 11:05]This is an big update to the excellent Smart Money Breakout Script published in Oct 2023 by ChartPrime who, to my knowledge, was the original author.
FULL CREDIT GOES TO CHARTPRIME FOR THIS ORIGINAL WORK.
Per the moderator's rules, you will find below a meaningful, detailed self-contained description that does not rely on delegation to the open source code or links to other content. You will find in the description details on what the script does, how it does that, how to use it, and how it is original.
The "Smart Money Breakouts" indicator is designed to identify breakouts based on changes in character (CHOCH) or breaks of structure (BOS) patterns, facilitating automated trading with user-defined Take Profit (TP) level.
The indicator incorporates essential elements such as volume analysis and a data table to assist traders in optimizing their strategies.
🔸Breakout Detection:
The indicator scans price movements for "Change in Character" (CHOCH) and "Break of Structure" (BOS) patterns, signaling potential breakout opportunities in the market.
🔸User-Defined TP/SL :
Traders can customize the Take Profit (TP) and Stop Loss (SL) through the indicator settings, with these levels dynamically calculated based on the Average True Range (ATR). This allows for precise risk management and profit targets that adapt to market volatility. Traders can also select the lookback period for the TP/SL calculations.
🔸Volume Analysis and Trade Direction Specific Analysis:
The indicator includes a volume checker that provides valuable insights into the strength of the breakout, taking into account trade direction.
🔸If the volume label is red and the trade is long, it suggests a higher likelihood of hitting the Stop Loss (SL).
🔸If the volume label is green and the trade is long, it indicates a higher probability of hitting the Take Profit (TP).
🔸For short trades, a red volume label suggests a higher likelihood of hitting TP, while a green label suggests a higher likelihood of hitting SL.
🔸A yellow volume label suggests that the volume is inconclusive, neither favoring bullish nor bearish movements.
🔸Data Table:
The indicator features a data table that keeps track of the number of winning and losing trades for specific timeframes or configurations. It also shows the percentage of profits vs losses, and the overall profit/loss for the selected lookback period.
This table serves as a valuable tool for traders to analyze performance and discover optimal settings and timeframes.
The "Smart Money Breakouts" indicator provides traders with a comprehensive solution for breakout trading, combining technical analysis of changes in character and breaks of structure, volume insights, and performance tracking while dynamically adjusting TP and SL levels based on market volatility through the ATR.
This version of the script is a "significant improvement" from Chart Prime's original work in the following ways:
- A selectable range of candles for the profit/loss calculations to look back on.
- An updated table that includes the percentage of wins/losses, and and overall P&L during the selected lookback range.
- The user can now select only Long trades, Short trades, or both.
- The percentage gain/loss is now indicated for every trade on the chart.
- The user can now select a different multiplier for Stop Loss or Take Profit thresholds.

Order Blocks Indicator [TradingFinder] Lightning|CHOCH |OB | BOS🔵 Introduction
In "Price Action," an "Order Block" is essentially an area on the price chart where significant players such as institutional traders have executed their moves by placing noteworthy orders. These points often indicate areas where price either attempts to break through (resistance) or returns when it reaches there (support).
Therefore, when discussing the identification of order blocks, we typically refer to finding points where the price has stalled for a while and has accumulated strength before making a significant move in one direction.
Essentially, order blocks assist traders in understanding where large players with "smart money" have likely placed their bulk orders in the market. Traders use these order blocks as part of their overall analysis to identify probable levels where price may change direction.
This version of the order block indicator is designed for traders, adding many indicators to their charts. The minimal design helps minimize disruptions to user focus.
🔵 Identification of Order Blocks
To identify order blocks, first, a "Level Break" must occur. To identify a "Demand Zone," a "High Level Break" is required, and to identify a "Supply Zone," a "Low Level Break" is needed.
Demand Zone :
Supply Zone :
🔵 "Change of Character" or "Market Shift Structure"
"ChoCh" or "MSS" is the "Break Level" that is contrary to the previous trend. For example, if a "Bearish Level" is established in the market and consecutive "Low Levels" are being broken, the price turns upward, breaking a "High Level." This break is called "ChoCh" or "MSS."
🔵 "Break of Structure"
"Break of Structure," or "BoS" for short, is the "Break Level" in the direction of the current trend. For example, if a "Bullish Level" is established in the market, when the price breaks a "High Level," a "BoS" has occurred.
🔵 Features
🟣 Major Level
This feature helps you easily identify major levels. These levels form when the price breaks another major level.
🟣 Refine Order Block
The "Refinement" feature allows you to adjust the width of the order block based on your strategy. There are two modes, "Aggressive" and "Defensive," in Order Block Refine. The difference between "Aggressive" and "Defensive" lies in the width of the order block. For "Risk Averse" traders, the "Defensive" mode is suitable because it provides smaller stop losses and larger reward-to-risk ratios. For "Risk Taker" traders, the "Aggressive" mode is more suitable. These traders prefer to enter trades at higher prices and this mode, where the width of the order block is greater, is more suitable for this group of individuals.
🔵 How to Use
After adding the indicator to your chart, you will see a visual similar to the image below. Green order blocks are "Demand Zones" and red order blocks are "Supply Zones." The midpoint of the order blocks also indicates 50% of it.
Refine Order Block is defaulted to On and refines the order blocks. If you want the order blocks to remain original, you should set it to Off.
Refine is defaulted to "Defensive" mode. If you want it to be in "Aggressive" mode, you should change its mode through Refine Type.
Displaying "Major Levels" is turned off by default and to display them, you should set "Show High Level" and "Show Low Level" to "Yes." You can use these lines to identify liquidity or determine stop loss and take profit levels.

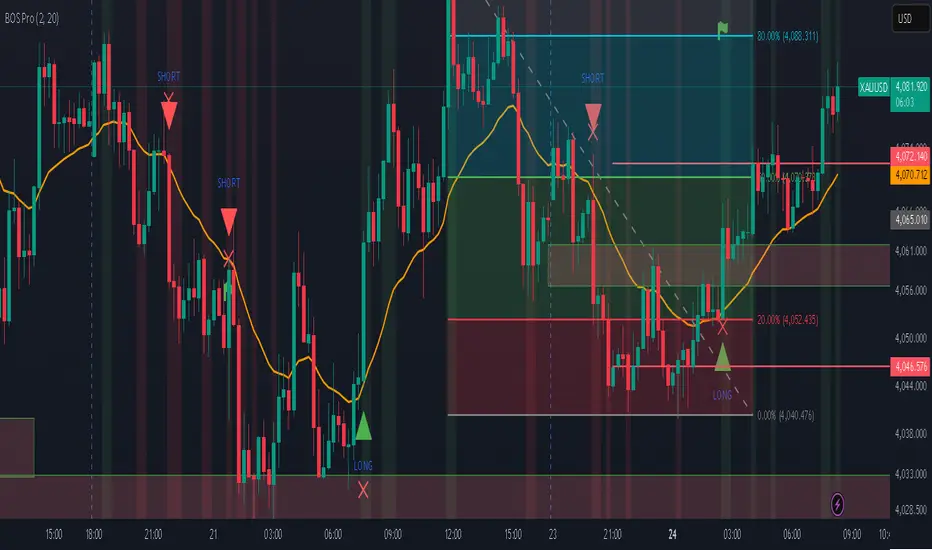
Smart Money Breakouts [ChartPrime]The " Smart Money Breakouts " indicator is designed to identify breakouts based on changes in character (CHOCH) or breaks of structure (BOS) patterns, facilitating automated trading with user-defined Take Profit (TP) level.
the indicator incorporates essential elements such as volume analysis and a data table to assist traders in optimizing their strategies.
🔸 Breakout Detection:
The indicator scans price movements for "Change in Character" (CHOCH) and "Break of Structure" (BOS) patterns, signaling potential breakout opportunities in the market.
🔸User-Defined TP :
Traders can customize the Take Profit (TP) through the indicator settings, with these levels dynamically calculated based on the Average True Range (ATR). This allows for precise risk management and profit targets that adapt to market volatility.
🔸 Volume Analysis and Trade Direction Specific Analysis:
The indicator includes a volume checker that provides valuable insights into the strength of the breakout, taking into account trade direction.
🔸If the volume label is red and the trade is long, it suggests a higher likelihood of hitting the Stop Loss (SL).
🔸If the volume label is green and the trade is long, it indicates a higher probability of hitting the Take Profit (TP).
🔸For short trades, a red volume label suggests a higher likelihood of hitting TP, while a green label suggests a higher likelihood of hitting SL.
🔸A yellow volume label suggests that the volume is inconclusive, neither favoring bullish nor bearish movements.
🔸Data Table:
The indicator features a data table that keeps track of the number of winning and losing trades for specific timeframes or configurations.
This table serves as a valuable tool for traders to analyze performance and discover optimal settings and timeframes.
The "Smart Money Breakouts" indicator provides traders with a comprehensive solution for breakout trading, combining technical analysis of changes in character and breaks of structure, volume insights, and performance tracking while dynamically adjusting TP and SL levels based on market volatility through the ATR.

ArtiumPro Main Market StructureThis indicator maps out Market Structure using real time price action rather than simply pulling "pivot" points. Use to see at a glance where a BOS or CHoCH has occurred and where the current and historic highs and lows are.
- M-BOS happens when a main break of structure occurs (trend continuation) the continuation of a bullish or bearish trend.
User setting change line style, color and transparency & turn off text, change text color and transparency
- M-CHoCH happens when a Change of Character occurs (trend change) this is the 1st sign of a possible change of the trend direction from bullish to bearish or bearish to bullish
User setting change line style, color and transparency & turn off text, change text color and transparency
- M-swh & M-swl are the current active unmitigated highs and lows
- User setting for M-swh & M-swl allows you to chose the amount of active highs / lows you want to see on the chart. this can be used at a glace to see where potential liquidity may be laying. If you only want to see the last most current
high an low you can turn on the "just last active" option box.
- User settings to turn on or off the old mitigated highs lows making it easy to see at a glance when old highs and lows have been broken or swept. The label for this is also customizable to user preference.

GK BOS ultimateGK BOS ultimate is a structured Break of Structure tool designed to highlight major shifts in the market structure.
The script identifies when price breaks above a significant previous high or below a significant low, using a defined lookback period and a ATR filter to reduce weak or minor breakouts
When a major bullish or bearish structure breaks occurs, the indicator marks the chart with a GK BUY or GK SELL label.
It also plots a TP1 level based on ATR(14) multiplied by a user-selected factor.
This provides a consistent volatility-based reference point that helps traders analyse potential follow-through areas after a structure break.
HOW IT WORKS
the script calculates the highest high and lowest low over the chosen lookback period
A break of structure is confirmed only if the close moves beyond these levels with enough strength relative to ATR, When this happens the indicator
Prints GK BUY for bullish structure breaks
Prints GK SELL for bearish structure breaks
Plots a corresponding TP1 PRINT derived from recent volatility
no repainting occurs because calculations are based on confirmed closes
this TOOL is intended for educational and analytical purposes only

Professional BOS IndicatorThis is a trend following indicator that focuses on BOS, pullback and entry

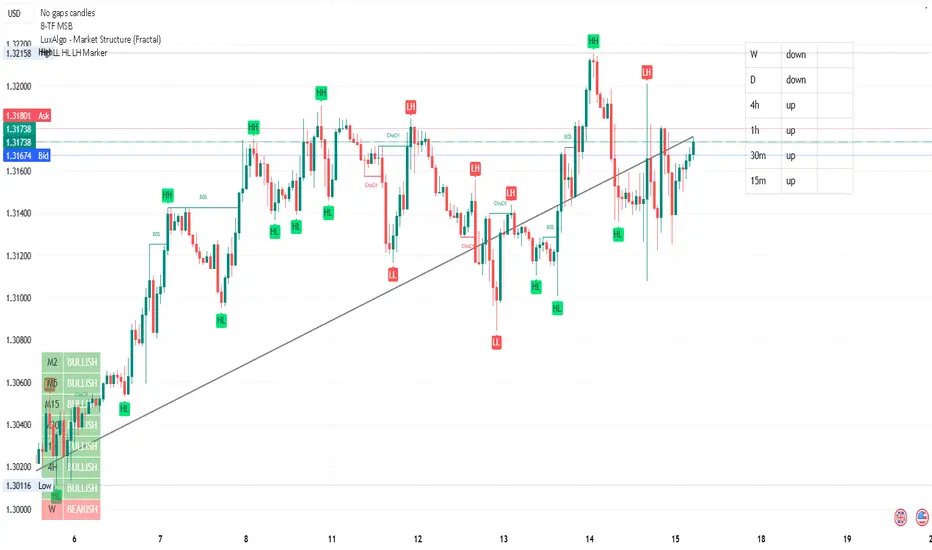
BACK TO BASIC, MTF, AOI, BOS Hiya ALL my Friends !!
I am going back to basic, MTF, AOI, BOS, mostly from freely available indicators, just adding the 8 TFs for reference. Hope this will simplify my analysis.
Cheers always !!
DYOR / NFA
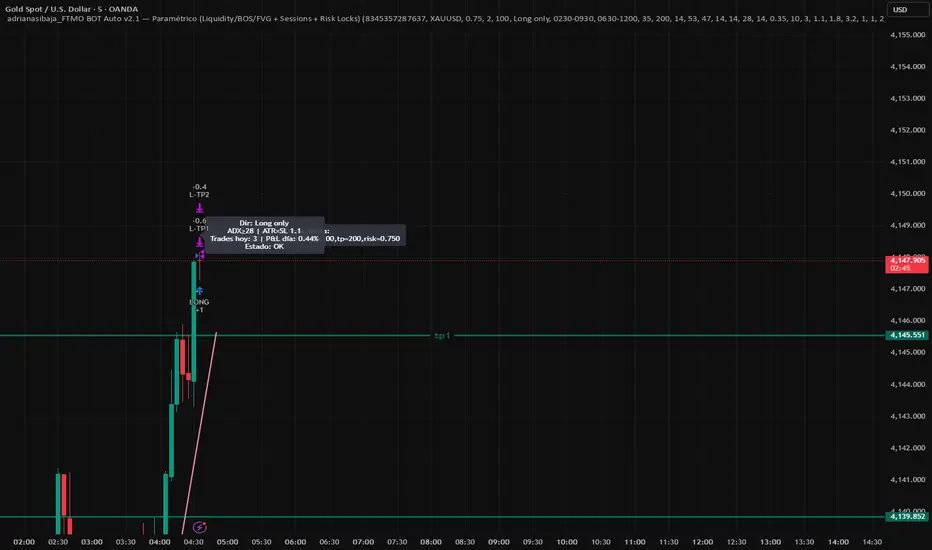
adrianasibaja_ ALGO (Liquidity/BOS/FVG + Sessions + Risk Locks)This strategy is an institutional-style automated trading system designed for XAU/USD and FTMO-funded accounts.
It combines liquidity sweeps, Break of Structure (BOS) and Fair Value Gap (FVG) confirmations with multi-filter confluences (RSI, ADX, ATR, EMA trend bias, and candle quality).
The algorithm automatically filters trades by session (London/New York), day of week, and volatility. It includes full FTMO risk management features such as daily loss lock, consecutive loss lock, and trade cooldowns.
Brahmastra with SMC by PoojaSummary
This indicator provides a structured trend-and-momentum workflow that issues Partial and Confirmed trade signals using a combination of trend filters, momentum confirmation, and structure breaks.
It helps traders identify higher-probability trade locations through multi-timeframe confirmation and automatic alert payloads — while keeping the underlying signal logic private (invite-only).
Core Components (high level overview — no source code revealed)
• Trend Filters: EMA (configurable length), VWAP, and Supertrend are used to define overall trend direction and to gate signals.
• Momentum: RSI (configurable length and upper/lower thresholds) helps confirm momentum and optional divergence blocking.
• Market Structure: BOS / CHoCH (Break of Structure / Change of Character) logic with MTF pivots to detect structure-based opportunities.
• Signal Types: Partial signals appear early as potential setups; Confirmed signals meet stricter multi-factor conditions (EMA/VWAP/Supertrend + RSI + optional MTF).
• Repaint Safety: Non-repaint mode available (triggers only after candle close).
• Alerts: Built-in alert messages with optional JSON webhook format.
• Customization: Flexible inputs for sessions, pivots, labels, colors, lookbacks, and MTF parameters to adapt across multiple timeframes.
How to Interpret Signals
• Treat Partial signals as setups to monitor — not instant entries. Wait for confirmation or confluence from price behavior.
• Treat Confirmed signals as higher-probability opportunities that satisfy trend and momentum alignment.
• Enable MTF confirmation selectively on smaller timeframes (e.g., 5m using 15m/1H confirmation).
• Use Non-repaint mode (trigger only after candle close) for safe alert generation.
Limitations & Risk Notice
This indicator does not guarantee profits or accuracy. It is a technical and educational tool meant to assist analysis.
All trading decisions, entries, and exits are the sole responsibility of the user. Always perform backtesting and paper trading before live use.
This is not financial advice.
Version Note & Support
This is a closed invite-only script. The indicator includes configuration options for labels, alerts, and MTF pivots.
For approved users seeking modifications or usage details, please contact the author (see Author’s Instructions section).

BTC LL->HH Liquidity Sweep / BOS / Retest / 4H Bias v6_8BTC LL->HH Liquidity Sweep / BOS / Retest / 4H Bias v6_8

Multi Timeframe BOS & rBOSThis is the same Multi-Timeframe Break of Structure and Market Structure Shift posted by Lenny_Kiruthu. However, the only difference is the naming of Market Structure Shift to rBOS (Break of Structure Reverse). To me, they are all break of structures when previous peaks or valleys are violated. The only difference is in sequence. Once a sequence of BOS reverses, then a new sequence begins. To me, this simplifies the various terminology incorporated by different systems such as ICT or SMT which adds unnecessary complexity.
eT
