Breakdown Sniper [Riz]Breakdown Sniper is a complete structural-based price-action system designed to identify and validate three major setups
1. Failed Breakdowns (FBD)
2. Breakouts / Breakdowns (BO)
3. Back-Tests (BT)
The script analyzes swing structure, undercuts, reclaim behavior, channel bias, support/resistance levels, and a multi-layer confluence engine to highlight high-quality long/short signals.
It also includes trade management, target projections, trailing logic, risk models, and an optional dashboard for clarity.
Core Concepts Behind the System
1. Pivot Structure & New Low/High Logic
Breakdown Sniper continuously detects pivot highs and lows using user-defined left/right bars.
These pivots are used to determine
⦁ Recent structural lows/highs
⦁ Undercuts (for failed breakdowns)
⦁ Structural breaks (for FBO/BO setups)
This provides the foundation for all three setup types.
2. Failed Breakdown (FBD) Detection
The primary logic of the script is to detect failed breakdowns, which follow this sequence:
1. Identify an initial pivot low
2. Price undercuts that low
3. Price reclaims the level by a specified number of points
4. Optional: new higher low print confirming strength
5. Once confirmed, the script calculates:
⦁ Entry trigger price
⦁ Stop placement (multiple options: below undercut, below initial low, ATR-based, fixed)
⦁ Three profit targets based on risk multiples
The reverse logic is applied for failed breakouts (FBO).
3. Breakouts & Breakdowns (BO)
The system also captures momentum breakouts/breakdowns defined by:
⦁ Price breaking major support/resistance
⦁ Bar-level strength (close vs range)
⦁ ATR-based expansion
⦁ Holding above/below breakout level for a user-defined number of bars
If confirmed, the script projects T1/T2/T3 targets and stop placement automatically.
4. Back-test Setups (BT)
After a confirmed breakout/breakdown, the script monitors for a return to the breakout level, within a percentage tolerance.
If a clean retest occurs:
⦁ A BT Long or BT Short setup is generated
⦁ Risk and target calculations are performed automatically
This allows identifying continuation setups after strong breaks.
Channel & Levels System (Support/Resistance Engine)
The script builds a hybrid S/R and environment model using:
⦁ Regression channel OR
⦁ Donchian, Keltner, Bollinger channels (user-selectable)
The channel provides:
⦁ Upper/Lower boundaries
⦁ Midline
⦁ Trend bias based on slope
Additionally, a multi-touch support/resistance detector clusters pivot-based levels and scores them by:
⦁ Touch count
⦁ Recency
⦁ Age
⦁ Whether they classify as major levels
This explains where reversals and breakouts are most likely.
Confluence Engine
Every Long/Short signal receives a 0–100 score derived from:
⦁ Market structure: HH/HL or LL/LH
⦁ Trend filter (EMA-based)
⦁ Volatility conditions (ATR range requirements)
⦁ Session bias (Asian / London / New York / Overlap)
⦁ Volume expansion
⦁ Higher-timeframe trend (optional)
⦁ Location inside channel
⦁ Distance to nearest S/R
⦁ Setup-type priority (FBD/BO/BT)
Users can require a minimum score before a signal becomes valid.
Trade Management Logic
Once a trade triggers, the indicator handles:
⦁ Entry execution confirmation
⦁ Stop loss tracking
⦁ Three independent profit targets
⦁ Optional scale-ins
⦁ ATR-based trailing stop
⦁ Risk calculations
⦁ Real-time PnL monitoring
The script does not execute live trades — it only visualizes management levels for analysis.
Visual Components
Breakdown Sniper plots:
⦁ Channels & fills
⦁ Auto-detected S/R levels
⦁ Pivot highs/lows
⦁ Buy/Sell markers
⦁ Entry/Stop/Targets
⦁ Trade dashboard (optional)
⦁ Equity curve (optional)
Everything is toggle-based for clean charting.
How To Use the Indicator
Recommended Use-Case
⦁ Futures (ES/NQ/CL/RTY)
⦁ Indices
⦁ Crypto
⦁ FX
Works well on:
⦁ 5m / 15m / 1H
Signals do not repaint because pivots and reclaim sequences require bar completion.
Basic Usage Steps
1. Enable the setups you want to trade: FBD, BO, BT
2. Optionally turn on filters:
⦁ Trend filter
⦁ Volatility filter
⦁ Market structure filter
⦁ MTF trend filter
3. Wait for a valid long/short signal with sufficient confluence
4. Follow the plotted entry level, stop, and targets
5. Use the dashboard to monitor performance of each setup type
Important Notes
This is a structural/price-action tool, not a prediction model
No guarantee of profitability is provided
The indicator is educational and analytical
Always use independent confirmation and risk management
Disclaimer
This script is for education and analysis. It does not provide financial advice. Markets involve risk. Past behavior of any pattern or study does not imply future results. You are responsible for your own decisions.
Pesquisar nos scripts por "BOS"

Market Structure Trailing Stop MTF [Inspired by LuxAlgo]# Market Structure Trailing Stop MTF
**OPEN-SOURCE SCRIPT**
*208k+ views on original · Modified for MTF Support*
This indicator is a direct adaptation of the renowned **Market Structure Trailing Stop** by **LuxAlgo** (original script: [Market Structure Trailing Stop ]()). The core logic remains untouched, providing dynamic trailing stops based on market structure breaks (CHoCH/BOS). The **only modification** is the addition of **Multi-Timeframe (MTF) support**, allowing users to apply the trailing stops and structures from **higher timeframes (HTF)** directly on their current chart. This enhances usability for traders analyzing cross-timeframe confluence without switching charts.
**Special thanks to LuxAlgo** for releasing this powerful open-source tool under CC BY-NC-SA 4.0. Your contributions to the TradingView community have inspired countless traders—grateful for the solid foundation!
## 🔶 How the Script Works: A Deep Dive
At its heart, this indicator detects **market structure shifts** (bullish or bearish breaks of swing highs/lows) and uses them to generate **adaptive trailing stops**. These stops trail the price while protecting profits and acting as dynamic support/resistance levels. The MTF enhancement pulls this logic from user-specified higher timeframes, overlaying HTF structures and stops on the lower timeframe chart for seamless multi-timeframe analysis.
### Core Logic (Unchanged from LuxAlgo's Original)
1. **Pivot Detection**:
- Uses `ta.pivothigh()` and `ta.pivotlow()` with a user-defined lookback (`length`) to identify swing highs (PH) and lows (PL).
- Coordinates (price `y` and bar index/time `x`) are stored in persistent variables (`var`) for tracking recent pivots.
2. **Market Structure Detection**:
- **Bullish Structure (BOS/CHoCH)**: Triggers when `close > recent PH` (break above swing high).
- If `resetOn = 'CHoCH'`, resets only on major shifts (Change of Character); otherwise, on all breaks.
- Sets trend state `os = 1` (bullish) and highlights the break with a horizontal line (dashed for CHoCH, dotted for BOS).
- Initializes trailing stop at the local minimum (lowest low since the pivot) using a backward loop: `btm = math.min(low , btm)`.
- **Bearish Structure**: Triggers when `close < recent PL`, mirroring the bullish logic (`os = -1`, local maximum for stop).
- Structure state `ms` tracks the break type (1 for bull, -1 for bear, 0 neutral), resetting based on user settings.
3. **Trailing Stop Calculation**:
- Tracks **trailing max/min**:
- On new bull structure: Reset `max = close`.
- On new bear: Reset `min = close`.
- Otherwise: `max = math.max(close, max)` / `min = math.min(close, min)`.
- **Stop Adjustment** (the "trailing" magic):
- On fresh structure: `ts = btm` (bull) or `top` (bear).
- In ongoing trend: Increment/decrement by a percentage of the max/min change:
- Bull: `ts += (max - max ) * (incr / 100)`
- Bear: `ts += (min - min ) * (incr / 100)`
- This creates a **ratcheting effect**: Stops move favorably with the trend but never against it, converging toward price at a controlled rate.
- **Visuals**:
- Plots `ts` line colored by trend (teal for bull, red for bear).
- Fills area between `close` and `ts` (orange on retracements).
- Draws structure lines from pivot to break point.
4. **Edge Cases**:
- Variables like `ph_cross`/`pl_cross` prevent multiple triggers on the same pivot.
- Neutral state (`ms = 0`) preserves prior `max/min` until a new structure.
### MTF Enhancement (Our Addition)
- **request.security() Integration**:
- Wraps the entire core function `f()` in a security call for each timeframe (`tf1`, `tf2`).
- Returns HTF values (e.g., `ts1`, `os1`, structure times/prices) to the chart's context.
- Uses `lookahead=barmerge.lookahead_off` for accurate historical repainting-free data.
- Structures are drawn using `xloc.bar_time` to align HTF lines precisely on the LTF chart.
- **Multi-Output Handling**:
- Separate plots/fills/lines for each TF (e.g., `plot_ts1`, `plot_ts2`).
- Colors and toggles per TF to distinguish HTF1 (e.g., teal/red) from HTF2 (e.g., blue/maroon).
- **Benefits**: Spot HTF bias on LTF entries, e.g., enter longs only if both TF1 (1H) and TF2 (4H) show bullish `os=1`.
This keeps the script lightweight—**no repainting, max 500 lines**, and fully compatible with LuxAlgo's original behavior when TFs are set to the chart's timeframe.
## 🔶 SETTINGS
### Core Parameters
- **Pivot Lookback** (`length = 14`): Bars left/right for pivot detection. Higher = smoother structures, fewer signals; lower = more noise.
- **Increment Factor %** (`incr = 100`): Speed of stop convergence (0-∞). 100% = full ratchet (mirrors max/min exactly); <100% = slower trail, reduces whipsaws.
- **Reset Stop On** (`'CHoCH'`): `'CHoCH'` = Reset only on major reversals (dashed lines); `'All'` = Reset on every BOS/CHoCH (tighter stops).
### MTF Support
- **Timeframe 1** (`tf1 = ""`): HTF for first set (e.g., "1H"). Empty = current chart.
- **Timeframe 2** (`tf2 = ""`): Second HTF (e.g., "4H"). Enables dual confluence.
### Display Toggles
- **Show Structures** (`true`): Draws horizontal lines for breaks (per TF colors).
- **Show Trailing Stop TF1/TF2** (`true`): Plots the stop line.
- **Show Fill TF1/TF2** (`true`): Area fill between close and stop.
### Candle Coloring (Optional)
- **Color Candles** (`false`): Enables custom `plotcandle` for body/wick/border.
- **Candle Color Based On TF** (`"None"`): `"TF1"`, `"TF2"`, or none. Colors bull trend green, bear red.
- **Candle Colors**: Separate inputs for bull/bear body, wick, border (e.g., solid green body, transparent wick).
### Alerts
- **Enable MS Break Alerts** (`false`): Notifies on structure breaks (bull/bear per TF) **only on bar close** (`barstate.isconfirmed` + `alert.freq_once_per_bar_close`).
- **Enable Stop Hit Alerts** (`false`): Triggers on stop breaches (long/short per TF), using `ta.crossunder/crossover`.
### Colors
- **TF1 Colors**: Bullish (teal), Bearish (red), Retracement (orange).
- **TF2 Colors**: Bullish (blue), Bearish (maroon), Retracement (orange).
- **Area Transparency** (`80`): Fill opacity (0-100).
## 🔶 USAGE
Trailing stops shine in **trend-following strategies**:
- **Entries**: Use structure breaks as signals (e.g., long on bullish BOS from HTF1).
- **Exits**: Trail stops for profit-locking; alert on hits for automation.
- **Confluence**: Overlay HTF1 (e.g., 1H) for bias, HTF2 (e.g., Daily) for major levels—enter LTF only on alignment.
- **Risk Management**: Lower `incr` avoids early stops in chop; reset on `'All'` for aggressive trailing.
! (i.imgur.com)
*HTF1 shows bullish structure (teal line), trailing stop ratchets up—long entry confirmed on LTF pullback.*
! (i.imgur.com)
*TF1 (blue) bearish, TF2 (red) neutral—avoid shorts until alignment.*
! (i.imgur.com)
*Colored based on TF1 trend: Green bodies on bull `os=1`.*
Pro Tip: Test on demo—pair with LuxAlgo's other tools like Smart Money Concepts for full structure ecosystem.
## 🔶 DETAILS: Mathematical Breakdown
On bullish break:
- Local min: `btm = ta.lowest(n - ph_x)` (optimized loop equivalent).
- Stop init: `ts = btm`.
- Update: `Δmax = max - max `, `ts_new = ts + Δmax * (incr/100)`.
Bearish mirrors with `Δmin` (negative, so decrements `ts`).
In MTF: HTF `time` aligns lines via `line.new(htf_time, level, current_time, level, xloc.bar_time)`.
No logs/math libs needed—pure Pine v5 efficiency.
## Disclaimer
This is for educational purposes. Not financial advice. Backtest thoroughly. Original by LuxAlgo—modify at your risk. See TradingView's (www.tradingview.com). Licensed under CC BY-NC-SA 4.0 (attribution to LuxAlgo required).

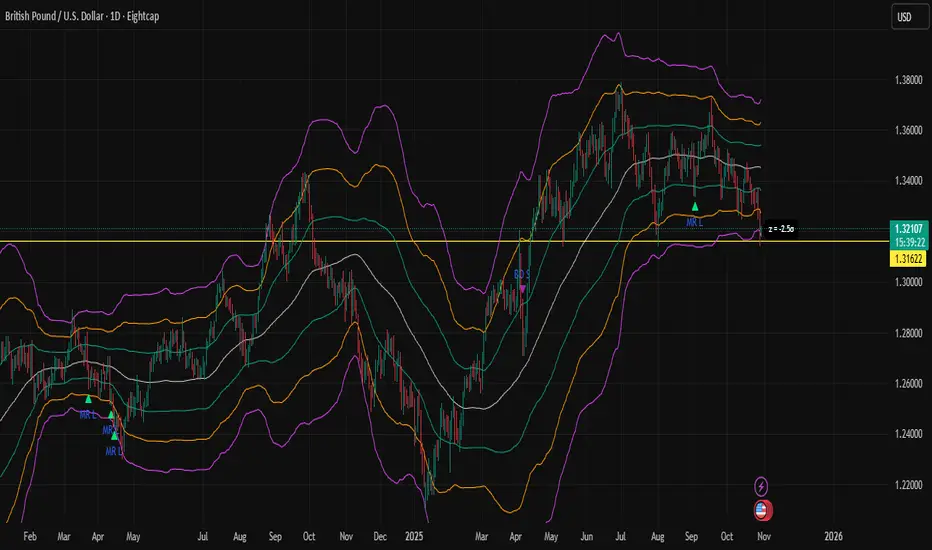
Z-Score Bands + SignalsZ-Score Statistical Market Analyzer
A multi-dimensional market structure indicator based on standardized deviation & regime logic
English Description
Concept
This indicator builds a statistical model of price behaviour by converting every candle’s movement into a Z-score — how many standard deviations each close is away from its moving average.
It visualizes the normal distribution structure of returns and provides adaptive entry signals for both Mean Reversion and Breakout regimes.
Rather than predicting price direction, it measures statistical displacement from equilibrium and dynamically adjusts the decision logic according to the market’s volatility regime.
⚙️ Main Components
Z-Score Bands (±1σ, ±2σ, ±3σ)
– The core structure visualizes volatility boundaries based on rolling mean and standard deviation.
– Price outside ±2σ often indicates statistical extremes.
Dual Signal Systems
Mean Reversion (MRL / MRS): when price (or return z-score) crosses back inside ±2σ bands.
Breakout (BOL / BOS): when price continues to expand beyond ±2σ.
Volatility Regime Classification
The indicator detects whether the market is currently in a low-vol or high-vol regime using percentile statistics of σ.
Low vol → Mean Reversion preferred
High vol → Breakout preferred
🧠 Adaptive Switches
A. Freeze MA/σ - Use previous-bar stats to avoid repainting and lag.
B. Confirm on Close - Only generate signals once the base-timeframe bar closes (eliminates look-ahead bias).
C. Return-based Signal - Use log-return Z-score instead of price deviation — normalizes volatility across assets.
D. Outlier Filter - Exclude bars with abnormal single-bar returns (e.g., >20%). Reduces false spikes.
E. Regime Gating - Automatically switch between Mean Reversion and Breakout logic depending on volatility percentile.
Each module can be toggled individually to test different statistical behaviours or tailor to a specific market condition.
📊 Interpretation
When the histogram of returns approximates a normal distribution, mean-reversion logic is often more effective.
When price persistently drifts beyond ±2σ or ±3σ, the distribution becomes leptokurtic (fat-tailed) — a breakout structure dominates.
Hence, this tool can help you:
Identify whether an asset behaves more “Gaussian” or “fat-tailed”;
Select the correct trading regime (MR or BO);
Quantitatively measure market tension and volatility clusters.
🧩 Recommended Use
Works on any timeframe and any asset.
Best used on liquid instruments (e.g., XAU/USD, indices, major FX pairs).
Combine with volume, sentiment or structural filters to confirm signals.
For strategy automation, pair with the companion script:
🧠 “Z-Score Strategy • Multi-Source Confirm (MRL/MRS/BOL/BOS)”.
⚠️ Disclaimer
This script is designed for educational and research purposes.
Statistical deviation ≠ directional prediction — use with sound risk management.
Past distribution patterns may shift under new volatility regimes.
==================================================================================
中文说明(简体)
概念简介
该指标基于价格的统计分布原理,将每根 K 线的波动转化为标准化的 Z-Score(标准差偏离值),用于刻画市场处于均衡或偏离状态。
它同时支持 均值回归(Mean Reversion) 与 突破延展(Breakout) 两种逻辑,并可根据市场波动结构自动切换策略模式。
⚙️ 主要功能模块
Z-Score 通道(±1σ / ±2σ / ±3σ)
用滚动均值与标准差动态绘制的统计波动带,价格超出 ±2σ 区域通常意味着极端偏离。
双信号系统
MRL / MRS(均值回归多空):价格重新回到 ±2σ 以内时触发。
BOL / BOS(突破延展多空):价格持续运行在 ±2σ 之外时触发。
波动率分层
自动识别市场处于高波动还是低波动区间:
低波动期 → 适合均值回归逻辑;
高波动期 → 适合突破趋势逻辑。
🧠 A–E 模块说明
A. 固定统计参数:使用上一根 K 线的均值和标准差,防止重绘。
B. 收盘确认信号:仅在当前时间框架收盘后生成信号,避免前视偏差。
C. 收益率信号模式:采用对数收益率的 Z-Score,更具普适性。
D. 异常波过滤:忽略单根极端波动(如 >20%)的噪声信号。
E. 波动率调节逻辑:根据市场处于高/低波动区间,自动切换 MRL/MRS 或 BOL/BOS。
📊 应用解读
如果收益率分布接近正态分布 → 市场倾向震荡,MRL/MRS 效果较佳;
若价格频繁偏离 ±2σ 或 ±3σ → 市场呈现“肥尾”分布,趋势延展占主导。
因此,该指标的核心目标是:
识别当前市场的统计结构类型;
根据波动特征自动切换交易逻辑;
提供结构化、可量化的市场状态刻画。
💡 使用建议
适用于所有时间框架与金融品种。
建议结合成交量或结构性指标过滤。
若用于策略回测,可搭配同名 “Z-Score Strategy • Multi-Source Confirm” 策略脚本。
⚠️ 免责声明
本指标仅用于研究与教学,不构成任何投资建议。
统计偏离 ≠ 趋势预测,实际市场行为可能在不同波动结构下改变。
ICT PDA - Gold & BTC (QuickScalp Bias/FVG/OB/OTE + Alerts)What this script does
This indicator implements a complete ICT Price Delivery Algorithm (PDA) workflow tailored for XAUUSD and BTCUSD. It combines HTF bias, OTE zones, Fair Value Gaps, Order Blocks, micro-BOS confirmation, and liquidity references into a single, cohesive tool with early and final alerts. The script is not a mashup for cosmetic plotting; each component feeds the next decision step.
Why this is original/useful
Symbol-aware impulse filter: A dynamic displacement threshold kTune adapts to Gold/BTC volatility (body/ATR vs. per-symbol factor), reducing noise on fast markets without hiding signals.
Scalping preset: “Quick Clean” mode limits drawings to the most recent bars and keeps only the latest FVG/OB zones for a clear chart.
Three display modes: Full, Clean, and Signals-Only to match analysis vs. execution.
Actionable alerts: Early heads-up when price enters OTE in the HTF bias direction, and Final alerts once mitigation + micro-break confirm the setup.
How it works (high-level logic)
HTF Bias: Uses request.security() on a user-selected timeframe (e.g., 240m) and EMA filter. Bias = close above/below HTF EMA.
Dealing Range & OTE: Recent swing high/low (pivot length configurable) define the range; OTE (62–79%) boxes are drawn contextually for up/down ranges.
Displacement: A candle’s body/ATR must exceed kTune and break short-term structure (displacement up/down).
FVG: 3-bar imbalance (bull: low > high ; bear: high < low ). Latest gaps are tracked and extended.
Order Blocks: Last opposite candle prior to a qualifying displacement that breaks recent highs/lows; zones are drawn and extended.
Entry & Alerts:
Long: Bullish bias + price inside buy-OTE + mitigation of a bullish FVG or OB + micro BOS up → “PDA Long (Final)”.
Short: Bearish bias + price inside sell-OTE + mitigation of a bearish FVG or OB + micro BOS down → “PDA Short (Final)”.
Early Alerts: Trigger as soon as price enters OTE in the direction of the active bias.
Inputs & controls (key ones)
Bias (HTF): timeframe minutes, EMA length.
Structure: ATR length, Impulse Threshold (Body/ATR), swing pivot length, OB look-back.
OTE/FVG/OB/LP toggles: show/hide components.
Auto-Tune: per-symbol factors for Gold/BTC + manual tweak.
Display/Performance: View Mode, keep-N latest FVG/OB, limit drawings to last N bars.
Recommended usage (scalping)
Timeframes: Execute on M1–M5 with HTF bias from 120–240m.
Defaults (starting point): ATR=14, Impulse Threshold≈1.6; Gold factor≈1.05, BTC factor≈0.90; Keep FVG/OB=2; last 200–300 bars; View Mode=Clean.
Workflow: Wait for OTE in bias direction → see mitigation (FVG/OB) → confirm with micro BOS → manage risk to nearest liquidity (prev-day H/L or recent swing).
Alerts available
“PDA Early Long/Short”
“PDA Long (Final)” / “PDA Short (Final)”
Attach alerts on “Any alert() function call” or the listed conditions.
Chart & screenshots
Please include symbol and timeframe on screenshots. The on-chart HUD shows the script name and state to help reviewers understand context.
Limitations / notes
This is a discretionary framework. Signals can cluster during news or extreme volatility; use your own risk management. No guarantee of profitability.
Changelog (brief)
v1.2 QuickScalp: added Quick Clean preset, safer array handling, symbol-aware impulse tuning, display modes.
------------------------------
ملخص عربي:
المؤشر يطبق تسلسل PDA عملي للذهب والبتكوين: تحيز من فريم أعلى، مناطق OTE، فجوات FVG، بلوكات أوامر OB، وتأكيد micro-BOS، مع تنبيهات مبكرة ونهائية. تمت إضافة وضع “Quick Clean” لتقليل العناصر على الشارت وحساسية إزاحة تتكيّف مع الأصل. للاستخدام كسكالب: نفّذ على M1–M5 مع تحيز 120–240 دقيقة، وابدأ من الإعدادات المقترحة بالأعلى. هذا إطار سلوكي وليس توصية مالية.

Racktor Analysis Assistant
Racktor Analysis Assistant — Feature Overview
The Racktor Analysis Assistant is a multi-module market-structure toolkit that plots pivots, BoS/ChoCh levels, session breakouts, inside bars, and higher-timeframe BTS/STB trap signals — with complete styling controls and alerting.
Smart Pivot Engine (ZigZag Core)
- Adaptive pivot period switching based on timeframe threshold.
- ZigZag stream tracks pivot types (H/L, HH/HL/LH/LL) with Major & Minor streams.
- Clean visuals: optional ZigZag line & pivot labels with customizable style, width, and color.
Major & Minor Structure Signals
- Detects BoS and ChoCh for both Major and Minor swings.
- Updates External Trend on Major events and Internal Trend on Minor events.
- One-time triggers per level via locking.
- Per-category styling for Major/Minor Bullish & Bearish BoS and ChoCh.
- Alerts with symbol, pivot, timeframe, and time, limited to specific timeframes if desired.
Inside Bar Module
- Toggleable Inside Bar detection.
- Custom colors for bullish and bearish inside bars.
- Optional alerts on detection.
Session Breakout Suite
- Custom session window with shaded box.
- On session close, plots High/Mid/Low breakout lines extendable for N hours.
- Optional previous day & week high/low lines.
- Breakout vs Liquidity Sweep modes (close-based or wick-based confirmation).
- Display styles: Fixed (triangles) or Moving (vertical dotted lines).
- Alerts for “first event” or “every event.”
BTS/STB Trap (Higher-Timeframe ID1/ID2 Logic)
- BTS/STB toggle with selectable check timeframe (default: 4H).
- STB (bullish, Sell→Buy): strict ID1/ID2 relationships, both candles bullish; green circle below HTF ID1 low.
- BTS (bearish, Buy→Sell): strict ID1/ID2 relationships, both candles bearish; red circle above HTF ID1 high.
- Non-repainting; dots appear only at HTF candle close.
- Timeframe-aware rendering (dots show only on selected timeframe).
- Alerts for STB/BTS at HTF close.
Styling & Limits
- Per-feature color/style/width customization.
- Generous limits for boxes, labels, and lines.
- Session tools limited to ≤ 120-minute charts for accuracy.
Anti-Repaint
- HTF signals use lookahead_off and HTF-close gating to avoid repainting.
- BoS/ChoCh and Session logic track prior values and use locks to prevent duplicates.
Quick Start
Set the Timeframe Threshold and pivot periods for lower/higher TFs.
Enable desired Major/Minor BoS/ChoCh lines and customize styles.
Activate Inside Bar Module if required.
Configure Session Breakout window, mode, and alert settings.
Enable BTS/STB detection, keeping 4H default or selecting a custom TF.
Add alerts for chosen signals and let the assistant annotate structure, sessions, and HTF traps.
Best Use with Racktor's Core Trading Strategy
For traders who want structure clarity without clutter, this Analysis-Assistant is built to keep your chart actionable and adaptive.

Whale Fractal Levels (V1.0)What it does
This indicator plots Fractal Levels (Bill Williams pivots) as horizontal lines and prints clean signals for:
BO+ / BO− → Breakouts through the latest fractal high/low
SW↑ / SW↓ → Liquidity sweeps (wick pierces, close rejects)
RE+ / RE− → Retests of the broken level after a confirmed breakout
Cyan = support (fractal lows).
Lilac = resistance (fractal highs).
How it works
Detects fractals with Left/Right = lr. A pivot is confirmed after lr bars on the right → the level itself doesn’t repaint.
Each confirmed fractal spawns a horizontal line extended to the right. You can limit how many lines stay on chart and auto-expire old ones.
Signals reference the most recent fractal high/low only and are edge-triggered (crossover/crossunder) with a cooldown so you don’t get a marker on every bar near the level.
A small state machine remembers the last breakout to validate the next retest.
Inputs (Settings)
Fractals
Left/Right (BW fractal) — Sensitivity of pivots (lower = more reactive, higher = cleaner).
MAX number of levels to display — Keep only the most recent N lines.
Level lifetime (bars) — Auto-delete lines after N bars to declutter.
Signals
Cooldown between signals (bars) — Minimum spacing between markers (anti-spam).
Show Breakouts (BO±) — Toggle breakout markers.
Show Sweeps (SW↑/SW↓) — Toggle sweep markers.
Show Retests (RE±) — Toggle retest markers.
Display
Show fractal lines / Line width / Line transparency (0..100)
Alerts (ready to use)
BO+ (Fractal), BO- (Fractal)
SW↑ (Fractal), SW↓ (Fractal)
RE+ (Fractal), RE- (Fractal)

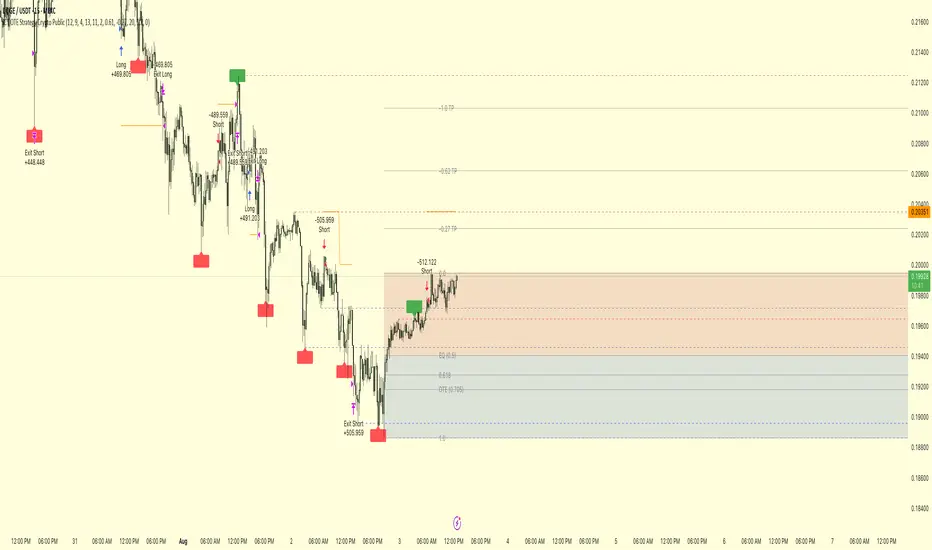
ICT OTE Strategy Crypto PublicICT OTE Strategy Crypto Public
This strategy automates a classic ICT (Inner Circle Trader) setup specifically tailored for the high-volatility nature of cryptocurrency markets. It aims to enter a trade on a retracement after a confirmed Break of Structure (BOS), using a dual-swing detection method to validate the market's direction before looking for an entry.
The entire process is automated, from identifying the market structure to managing the trade with advanced risk management options. This version uses a percentage of equity for its order sizing, which is ideal for crypto trading.
How It Works
Dual Swing Detection: The strategy uses two different sets of swing strengths to analyze market structure for higher accuracy:
Entry Swings: Weaker, more sensitive swings used to define the immediate dealing range for a potential trade.
Validator Swings: Stronger, more significant swings used to confirm a true Break of Structure.
Break of Structure (BOS): A trade setup is only considered valid after a strong "Validator" swing breaks through a previous "Entry" swing. This confirms the market's intended direction and filters out weak or false moves.
Identify Retracement Leg: After a confirmed BOS, the strategy identifies the most recent "Entry Swing" price leg that led to the break.
Auto-Fibonacci: It automatically draws a Fibonacci retracement over this leg, from the start of the move (1.0) to the end (0.0).
Trade Entry: A limit order is placed at a user-defined Fibonacci level (defaulting to 0.618), anticipating a price pullback into a discount or premium array.
After a bullish BOS, it looks to BUY the retracement.
After a bearish BOS, it looks to SELL the retracement.
Risk Management:
Stop Loss is placed at the start of the leg (the 1.0 level).
Take Profit is placed at a user-defined level (defaulting to the 0.0 level, with extension options).
Includes an option to move the stop loss to break-even after the trade has moved a certain distance in profit.
How to Use
Asset Selection: This strategy is designed for cryptocurrency markets. Its use of percentage-based order sizing is not suitable for tick-based markets like futures.
Swing Settings: Adjust the "Entry Swing" and "Validator" strengths to match the volatility and timeframe of the asset you are trading. Higher numbers will result in fewer, more significant setups.
Backtest: Use the Strategy Tester to optimize the "FIB Entry Level," "Take Profit Level," and "Swing Sensitivity" to find the best settings for your specific market and timeframe.
ICT OTE Strategy Futures PublicICT OTE Strategy
This strategy automates a classic ICT (Inner Circle Trader) setup that aims to enter a trade on a retracement after a confirmed Break of Structure (BOS). It is designed to identify high-probability setups by waiting for the market to show its hand before looking for an entry within a "discount" or "premium" array.
The entire process is automated, from identifying the market structure to managing the trade with a dynamic stop loss.
How It Works
Break of Structure (BOS): The strategy first waits for a strong, validated swing to break a previous, weaker swing high or low. This confirms the market's intended direction.
Identify Retracement Leg: After a BOS, the strategy identifies the most recent price leg that led to the break.
Auto-Fibonacci: It automatically draws a Fibonacci retracement over this leg, from the start of the move (1.0) to the end (0.0).
Trade Entry: A limit order is placed at a user-defined Fibonacci level (defaulting to 0.508), anticipating a price pullback.
After a bullish BOS, it looks to BUY the retracement.
After a bearish BOS, it looks to SELL the retracement.
Risk Management:
Stop Loss is placed at the start of the leg (the 1.0 level).
Take Profit is placed at a user-defined level (defaulting to the 0.0 level).
Includes an option to move the stop loss to break-even after the trade has moved a certain distance in profit.
How to Use
Swing Settings: Adjust the "Entry Swing" and "Validator" strengths to match the volatility and timeframe of the asset you are trading. Higher numbers will result in fewer, more significant setups.
Session Filter: Use the "Trading Sessions" filter to align the strategy with ICT's "killzone" concept, ensuring trades are only taken during high-volume periods like the New York session.
Backtest: Use the Strategy Tester to optimize the "FIB Entry Level," "Take Profit Level," and "Min Trade Range" to find the best settings for your specific market and timeframe.

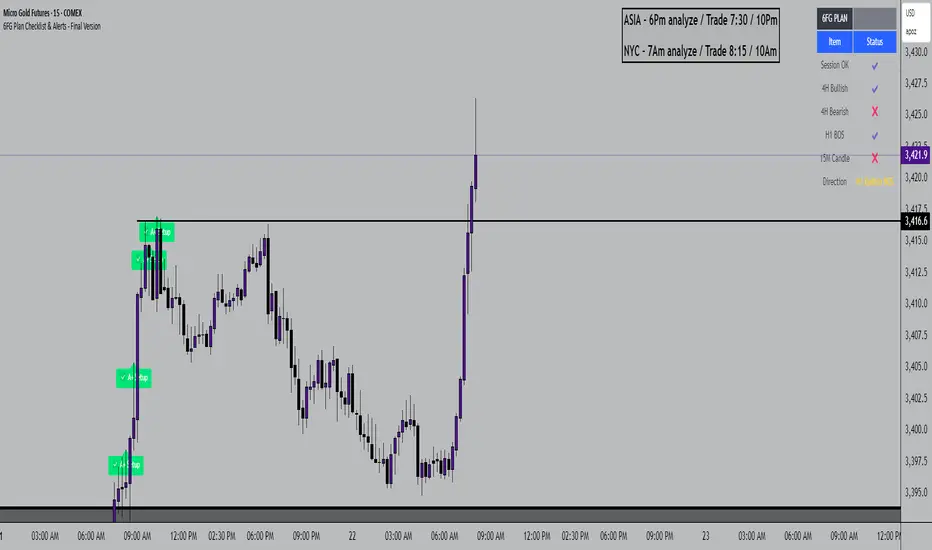
6FG Plan Checklist & Alerts - Final Version🧠 SCRIPT OVERVIEW: "6FG A+ SETUP - Simplified"
This script is designed to identify high-probability A+ trade setups in alignment with your personal 6FG trading plan, based on:
H1 Break of Structure (required)
4H trend confirmation
15M candle confirmation
Session filter
A+ Label & Visual Table Checklist
✅ KEY COMPONENTS
1. Toggle Inputs
These allow you to customize your view and filters without changing the code:
showSession: Only allow alerts inside Asian or NY sessions
show4hTrend: Include or ignore 4H directional bias
show15mConfirm: Include or ignore confirmation from 15M candles
showTable: Display checklist table on chart
showLabel: Display the “✅ A+” label on qualifying bars
2. Session Filter
Defines valid timeframes for trading (Asian or New York)
Helps avoid setups during low-liquidity hours
Controlled by showSession
3. 4H Trend (Confirmation Only)
Uses a 20-period SMA on 4H to detect general bias:
Bullish = Price above SMA
Bearish = Price below SMA
This trend is not mandatory for an alert if toggle is off
4. H1 Break of Structure (REQUIRED)
Looks at the highest high and lowest low of the last 10 candles on the 1H timeframe
Detects either:
Bullish BOS = Current close > highest high
Bearish BOS = Current close < lowest low
This is the core trigger for the A+ setup
If BOS doesn't happen, no entry is valid
5. 15M Confirmation Candles
(Optional - controlled by show15mConfirm)
Checks for one of three confirmation patterns:
Bullish Engulfing
Bearish Engulfing
Pin Bar
This adds confidence but can be toggled off
6. Entry Conditions (A+ Setup)
All the following must be true for entryOK = true:
✅ H1 BOS (required)
✅ Session is valid (if toggle is on)
✅ 15M confirmation pattern (if toggle is on)
✅ 4H trend (if toggle is on)
7. Visual Output
If entryOK = true:
✅ A green "A+" label appears below price
✅ A checklist table on the top-right shows:
Session status ✔️❌
4H bullish/bearish ✔️❌
H1 BOS ✔️❌
15M confirmation ✔️❌
Final Direction: Bullish / Bearish / —
A+ Setup: ✔️❌
8. Alerts
You will receive a TradingView alert when an A+ Setup is detected:
Contrarian Market Structure BreakMarket Structure Break application was inspired and adapted from Market Structure Oscillator indicator developed by Lux Algo. So much credit to their work.
This indicator pairs nicely with the Contrarian 100 MA and can be located here:
Indicator Description: Contrarian Market Structure BreakOverview
The "Contrarian Market Structure Break" indicator is a versatile tool tailored for traders seeking to identify potential reversal opportunities by analyzing market structure across multiple timeframes. Built on Institutional Concepts of Structure (ICT), this indicator detects Break of Structure (BOS) and Change of Character (CHoCH) patterns across short-term, intermediate-term, and long-term swings, plotting them with customizable lines and labels. It generates contrarian buy and sell signals when price breaks key swing levels, with a unique "Blue Dot Tracker" to monitor consecutive buy signals for trend confirmation. Optimized for the daily timeframe, this indicator is adaptable to other timeframes with proper testing, making it ideal for traders of forex, stocks, or cryptocurrencies.
How It Works
The indicator combines three key components to provide a comprehensive view of market dynamics: Multi-Timeframe Market Structure Analysis: It identifies swing highs and lows across short-term, intermediate-term, and long-term periods, plotting BOS (continuation) and CHoCH (reversal) events with customizable line styles and labels.
Contrarian Signal Generation: Buy and sell signals are triggered when the price crosses below swing lows (buy) or above swing highs (sell), indicating potential reversals in overextended markets.
Blue Dot Tracker: A unique feature that counts consecutive buy signals ("blue dots") and highlights a "Hold Investment" state with a yellow background when three or more buy signals occur, suggesting a potential trend continuation.
Signals are visualized as small circles below (buy) or above (sell) price bars, and a table in the bottom-right corner displays the blue dot count and recommended action (Hold or Flip Investment), enhancing decision-making clarity.
Mathematical Concepts Swing Detection: The indicator identifies swing highs and lows by comparing price patterns over three bars, ensuring robust detection of pivot points. A swing high occurs when the middle bar’s high is higher than the surrounding bars, and a swing low occurs when the middle bar’s low is lower.
Market Structure Logic: BOS is detected when the price breaks a prior swing high (bullish) or low (bearish) in the direction of the current trend, while CHoCH signals a potential reversal when the price breaks a swing level against the trend. These are calculated across three timeframes for a multi-dimensional perspective.
Blue Dot Tracker: This feature counts consecutive buy signals and tracks the entry price. If three or more buy signals occur without a sell signal, the indicator enters a "Hold Investment" state, marked by a yellow background, until the price exceeds the entry price or a sell signal occurs.
Entry and Exit Rules Buy Signal (Blue Dot Below Bar): Triggered when the closing price crosses below a swing low on either the intermediate-term or long-term timeframe, suggesting an oversold condition and potential reversal upward. Short-term signals can be enabled but are disabled by default to reduce noise.
Sell Signal (White Dot Above Bar): Triggered when the closing price crosses above a swing high on either the intermediate-term or long-term timeframe, indicating an overbought condition and potential reversal downward.
Blue Dot Tracker Logic: After a buy signal, the indicator increments a blue dot counter and records the entry price. If three or more consecutive buy signals occur (blueDotCount ≥ 3), the indicator enters a "Hold Investment" state, highlighted with a yellow background, suggesting a potential trend continuation. The "Hold Investment" state ends when the price exceeds the entry price or a sell signal occurs, resetting the counter.
Exit Rules: Traders can exit buy positions when a sell signal appears, the price exceeds the entry price during a "Hold Investment" state, or based on additional confirmation from BOS/CHoCH patterns or other technical analysis tools. Always use proper risk management.
Recommended Usage
The indicator is optimized for the daily timeframe, where it effectively captures significant reversal and continuation patterns in trending or ranging markets. It can be adapted to other timeframes (e.g., 1H, 4H, 15M) with careful testing of settings, particularly enabling/disabling short-term structure analysis to suit market conditions. Backtesting is recommended to optimize performance for your chosen asset and timeframe.
Customization Options Market Structure Display: Toggle short-term, intermediate-term, and long-term structures on or off, with customizable line styles (solid, dashed, dotted) and colors for bullish and bearish breaks.
Labels: Enable or disable BOS/CHoCH labels for each timeframe to reduce chart clutter.
Signal Visibility: Hide buy/sell signals if desired for a cleaner chart.
Blue Dot Tracker: Monitor the blue dot count and action (Hold or Flip Investment) via the table display, which is fully customizable in terms of position and appearance.
Why Use This Indicator?
The "Contrarian Market Structure Break" indicator offers a robust framework for identifying high-probability reversal and continuation setups using ICT principles. Its multi-timeframe analysis, clear signal visualization, and innovative Blue Dot Tracker provide traders with actionable insights into market dynamics. Whether you're a swing trader or a day trader, this indicator’s flexibility and intuitive design make it a valuable addition to your trading arsenal.
Note for TradingView Moderators
This script complies with TradingView's House Rules by providing an educational and transparent description without performance claims or guarantees. It is designed to assist traders in technical analysis and should be used alongside proper risk management and personal research. The code is original, well-documented, and includes customizable inputs and clear visual outputs to enhance the user experience.
Tips for Users:
Backtest thoroughly on your chosen asset and timeframe to validate signal reliability. Combine with other indicators or price action analysis for confirmation of entries and exits. Adjust timeframe settings and enable/disable short-term structures to match market volatility and your trading style.
Hope the "Contrarian Market Structure Break" indicator enhances your trading strategy and helps you navigate the markets with confidence! Happy trading!

Contrarian with 5 Levels5 Levels application was inspired and adapted from Predictive Ranges indicator developed by Lux Algo. So much credit to their work.
Indicator Description: Contrarian with 5 Levels
Overview
The "Contrarian with 5 Levels" indicator is a powerful tool designed for traders seeking to identify potential reversal points in the market by combining contrarian trading principles with dynamic support and resistance levels. This indicator overlays a Simple Moving Average (SMA) shadow and five adaptive price levels, integrating Institutional Concepts of Structure (ICT) such as Break of Structure (BOS) and Market Structure Shift (MSS) to provide clear buy and sell signals. It is ideal for traders looking to capitalize on overextended price movements, particularly on the daily timeframe, though it is adaptable to other timeframes with proper testing.
How It Works
The indicator operates on two core components:
Contrarian SMA Shadow: A shaded region between the SMA of highs and lows (default length: 100) acts as a dynamic zone to identify overbought or oversold conditions. When the price moves significantly outside this shadow, it signals potential exhaustion, aligning with contrarian trading principles.
Five Adaptive Levels: Using a modified ATR-based calculation, the indicator plots five key levels (two resistance, one average, and two support) that adjust dynamically to market volatility. These levels serve as critical zones for potential reversals.
ICT Structure Analysis: The indicator incorporates BOS and MSS logic to detect shifts in market structure, plotting bullish and bearish breaks with customizable colors for clarity.
Buy and sell signals are generated when the price crosses key levels while outside the SMA shadow, indicating potential reversal opportunities. The signals are visualized as small circles above (sell) or below (buy) the price bars, making them easy to interpret.
Mathematical Concepts
SMA Shadow: The indicator calculates the SMA of the highest highs and lowest lows over a user-defined period (default: 100). This creates a dynamic range that highlights extreme price movements, which contrarian traders often target for reversals.
Five Levels Calculation: The five levels are derived using a volatility-adjusted formula based on the Average True Range (ATR). The average level (central pivot) is calculated as a smoothed price, with two upper (resistance) and two lower (support) levels offset by a multiple of the ATR (default multiplier: 6.0). This adaptive approach ensures the levels remain relevant across varying market conditions.
ICT BOS/MSS Logic: The indicator identifies pivot highs and lows on a user-defined timeframe (default: daily) to detect structural breaks. A BOS occurs when the price breaks a prior pivot high (bullish) or low (bearish), while an MSS signals a shift in market direction, providing context for potential reversals.
Entry and Exit Rules
Buy Signal (Blue Dot Below Bar): Triggered when the closing price is below both the SMA shadow (smaLow) and the average level (avg), and the price crosses under either the first or second support level (prS1 or prS2). This suggests the market may be oversold, indicating a potential reversal upward.
Sell Signal (White Dot Above Bar): Triggered when the closing price is above both the SMA shadow (smaHigh) and the average level (avg), and the price crosses over either the first or second resistance level (prR1 or prR2). This suggests the market may be overbought, indicating a potential reversal downward.
Recommended Usage
This indicator is optimized for the daily timeframe, where it has been designed to capture significant reversal opportunities in trending or ranging markets. However, it can be adapted to other timeframes (e.g., 1H, 4H, 15M) with proper testing of settings such as SMA length, ATR multiplier, and structure timeframe. Users are encouraged to backtest and optimize parameters to suit their trading style and asset class.
Customization Options
SMA Length: Adjust the SMA period (default: 100) to control the sensitivity of the shadow.
Five Levels Length and Multiplier: Modify the length (default: 200) and ATR multiplier (default: 6.0) to fine-tune the support/resistance levels.
Timeframe Settings: Set separate timeframes for structure analysis and five levels to align with your trading strategy.
Color and Signal Display: Customize colors for BOS/MSS lines and toggle buy/sell signals on or off for a cleaner chart.
Why Use This Indicator?
The "Contrarian with 5 Levels" indicator combines the power of contrarian trading with dynamic levels and market structure analysis, offering a unique perspective for identifying high-probability reversal setups. Its intuitive design, customizable settings, and clear signal visualization make it suitable for both novice and experienced traders. Whether you're trading forex, stocks, or cryptocurrencies, this indicator provides a robust framework for spotting potential turning points in the market.
We hope you find the "Contrarian with 5 Levels" indicator a valuable addition to your trading toolkit! Happy trading!
Please leave feedback in the comments section.

Market Structure Confluence [AlgoAlpha]OVERVIEW
This script is called "Market Structure Confluence" and it combines classic market structure analysis with a dynamic volatility-based band system to detect shifts in trend and momentum more reliably. It tracks key swing points (higher highs, higher lows, lower highs, lower lows) to define the trend, then overlays a basis and ATR-smoothed volatility bands to catch rejection signals and highlight potential inflection points in the market.
CONCEPTS
Market structure is the foundation of price action trading, focusing on the relationship between successive highs and lows to understand trend conditions. Break of Structure (BOS) and Change of Character (CHoCH) events are important because they signal when a market might be shifting direction. This script enhances traditional structure by integrating volatility bands, which act like dynamic support/resistance zones based on ATR, allowing it to capture momentum surges and rejections beyond just structural shifts.
FEATURES
Swing Detection: It detects and labels Higher Highs (HH), Higher Lows (HL), Lower Highs (LH), and Lower Lows (LL) based on user-defined time horizons, helping traders quickly spot the trend direction.
BOS and CHoCH Lines: When a previous swing point is broken, the script automatically plots a Break of Structure (BOS) line. If the break represents a major trend reversal (a CHoCH), it is marked differently to separate simple breakouts from real trend changes.
Rejection Signals: Special arrows plot when price pierces a band and then pulls back, suggesting a potential trap move or rejection signal in the direction of the new structure.
Alerts: Built-in alerts for structure breaks, CHoCHs, swing points, rejections at bands, and trend flips make it easy to automate setups without manually watching the chart.
USAGE
Set your preferred swing detection size depending on your timeframe and trading style — smaller numbers for intraday, larger numbers for swing trading. Choose whether you want BOS/CHoCH confirmed by candle closes or by wick breaks. Use the volatility band settings to fine-tune how tightly or loosely the bands hug the price, adjusting sensitivity based on market conditions. When a BOS or CHoCH occurs, or when a rejection happens at the bands, the script will highlight it clearly and optionally trigger alerts. Watch for combinations where both structure breaks and volatility band rejections happen together — those are high-quality trade signals. This setup works best when used with basic trend filtering and higher timeframe confirmation.

PRO SMC Full Suite BY Mashrur“PRO SMC Full Suite BY Mashrur”
A Pine Script (v5) indicator for TradingView, focused on Smart Money Concepts (SMC). It overlays on price charts and provides visual tools for identifying key institutional trading behaviors.
🎯 Purpose
This script is designed to help traders analyze and trade using SMC principles by automatically detecting:
Order Blocks (OBs)
Fair Value Gaps (FVGs)
Breaks of Structure (BoS)
Liquidity Sweeps (Buy/Sell Side Liquidity Grabs)
Mitigation Entries
⚙️ Inputs / Settings
Show Fair Value Gaps: Toggle FVGs on/off
Higher Timeframe (HTF): Choose HTF for OB analysis
Use HTF OBs: Switch between current TF OBs and HTF OBs
Show Order Blocks: Toggle OBs on/off
Show OB Mitigation Entries: Toggle mitigation entry signals on/off
🧠 Core Logic Overview
🔹 1. Swing Points Detection
Identifies swing highs/lows using a 3-bar pattern (pivot-based structure).
🔹 2. Break of Structure (BoS)
A bullish BoS happens when price closes above the last swing high.
A bearish BoS occurs when price closes below the last swing low.
🔹 3. Order Block Detection
Upon BoS, the script marks the previous candle as the Order Block.
Uses either:
Current TF OBs (based on price action)
HTF OBs (based on candle body direction)
🔹 4. Mitigation Entry Logic
A mitigation occurs when price returns to the OB and reacts with confirmation:
Bullish: price dips into OB and closes above
Bearish: price wicks into OB and closes below
Plots entry markers for these mitigations.
🔹 5. Liquidity Sweeps
Detects equal highs/lows (liquidity zones)
Marks Buy SL when price dips below an equal low then closes above
Marks Sell SL when price breaks above an equal high then closes below
🔹 6. Fair Value Gaps (FVGs)
FVG Up: Gap between candle 3 and candle 1 (low > high )
FVG Down: Gap between candle 3 and candle 1 (high < low )
Plots highlighted boxes on these gaps
📊 Visual Elements
Boxes: For OB zones and FVGs
Shapes:
Labels: OB Buy/Sell entries
Triangles: Buy SL / Sell SL liquidity sweeps
Lines: Equal Highs and Lows
🔔 Alerts
Built-in alerts to notify when:
OB entries are confirmed
Liquidity sweeps happen
Helps in automation or active monitoring
✅ Ideal For
Traders using SMC, ICT concepts, Wyckoff, or institutional trading models
Anyone wanting to automate detection of structural elements on their chart

Cryptoin Awesome Indicator - Market StructureCryptoin Awesome Indicator - Market Structure (CAI-MS) 🌟
The Cryptoin Awesome Indicator - Market Structure (CAI-MS) is an advanced, proprietary overlay tool designed to decode market structure and price action dynamics with precision. Unlike traditional indicators that rely on lagging oscillators or moving averages, CAI-MS focuses on real-time swing point analysis and structural breakouts, offering traders a clear, actionable framework for identifying trend shifts, continuations, and key decision zones in forex, stocks, or crypto markets. 📊
What It Does: 📝
CAI-MS maps the market’s structural evolution by detecting and classifying swing points—Higher Highs (HH), Lower Highs (LH), Higher Lows (HL), and Lower Lows (LL)—based on a customizable lookback period. It then tracks price interactions with these levels to signal two critical events:
✅ Break of Structure (BOS): When price breaches a prior swing high or low, indicating potential trend continuation. 🚀
✅ Change of Character (CHoCH): When price invalidates the most recent swing in the opposite direction, suggesting a possible reversal. 🔄
Additionally, it plots fixed-length liquidity zones (BSL/SSL) derived from unbroken swing levels, helping traders anticipate support/resistance or stop-loss hunting areas. 🛡️
How It Works: ⚙️
The indicator uses a unique swing detection algorithm that analyzes price extremes over a user-defined number of bars (Swing Length). This avoids the noise of smaller fluctuations and focuses on significant pivots. Once a swing point is confirmed:
✅ It labels the pivot (e.g., HH, LH) to reflect the current structure. 🏷️
✅ If price breaks a prior high or low, a BOS line is drawn to mark the breakout, visually connecting the breached level to the breakout candle. 📏
✅ If the breakout reverses the prior trend (e.g., breaking a LH in a downtrend), it flags a CHoCH, alerting traders to a potential shift. ⚠️
✅ Unbroken swing levels extend as BSL/SSL lines for a fixed duration, offering strategic reference points. 🎯
This methodology combines structural analysis with breakout confirmation, distilled into a clean, overlay format that doesn’t clutter charts with redundant data.
Key Features: ✨
✅ Swing Point Detection: Identifies and labels HH, LH, HL, and LL with adjustable sensitivity, ensuring relevance across timeframes. 🔍
✅ BOS & CHoCH Visualization: Plots breakout lines and labels to highlight trend momentum or reversal setups. 📈
✅ Liquidity Zones (BSL/SSL): Extends prior swing levels as potential support/resistance, with customizable length and style. 🧱
✅ Customization: Toggle labels on/off, adjust line colors, styles (solid, dashed, dotted), and thickness to match your workflow. 🎨
✅ Original Approach: Unlike public tools relying on MAs or RSI, CAI-MS uses a proprietary pivot-based system tailored for structure traders. 🦄
Why It’s Valuable: 💎
This isn’t a mashup of classic indicators—it’s a purpose-built solution for market structure enthusiasts. Public scripts often flood charts with generic signals; CAI-MS delivers focused, context-aware insights by synthesizing swing analysis, breakout detection, and liquidity projection into one cohesive tool. Its closed-source design protects a unique algorithm that adapts to price action without overfitting or repackaging common techniques.
How to Use It: 🛠️
✅ Trend Continuation: Enter long after a BOS above a prior HH, or short below a prior LL, using BSL/SSL as take-profit zones. 📈
✅ Reversal Trades: Watch for CHoCH signals (e.g., price breaking a LH in a downtrend) to anticipate shifts, with BSL/SSL as stop-loss guides. 🔄
✅ Scalping/Swing Trading: Adjust Swing Length (e.g., 10 for scalping, 50 for swings) to match your timeframe. ⏱️
Pair it with a clean chart (no other indicators needed) to maximize clarity—add drawings like trendlines if desired, but the indicator stands alone.
Customization Options: 🖌️
✅ Swing Length: Increase (e.g., 50) for fewer, stronger pivots; decrease (e.g., 10) for more frequent signals. ⚖️
✅ Visuals: Enable/disable swing labels, tweak BOS line styles, or adjust BSL/SSL length (default: 50 bars). 🎚️

QuantBuilder | FractalystWhat's the strategy's purpose and functionality?
QuantBuilder is designed for both traders and investors who want to utilize mathematical techniques to develop profitable strategies through backtesting on historical data.
The primary goal is to develop profitable quantitive strategies that not only outperform the underlying asset in terms of returns but also minimize drawdown.
For instance, consider Bitcoin (BTC), which has experienced significant volatility, averaging an estimated 200% annual return over the past decade, with maximum drawdowns exceeding -80%. By employing this strategy with diverse entry and exit techniques, users can potentially seek to enhance their Compound Annual Growth Rate (CAGR) while managing risk to maintain a lower maximum drawdown.
While this strategy employs quantitative techniques, including mathematical methods such as probabilities and positive expected values, it demonstrates exceptional efficacy across all markets. It particularly excels in futures, indices, stocks, cryptocurrencies, and commodities, leveraging their inherent trending behaviors for optimized performance.
In both trending and consolidating market conditions, QuantBuilder employs a combination of multi-timeframe probabilities, expected values, directional biases, moving averages and diverse entry models to identify and capitalize on bullish market movements.
How does the strategy perform for both investors and traders?
The strategy has two main modes, tailored for different market participants: Traders and Investors.
1. Trading:
- Designed for traders looking to capitalize on bullish markets.
- Utilizes a percentage risk per trade to manage risk and optimize returns.
- Suitable for both swing and intraday trading with a focus on probabilities and risk per trade approach.
2. Investing:
- Geared towards investors who aim to capitalize on bullish trending markets without using leverage while mitigating the asset's maximum drawdown.
- Utilizes pre-define percentage of the equity to buy, hold, and manage the asset.
- Focuses on long-term growth and capital appreciation by fully/partially investing in the asset during bullish conditions.
How does the strategy identify market structure? What are the underlying calculations?
The strategy utilizes an efficient logic with for loops to pinpoint the first swing candle featuring a pivot of 2, establishing the point at which the break of structure begins.
What entry criteria are used in this script? What are the underlying calculations?
The script utilizes two entry models: BreakOut and fractal.
Underlying Calculations:
Breakout: The script assigns the most recent swing high to a variable. When the price closes above this level and all other conditions are met, the script executes a breakout entry (conservative approach).
Fractal: The script identifies a swing low with a period of 2. Once this condition is met, the script executes the trade (aggressive approach).
How does the script calculate probabilities? What are the underlying calculations?
The script calculates probabilities by monitoring price interactions with liquidity levels. Here’s how the underlying calculations work:
Tracking Price Hits: The script counts the number of times the price taps into each liquidity side after the EQM level is activated. This data is stored in an array for further analysis.
Sample Size Consideration: The total number of price interactions serves as the sample size for calculating probabilities.
Probability Calculation: For each liquidity side, the script calculates the probability by taking the average of the recorded hits. This allows for a dynamic assessment of the likelihood that a particular side will be hit next, based on historical performance.
Dynamic Adjustment: As new price data comes in, the probabilities are recalculated, providing real-time aduptive insights into market behavior.
Note: The calculations are performed independently for each directional range. A range is considered bearish if the previous breakout was through a sellside liquidity. Conversely, a range is considered bullish if the most recent breakout was through a buyside liquidity.
How does the script calculate expected values? What are the underlying calculations?
The script calculates expected values by leveraging the probabilities of winning and losing trades, along with their respective returns. The process involves the following steps:
This quantitative methodology provides a robust framework for assessing the expected performance of trading strategies based on historical data and backtesting results.
How is the contextual bias calculated? What are the underlying calculations?
The contextual bias in the QuantBuilder script is calculated through a structured approach that assesses market structure based on swing highs and lows. Here’s how it works:
Identification of Swing Points: The script identifies significant swing points using a defined pivot logic, focusing on the first swing high and swing low. This helps establish critical levels for determining market structure.
Break of Structure (BOS) Assessment:
Bullish BOS: The script recognizes a bullish break of structure when a candle closes above the first swing high, followed by at least one swing low.
Bearish BOS: Conversely, a bearish break of structure is identified when a candle closes below the first swing low, followed by at least one swing high.
Bias Assignment: Based on the identified break of structure, the script assigns directional biases:
A bullish bias is assigned if a bullish BOS is confirmed.
A bearish bias is assigned if a bearish BOS is confirmed.
Quantitative Evaluation: Each identified bias is quantitatively evaluated, allowing the script to assign numerical values representing the strength of each bias. This quantification aids in assessing the reliability of market sentiment across multiple timeframes.
What's the purpose of using moving averages in this strategy? What are the underlying calculations?
Using moving averages is a widely-used technique to trade with the trend.
The main purpose of using moving averages in this strategy is to filter out bearish price action and to only take trades when the price is trading ABOVE specified moving averages.
The script uses different types of moving averages with user-adjustable timeframes and periods/lengths, allowing traders to try out different variations to maximize strategy performance and minimize drawdowns.
By applying these calculations, the strategy effectively identifies bullish trends and avoids market conditions that are not conducive to profitable trades.
The MA filter allows traders to choose whether they want a specific moving average above or below another one as their entry condition.
What type of stop-loss identification method are used in this strategy? What are the underlying calculations?
- Initial Stop-loss:
1. ATR Based:
The Average True Range (ATR) is a method used in technical analysis to measure volatility. It is not used to indicate the direction of price but to measure volatility, especially volatility caused by price gaps or limit moves.
Calculation:
- To calculate the ATR, the True Range (TR) first needs to be identified. The TR takes into account the most current period high/low range as well as the previous period close.
The True Range is the largest of the following:
- Current Period High minus Current Period Low
- Absolute Value of Current Period High minus Previous Period Close
- Absolute Value of Current Period Low minus Previous Period Close
- The ATR is then calculated as the moving average of the TR over a specified period. (The default period is 14)
2. ADR Based:
The Average Day Range (ADR) is an indicator that measures the volatility of an asset by showing the average movement of the price between the high and the low over the last several days.
Calculation:
- To calculate the ADR for a particular day:
- Calculate the average of the high prices over a specified number of days.
- Calculate the average of the low prices over the same number of days.
- Find the difference between these average values.
- The default period for calculating the ADR is 14 days. A shorter period may introduce more noise, while a longer period may be slower to react to new market movements.
3. PL Based:
This method places the stop-loss at the low of the previous candle.
If the current entry is based on the hunt entry strategy, the stop-loss will be placed at the low of the candle that wicks through the lower FRMA band.
Example:
If the previous candle's low is 100, then the stop-loss will be set at 100.
This method ensures the stop-loss is placed just below the most recent significant low, providing a logical and immediate level for risk management.
- Trailing Stop-Loss:
One of the key elements of this strategy is its ability to detect structural liquidity and structural invalidation levels across multiple timeframes to trail the stop-loss once the trade is in running profits.
By utilizing this approach, the strategy allows enough room for price to run.
By using these methods, the strategy dynamically adjusts the initial stop-loss based on market volatility, helping to protect against adverse price movements while allowing for enough room for trades to develop.
Each market behaves differently across various timeframes, and it is essential to test different parameters and optimizations to find out which trailing stop-loss method gives you the desired results and performance.
What type of break-even and take profit identification methods are used in this strategy? What are the underlying calculations?
For Break-Even:
Percentage (%) Based:
Moves the initial stop-loss to the entry price when the price reaches a certain percentage above the entry.
Calculation:
Break-even level = Entry Price * (1 + Percentage / 100)
Example:
If the entry price is $100 and the break-even percentage is 5%, the break-even level is $100 * 1.05 = $105.
Risk-to-Reward (RR) Based:
Moves the initial stop-loss to the entry price when the price reaches a certain RR ratio.
Calculation:
Break-even level = Entry Price + (Initial Risk * RR Ratio)
For TP1 (Take Profit 1):
- You can choose to set a take profit level at which your position gets fully closed or 50% if the TP2 boolean is enabled.
- Similar to break-even, you can select either a percentage (%) or risk-to-reward (RR) based take profit level, allowing you to set your TP1 level as a percentage amount above the entry price or based on RR.
For TP2 (Take Profit 2):
- You can choose to set a take profit level at which your position gets fully closed.
- As with break-even and TP1, you can select either a percentage (%) or risk-to-reward (RR) based take profit level, allowing you to set your TP2 level as a percentage amount above the entry price or based on RR.
What's the day filter Filter, what does it do?
The day filter allows users to customize the session time and choose the specific days they want to include in the strategy session. This helps traders tailor their strategies to particular trading sessions or days of the week when they believe the market conditions are more favorable for their trading style.
Customize Session Time:
Users can define the start and end times for the trading session.
This allows the strategy to only consider trades within the specified time window, focusing on periods of higher market activity or preferred trading hours.
Select Days:
Users can select which days of the week to include in the strategy.
This feature is useful for excluding days with historically lower volatility or unfavorable trading conditions (e.g., Mondays or Fridays).
Benefits:
Focus on Optimal Trading Periods:
By customizing session times and days, traders can focus on periods when the market is more likely to present profitable opportunities.
Avoid Unfavorable Conditions:
Excluding specific days or times can help avoid trading during periods of low liquidity or high unpredictability, such as major news events or holidays.
What tables are available in this script?
- Summary: Provides a general overview, displaying key performance parameters such as Net Profit, Profit Factor, Max Drawdown, Average Trade, Closed Trades and more.
Total Commission: Displays the cumulative commissions incurred from all trades executed within the selected backtesting window. This value is derived by summing the commission fees for each trade on your chart.
Average Commission: Represents the average commission per trade, calculated by dividing the Total Commission by the total number of closed trades. This metric is crucial for assessing the impact of trading costs on overall profitability.
Avg Trade: The sum of money gained or lost by the average trade generated by a strategy. Calculated by dividing the Net Profit by the overall number of closed trades. An important value since it must be large enough to cover the commission and slippage costs of trading the strategy and still bring a profit.
MaxDD: Displays the largest drawdown of losses, i.e., the maximum possible loss that the strategy could have incurred among all of the trades it has made. This value is calculated separately for every bar that the strategy spends with an open position.
Profit Factor: The amount of money a trading strategy made for every unit of money it lost (in the selected currency). This value is calculated by dividing gross profits by gross losses.
Avg RR: This is calculated by dividing the average winning trade by the average losing trade. This field is not a very meaningful value by itself because it does not take into account the ratio of the number of winning vs losing trades, and strategies can have different approaches to profitability. A strategy may trade at every possibility in order to capture many small profits, yet have an average losing trade greater than the average winning trade. The higher this value is, the better, but it should be considered together with the percentage of winning trades and the net profit.
Winrate: The percentage of winning trades generated by a strategy. Calculated by dividing the number of winning trades by the total number of closed trades generated by a strategy. Percent profitable is not a very reliable measure by itself. A strategy could have many small winning trades, making the percent profitable high with a small average winning trade, or a few big winning trades accounting for a low percent profitable and a big average winning trade. Most mean-reversion successful strategies have a percent profitability of 40-80% but are profitable due to risk management control.
BE Trades: Number of break-even trades, excluding commission/slippage.
Losing Trades: The total number of losing trades generated by the strategy.
Winning Trades: The total number of winning trades generated by the strategy.
Total Trades: Total number of taken traders visible your charts.
Net Profit: The overall profit or loss (in the selected currency) achieved by the trading strategy in the test period. The value is the sum of all values from the Profit column (on the List of Trades tab), taking into account the sign.
- Monthly: Displays performance data on a month-by-month basis, allowing users to analyze performance trends over each month and year.
- Weekly: Displays performance data on a week-by-week basis, helping users to understand weekly performance variations.
- UI Table: A user-friendly table that allows users to view and save the selected strategy parameters from user inputs. This table enables easy access to key settings and configurations, providing a straightforward solution for saving strategy parameters by simply taking a screenshot with Alt + S or ⌥ + S.
User-input styles and customizations:
To facilitate studying historical data, all conditions and filters can be applied to your charts. By plotting background colors on your charts, you'll be able to identify what worked and what didn't in certain market conditions.
Please note that all background colors in the style are disabled by default to enhance visualization.
How to Use This Quantitive Strategy Builder to Create a Profitable Edge and System?
Choose Your Strategy mode:
- Decide whether you are creating an investing strategy or a trading strategy.
Select a Market:
- Choose a one-sided market such as stocks, indices, or cryptocurrencies.
Historical Data:
- Ensure the historical data covers at least 10 years of price action for robust backtesting.
Timeframe Selection:
- Choose the timeframe you are comfortable trading with. It is strongly recommended to use a timeframe above 15 minutes to minimize the impact of commissions/slippage on your profits.
Set Commission and Slippage:
- Properly set the commission and slippage in the strategy properties according to your broker/prop firm specifications.
Parameter Optimization:
- Use trial and error to test different parameters until you find the performance results you are looking for in the summary table or, preferably, through deep backtesting using the strategy tester.
Trade Count:
- Ensure the number of trades is 200 or more; the higher, the better for statistical significance.
Positive Average Trade:
- Make sure the average trade is above zero.
(An important value since it must be large enough to cover the commission and slippage costs of trading the strategy and still bring a profit.)
Performance Metrics:
- Look for a high profit factor, and net profit with minimum drawdown.
- Ideally, aim for a drawdown under 20-30%, depending on your risk tolerance.
Refinement and Optimization:
- Try out different markets and timeframes.
- Continue working on refining your edge using the available filters and components to further optimize your strategy.
What makes this strategy original?
QuantBuilder stands out due to its unique combination of quantitative techniques and innovative algorithms that leverage historical data for real-time trading decisions. Unlike most algorithmic strategies that work based on predefined rules, this strategy adapts to real-time market probabilities and expected values, enhancing its reliability. Key features include:
Mathematical Framework: The strategy integrates advanced mathematical concepts, such as probabilities and expected values, to assess trade viability and optimize decision-making.
Multi-Timeframe Analysis: By utilizing multi-timeframe probabilities, QuantBuilder provides a comprehensive view of market conditions, enhancing the accuracy of entry and exit points.
Dynamic Market Structure Identification: The script employs a systematic approach to identify market structure changes, utilizing a blend of swing highs and lows to detect contextual/direction bias of the market.
Built-in Trailing Stop Loss: The strategy features a dynamic trailing stop loss based on multi-timeframe analysis of market structure. This allows traders to lock in profits while adapting to changing market conditions, ensuring that exits are executed at optimal levels without prematurely closing positions.
Robust Performance Metrics: With detailed performance tables and visualizations, users can easily evaluate strategy effectiveness and adjust parameters based on historical performance.
Adaptability: The strategy is designed to work across various markets and timeframes, making it versatile for different trading styles and objectives.
Suitability for Investors and Traders: QuantBuilder is ideal for both investors and traders looking to rely on mathematically proven data to create profitable strategies, ensuring that decisions are grounded in quantitative analysis.
These original elements combine to create a powerful tool that can help both traders and investors to build and refine profitable strategies based on algorithmic quantitative analysis.
Terms and Conditions | Disclaimer
Our charting tools are provided for informational and educational purposes only and should not be construed as financial, investment, or trading advice. They are not intended to forecast market movements or offer specific recommendations. Users should understand that past performance does not guarantee future results and should not base financial decisions solely on historical data.
Built-in components, features, and functionalities of our charting tools are the intellectual property of @Fractalyst Unauthorized use, reproduction, or distribution of these proprietary elements is prohibited.
By continuing to use our charting tools, the user acknowledges and accepts the Terms and Conditions outlined in this legal disclaimer and agrees to respect our intellectual property rights and comply with all applicable laws and regulations.

Vasyl Ivanov | FVG, imbalanceFair Value Gap (FVG) / Imbalance Indicator
This indicator is specifically designed to help traders detect Fair Value Gaps (FVG) and Imbalance in the market, highlighting key areas where price action may return to "fill the gap" or restore balance. Additionally, it detects strong FVG scenarios, where Break of Structure (BoS) intersects with an FVG, giving traders an extra level of insight.
Key Features:
Fair Value Gap (FVG) Detection:
The indicator identifies FVGs, which occur when the price leaves an unfilled gap between two bars. These gaps often act as key price targets for future market action, providing potential entry or exit points.
Imbalance Detection:
Imbalances occur when there is a discrepancy between buying and selling pressure, leaving price gaps that the market often seeks to fill. This feature highlights these imbalances on the chart.
Strong FVG Highlighting:
A Strong FVG is marked when there’s an intersection between a Break of Structure (BoS) and an FVG. This situation is highlighted with a distinct color, drawing attention to areas of higher importance where both a BoS and FVG are present, signaling potential significant price moves.
How It Works:
The FVG / Imbalance Indicator scans price action for gaps where price moves too quickly, leaving areas of imbalance:
Fair Value Gaps (FVG) are detected when price leaves a gap, signaling potential levels where the price may retrace.
Imbalance is identified when buying and selling pressure is uneven, leading to unfilled gaps in price action.
Strong FVG detection combines FVG with BoS, highlighting critical zones where price is likely to react significantly due to a structural shift and a gap in price action.
Use Cases:
Gap Trading: Use the FVG indicator to identify potential levels where the market may return to fill the gap, offering valuable entry and exit points.
Detecting Imbalance: Spot areas of price imbalance, which can act as magnets for price retracements.
Key Reversal Zones: Strong FVGs highlight potential reversal or continuation points where both a BoS and FVG intersect, making these zones crucial for high-probability trading opportunities.
Why It’s Unique:
This indicator goes beyond basic FVG and imbalance detection by introducing Strong FVGs, offering traders an advanced tool to identify crucial market zones where structural changes and gaps intersect. The distinct color for Strong FVGs ensures traders don’t miss these high-impact areas.
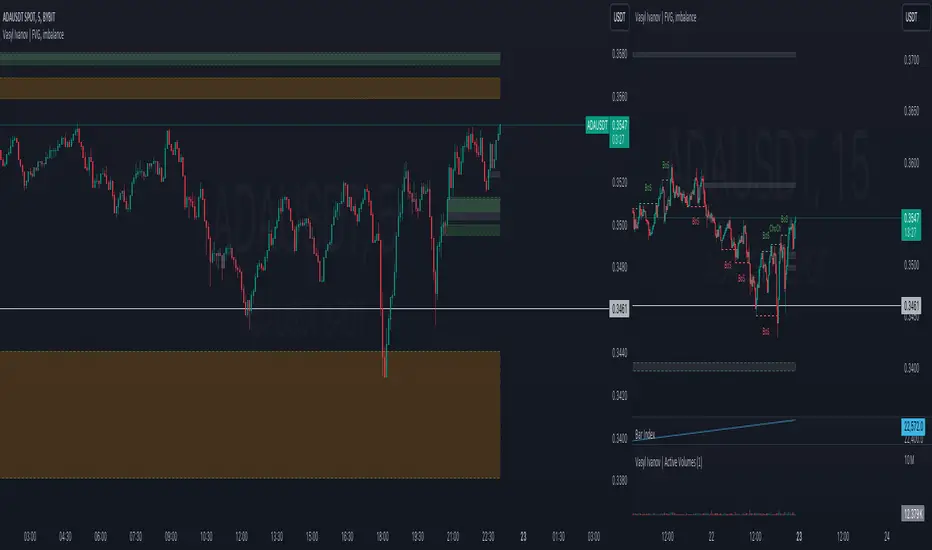
TradesAI - Elite (Premium)This is an all-inclusive, premium indicator that focuses mainly on price action analysis, a form of looking at raw price data and market structure to analyze and capture areas of interest where price could react.
This indicator is a perfect trading companion that saves you a lot of time in trading price action. Some of the popular methods that use price action analysis are "Smart Money Concepts (SMC)", "Inner Circle Trader (ICT)", and "Institutional Trading".
🔶 POWERFUL TOOLS
The indicator combines three main tools as a trading suite:
Trendlines
Market Structure Breakouts (MSB)
Order Blocks (OBs) and Reversal Order Blocks (ROBs)
These 3 main tools are interconnected together. Below we go over each, and then explain how and why they are brought in together. Please also note that the indicator's settings have tooltips next to most of them, with more detailed information.
🔶 TRENDLINES
This indicator automatically draws the most relevant Trendlines from pivot high/pivot low (based on the defined settings) as origins, while keeping track of candle closes across these Trendlines to adjust or invalidate accordingly.
The indicator will draw all possible Trendlines up to the maximum allowed by TradingView's PineScript. It uses a bullish pivot high candle to draw downtrends, and a bearish pivot low candle to draw uptrends. The algorithm will draw the most suitable active Trendlines from those origin points.
The indicator takes the origin point as the first point of the Trendline, then starts looking for the immediate next same-type candle (bullish to bullish or bearish to bearish), to draw the Trendline between the origin candle and this newer candle.
An uptrend is a ray connecting two bearish candles, as long as the second candle has a Low higher than the low of the origin (first) candle. A downtrend is a ray connecting two bullish candles, as long as the second candle has a high lower than the high of the origin (first) candle.
Upon drawing, the indicator then starts monitoring and adjusting this Trendline, by keeping the origin always the same but changing the second point. The goal is to keep reducing the slope of the Trendline till it is at 0 degrees (horizontal line). That then makes the Trendline "final". Note that you have the option to keep all Trendlines or just show the final, in the settings.
So, the algorithm has three states for the Trendlines:
Initial: not tested, meaning price hasn't yet broken through it and closed a candle beyond it, to cause a re-adjustment of this Trendline.
Broken: a candle hard closed (opened and closed) across it but still, the direction of the trend is maintained with a new Trendline from the same origin – could be replaced (or kept on the chart as a "backside", which is what we call a broken Trendline to be tested from the opposite side) with a new Trendline from the same origin, to the newest candle that caused the break to happen, as then it becomes the new second point of that Trendline.
Final: a candle hard closed (opened and closed) across it and can't draw a new Trendline from the same origin maintaining the direction of the trend (so an uptrend becomes a downtrend or a downtrend becomes an uptrend at this point, which is not allowed). This marks the end of the Trendline adjustment for that origin.
To summarize the Trendlines algorithm, imagine starting from a candle and drawing the Trendline, then keep re-adjusting it to make its slope less and less, till it becomes a horizontal line. That's the final state.
Here is a step-by-step scenario to demonstrate the algorithm:
Notice how first an Uptrend (green ray) is drawn between point A origin pivot (picked by our smart algorithm) and point B, both marked by green arrows:
Uptrend then turned into backside (where it flips from diagonal support to resistance where liquidity potentially resides):
Then a new uptrend is drawn from the same point A origin pivot to a new point B matching the filters in settings.
Finally, it turns also into a backside and is considered final because no more uptrends could be drawn from the same point A origin point.
Unlike traditional Trendline tools, this indicator takes into account numerous rules for each candlestick to determine valid support and resistance levels, which act as liquidity zones.
Unlike conventional Trendline tools, this indicator allows the user to define the pivot point left and right length to capture the proper ones as origins, then automatically recognizes and extends lines from them as liquidity zones where a reaction is expected. Moreover, the indicator monitors those Trendlines in real-time to switch them from buying to selling zones, and vice-versa, as the price structure changes.
Features
Log vs. Linear scale switch to show different Trendlines accordingly. When updating the Trendlines, or deciding whether Touches/Hard Closes are met, it makes a difference.
Ability to show all forms of Trendlines, final Trendlines or just backside Trendlines.
Why is it used?
For experienced traders, it offers the advantage of time efficiency, while new traders can bypass the steep learning curve of drawing Trendlines manually, which could practically be drawn between any two candlesticks on the chart (many variations).
🔶 MARKET STRUCTURE BREAKOUT (MSB)
The Market Structure Breakouts (MSB) tool is a trading tool that detects specific patterns on trading charts and provides ‘take profit’ regions based on the extended direction of the identified pattern. A breakout is a potential trading opportunity that presents itself when an asset's price moves away from a zone of accumulation (i.e. above a resistance level or below a support level) on increasing volume. The most famous form of market structure breakout is double/triple tops/bottoms, or what is referred to as W or M breakouts.
See this example below of how our MSB smart algorithm picked the local bottom of INDEX:BTCUSD
Here is a step-by-step scenario to demonstrate the algorithm:
First, the algorithm picks the pivot points according to our Machine Learning (ML) model, which uses Average True Range (ATR) and Moving Averages of various types to decide. It will then signal a Market Structure Breakout (MSB):
You may either short (sell) this MSB towards the targets (dotted green lines) and/or buy (long) at the targets (dotted green lines). Usually, these targets provide scalp moves, according to our model, but they may also act as strong reversal points on the chart.
Unlike standard indicators, the MSB tool identifies patterns that may not appear in every time frame due to specific conditions that need to be met, including Average True Range (ATR) and Moving Averages at the time of creation. Once these patterns are identified, the tool gives ‘take profit’ regions in the direction of the trading pattern and even allows for trading in the opposite direction (contrarian/counter-trend scalps) once those regions are reached. A confirmed breakout has the potential to drive the price to these specific targets, calculated based on our Machine Learning (ML) model. The Targets are the measured moves placed from the breakout point.
Features
Log vs. Linear scale switch to show different MSBs accordingly based on the ratios.
Detects trading patterns with specific conditions.
Ability to specify how sensitive the pivot points are for capturing market structure breakouts.
Provides take profit regions in the extended direction of the pattern.
Allows for versatile trading styles by permitting trades in the opposite direction (contrarian or counter-trend) once the take profit region is reached.
Highlights 2 levels of interest for potential trade initiation (or as targets of the MSB move).
🔶 ORDER BLOCK (OB) and REVERSAL ORDER BLOCK (ROB)
Before diving deeper into OBs and ROBs, you may consider the following chart for a general understanding of price ladders, and how they break. This is a bearish price ladder leaving Lower Lows and Lower Highs after an initial Low and High (L->H->LL->LH). Bullish ladders are the opposite (H->L->HH->HL).
In this bearish ladder case, notice the numbers representing the highs made (being lower). While this is a clean structure, markets don't always create such clean ladders, but you may switch to a higher timeframe to see it in a clearer form (usually, you will be able to spot it there).
In SMC or ICT concepts, the "Break Of Structure (BOS)" is pretty much creating a new lower low (LL) for the bearish ladder (and the creation of a higher high (HH) for the bullish ladder). By doing so, markets are grabbing liquidity below these levels and could either continue the ladder or stop/flip it. This gives you the context of how the ladder prints.
Price usually ends the ladder with a "Change of Character (CHoCH)", which represents a BOS (to grab liquidity) followed by an aggressive move in the opposite direction, which could lead the market to close the gaps and balance out. It is considered a good practice to then target liquidity in the opposite direction when a CHoCH happens, meaning for a bearish ladder you may target the pivots marked by 3, 2 and 1 at the top (start of the ladder).
Now we move to Order Blocks (OBs) and Reversal Order Blocks (ROBs). Think of them as sniper zones or micro ladders inside the bigger ladder/structure.
Order Blocks are usually used as zones of support and resistance on a trading chart where liquidity is present, or what some traders call "potential institutional interest zones". Order Blocks can be observed at the beginning of these strong moves of BOS or the CHoCH, leaving behind a zone (one or more candles) to be revisited later to balance the market. Therefore, these are interesting levels to place Limit/Market orders (sell the peaks or buy the valleys) instead of doing so at the swing highs or swing lows of the ladder (where BOS or CHoCH happened). The idea here is that the price could go deep into the ladder's step (peak or valley), and by doing so, it usually goes to these zones.
A bullish Order Block (Valley-OB) is the last bearish candle of a downtrend before a sequence of bullish candles (thus forming a "Valley"). A bearish Order Block (Peak-OB) is the last bullish candle of an uptrend before a sequence of bearish candles (thus forming a "Peak"). Our indicator captures the full range zones of the OB meaning not only the last candle but the sequence of same-type candles immediately next to it, which creates a zone, thus the name "OB/ROB Zone". Not only does the tool mark those levels on the chart, but it also has a smart tracking algorithm to remove the appropriate levels dynamically. It will monitor, candle by candle, what is happening to all the OBs/ROBs, and update them according to how they are being tested/visited (eg. weak testing being a touch, and strong testing being a touch of the same colour candle).
Bullish Valley-OB:
Bearish Peak-OB:
The indicator follows our concept of "Zone Activation" to determine whether to mark zones with dashed or solid lines.
If we take a bearish Peak-OB as an example, notice how it first gets drawn with a dashed red line (as the algorithm monitors how far the price moved away from the zone):
As price moves away (distance based on our Machin Learning (ML) model), it turns into solid lines:
Some people prefer to enter market orders or limit (pending) orders close to the zone, while others wait for it to hit. You may wait for these zones to turn into solid lines (meaning that the price made a decent move away from it before revisiting it). It depends on your trading strategy.
When Order Block (OB) zones break instead of holding the ladder, they turn into what we call Reversal Order Blocks (ROB); our algorithm of flipping these zones where price could react from the other side of the OB. Our algorithm monitor and highlight the most suitable ones to trade, based on +30 conditions and variables by our Machine Learning (ML) models. Examples of ROBs in the SMC or ICT trading community are a "Breaker Block", a "Mitigation Block" or a "Unicorn Setup". However, our algorithm filters the zones based on many factors such as ratios of price movement before, inside and after these zones, along with many other factors.
The algorithm monitors the ratios of how price moved into and away from the OB/ROB, as well as the type of move happening, to then filter the ones that are considered of high probability to break/not do a reaction.
A bullish Valley-OB (green) turns into a bearish Valley-ROB (neon red) where you may short (sell), while a bearish Peak-OB (red) turns into a bullish Peak-ROB (neon green) where you may long (buy).
Example of a bullish Valley-OB that turned into a bearish Valley-ROB:
Features
Log vs. Linear scale switch to show OBs/ROBs accordingly based on the ratios and the price action around these zones (before and after creation).
Uses our Machine Learning (ML) model to determine relevant Order Blocks (OBs) to show or hide based on price action.
Considers distribution and accumulation candles to find relevant Order Blocks.
Various types of triggers to mark those Order Blocks and their zones: breakout, close, hard close (open and close) or full close (low, high, open and close).
Monitors the 1:1 expansion of price from key areas of interest, which would change the importance of the zones through our concept of “Zone Activation”.
Allows for customization in the settings to display different types of Order Blocks (e.g., tested or untested).
Marking and invalidating levels based on many variables, including single or multiple candle zones, touching/closing beyond specific levels, weak/strong testing criteria, price tolerance % (near a level), and many more.
Provides color-coded visual representation for easier interpretation.
Why is it used?
Order Blocks (OB) and Reversal Order Blocks (ROB) represent the building blocks of price ladders, in conjunction with Swing Highs and Swing Lows. By identifying where liquidity is potentially present, they become common targets for big market players. Additionally, they provide clear invalidation points based on various types of candle closes, such as hard closes or simply a candle close.
One strategy that could be used is to open positions at these OB or ROB Levels as long as the chart maintains the trend (ladder), for a potentially higher win rate (or against it for a quick scalp). Be mindful of the breaking of a ladder or the building of a new one. A ladder breaks with a hard close (open and close) of a candle across the closest two levels; a ladder builds by not breaking back down across the levels it has tested. By definition, strong ladders will have a few untested levels and come back to wick them but still retain the structure of the laddering direction (trending with Lower Lows + Lower Highs or Higher Lows + Higher Highs).
🔶 COMBINING ALL TOOLS
In summary, Trendlines could be great tools to give you a general context of whether the price is laddering up or down. Once you spot the ladder, your goal is to either trade in its direction (not to go against the trend) or to counter-trend trade (contrarian). To do so, you could use the MSB tool to spot these BOS/CHoCH. And to give you more precise entries, you may rely on the OB/ROB zones which usually mesh over the ladder, to provide a sniper entry!
🔶 RISK DISCLAIMER
Trading is risky, and most day traders lose money. The risk of loss in trading can be substantial. Decisions to buy, sell, hold or trade in securities, commodities and other investments involve risk and are best made based on the advice of qualified financial professionals. Past performance does not guarantee future results. All content is to be considered hypothetical, selected after the fact, in order to demonstrate our product and should not be construed as financial advice. You should therefore carefully consider whether such trading is suitable for you in light of your financial condition.

Market Structure [Truth Indie]Market Structure
Market structure is a crucial component of various trading methodologies. If you can accurately map the market structure, tailored to the volatility or assets you are trading, it helps you identify trends clearly and enhances the accuracy of your trading strategies.
This indicator facilitates easy and swift mapping of market structure for traders. The market structure in this indicator consists of 3 types:
1.Fractal structure
2.Internal structure
3.External structure
FRACTAL STRUCTURE MAPPING
-Wick breaks are sufficient for a Fractal break of structure.
-The precise moment when the price breaks a Fractal high or low confirms the break.
BULLISH & BEARISH FRACTAL STRUCTURE
Bullish Fractal Structure:
-A Fractal high is validated when the subsequent candle fails to surpass its high (fractal pullback).
-A Fractal higher low is validated once the price breaches the Fractal high (always identify the NEAREST Fractal low). This will be the most recent candle that was unable to exceed the high of the previous candle.
Bearish Fractal Structure:
-A Fractal low is validated when the following candle fails to break its low (fractal pullback).
-A Fractal lower high is validated once the price breaks the Fractal low (always identify the NEAREST Fractal high). This will be the most recent candle that was unable to surpass the low of the previous candle.
Settings
-Show or hide text and lines, including adjusting the color of text and lines.
-Adjust the size of text, and change the type of lines, including modifying text when there is a BoS and CHoCH.
-Mark swing when there is a valid pullback, adjust the size and color.
INTERNAL STRUCTURE MAPPING
Body breaks confirm an internal structure break.
BULLISH & BEARISH INTERNAL STRUCTURE
Bullish Internal Structure:
-An internal high is validated with 4 optional criteria.
-An internal higher low is validated when the internal high structure is broken. A higher low refers to the lowest price.
Bearish Internal Structure:
-An internal low is validated with 4 optional criteria.
-An internal lower high is validated when the internal high structure is broken. A lower high refers to the highest price.
Settings
-Show or hide text and lines, including adjusting the color of text and lines.
-Adjust the size of text, and change the type of lines, including modifying text when there is a BoS and CHoCH.
-Mark swing when there is a valid pullback, adjust the size and color.
Validation of pullback has 4 options for exploration, with the default value set to Fractal CHoCH 1 time:
1.Fractal CHoCH 1 time.
2.Fractal CHoCH and wait for Fractal BoS/Fractal CHoCH 3 times in a row.
3.PIP Rule, using PIP to determine the distance of a valid pullback.
-Show or hide lines and values. This option will only display results when you activate the PIP Rule. Change the style of lines and change the color of lines.
-In the PIP field, enter the PIP value you want to explore. In the 1 PIP Size field, enter the decimal places in the asset you are trading. For example, for the EUR/USD pair with decimals at position 4.
4.ATR Rule, utilizing ATR multiples to establish the range of a valid pullback.
-Show or hide lines and values. This option will only display results when you activate the ATR Rule. Change the style of lines and change the color of lines.
-ATR type allows you to choose from 5 ma types. ATR Period adjusts the backward-looking average value you want to explore. Multiple: Enter a multiplier value for ATR to match the volatility or asset you are trading.
If you choose only ATR Rule, the result is the validation of the pullback with ATR Rule only. If you choose more than 1 option, whichever condition is true, the validation pullback occurs immediately. If you don't choose anything, the default value is Internal CHoCH 1 time.
Swing internal structure
-Show or hide text and lines, including adjusting the color of text and lines.
-Adjust the size of text, and change the type of lines, including modifying text.
Equilibrium internal
-Show or hide text and lines, including adjusting the color of text and lines.
-Adjust the size of text, and change the type of lines, including modifying text.
-Adjust the percentage of Equilibrium.
EXTERNAL STRUCTURE MAPPING
Body breaks confirm an internal structure break.
BULLISH & BEARISH EXTERNAL STRUCTURE
Bullish external Structure:
-An external high is validated with 4 optional criteria.
-An external higher low is validated when the external high structure is broken. A higher low refers to the lowest price.
Bearish external Structure:
-An external low is validated with 4 optional criteria.
-An external lower high is validated when the external high structure is broken. A lower high refers to the highest price.
Settings
-Show or hide text and lines, including adjusting the color of text and lines.
-Adjust the size of text, and change the type of lines, including modifying text when there is a BoS and CHoCH.
-Mark swing when there is a valid pullback, adjust the size and color.
Validation of pullback has 4 options for exploration, with the default value set to Internal CHoCH 1 time:
1.Internal CHoCH 1 time.
2.Internal CHoCH and wait for Internal BoS/Internal CHoCH 3 times in a row.
3.PIP Rule, using PIP to determine the distance of a valid pullback.
-Show or hide lines and values. This option will only display results when you activate the PIP Rule. Change the style of lines and change the color of lines.
-In the PIP field, enter the PIP value you want to explore. In the 1 PIP Size field, enter the decimal places in the asset you are trading. For example, for the EUR/USD pair with decimals at position 4.
4.ATR Rule, utilizing ATR multiples to establish the range of a valid pullback.
-Show or hide lines and values. This option will only display results when you activate the ATR Rule. Change the style of lines and change the color of lines.
-ATR type allows you to choose from 5 ma types. ATR Period adjusts the backward-looking average value you want to explore. Multiple: Enter a multiplier value for ATR to match the volatility or asset you are trading.
If you choose only ATR Rule, the result is the validation of the pullback with ATR Rule only. If you choose more than 1 option, whichever condition is true, the validation pullback occurs immediately. If you don't choose anything, the default value is Internal CHoCH 1 time.
Swing external structure
-Show or hide text and lines, including adjusting the color of text and lines.
-Adjust the size of text, and change the type of lines, including modifying text.
Equilibrium external
-Show or hide text and lines, including adjusting the color of text and lines.
-Adjust the size of text, and change the type of lines, including modifying text.
-Adjust the percentage of Equilibrium.
The values of these 4 options are: 1. PIP Rule in the internal structure 2. ATR Rule in the internal structure 3. PIP Rule in the external structure 4. ATR Rule in the external structure
These 4 options will be displayed only when the rule is selected along with choosing to display the value.
DISCLAIMER
All investments involve risks. Profit or loss depends on your knowledge, understanding, and decisions.
My scripts/indicators/strategies are created for researching past price behavior only. They are not investment advice, and future results are not guaranteed.

DEMO - FxCanli PRZEN - FxCanli PRZ indicator shows Price Reversel Zones on your charts.
DEMO VERSION of FXCANLI PRZ Indicator work with any NZD or any DOGE symbols
TR - FxCanli PRZ indikatörü grafiklerinizde olası dönüş bölgelerini gösterir.
FXCANLI PRZ indikatörünün DEMO VERSİYONUNU herhangi bir NZD veya DOGE sembolü ile kullanabilirsiniz.
EN - For Example | TR - Örnek
NZD|...
NZD|USD
NZD|CAD
NZD|CHF
NZD|JPY
DOGE|...
DOGE|USD
DOGE|USDT
DOGE|USDTPERP
DOGE|BTC
FEATURES & EXAMPLES / ÖZELLİKLER & ÖRNEKLER
**************************************************************
Multi Language / Çok Dil
EN - You can get alerts in English or Turkish language
TR - Alarmları İngilizce veya Türkçe olarak alabilirsiniz.
Bullish - Bearish PRZ / Boğa - Ayı yönlü PRZ
EN - You can choose Bullish and Bearish PRZ or either
TR - Boğa ve Ayı yönlü veya herhangi birini seçebilirsiniz
Buy - Sell Labels / Al -Sat Etiketleri
EN - You can see (S)ell label and (B)uy label at the end of Price Reversal Zones
TR - Olası Dönüş Bölgelerinin sonunda (S)ell-Sat etiketini ve (B)uy-Al etiketini görebilirsiniz.
Panel Properties / Panel Özellikleri
EN - In the panel settings, you can follow up with different characters and emojis when you enter the PRZ, at the PRZ and exit from PRZ.
TR - Panel ayarlarında, olası dönüş bölgesine girdiğinde, olası dönüş bölgesinde ve olası dönüş bölgesinden çıktığını faklı karakter ve emojiler ile takip edebilirsiniz
Multi Timeframe / Çoklu Zaman dilimi
EN - You can easly follow all timeframes at one chart
TR - Tüm zaman dilimlerini tek bir grafikte takip edebilirsiniz
EN - Panel Width - to get better view at mobile phones and tablets
TR - Cep telefonları ve tabletlerde daha güzel görünüm için Panel Genişliği
Alerts / Alarmlar
EN - You can set only one alert for all timeframe and all prz alerts
TR - Bir alarm kurarak, tüm zaman dilimlerinde PRZ alarmlarını alabilirsiniz
FluidTrades - SMC Lite
Price action and supply and demand is a key strategy use in trading. We wanted it to be easy and efficient for user to identify these zones, so the user can focus less on marking up charts and focus more on executing trades.
This indicator shows you supply and demand zones by using pivot points to show you the recent highs and the recent lows.
Features
This indicator includes some features relevant to SMC , these are highlighted below:
Full internal & swing market structure labeling in real-time
Swing Structure: Displays the swing structure labels & solid lines on the chart (BOS).
Supply & demand ( bullish & bearish )
Swing Points: Displays swing points labels on chart such as HH, HL, LH, LL.
Options to style the indicator to more easily display these concepts
White OB (supply): search for short opportunities
Blue OB (demand): search for long opportunities
Break of structure ( BOS )
For markets to move up and down a break in market structure must occur. A break in market structure occurs when the market begins to shift direction and break the previous HH and HL or HL and LL of the market. We also integrated the feature that you can see the BOS lines. In the indicator settings you can adjust the color of the label.
Settings
SwingHigh/Low Length: Allows the user to select Historical (default) or Present, which displays only recent data on the chart.
Supply/demand box width: Allows user to change the size of the supply and demand box
History to keep: allows the user to select how many most recent supply & demand box appear on the chart.
Visual settings
Show zig zag : allow user to see market patters within the market
Show price action labels: allow user to turn on/off the (swing points)
Supply box color : allow users to change the color of their supply box
Demand box color : allow users to change the color of their supply box
Bos label color : allow users to change the color of their BOS label
Poi label color : allow user to change the color of their POI label
Price action label : allow users to change the color of their swing points labels
Zig zag color : allow users to change the color of the zig/zag market patters
Warning
Never blindly take a trade on a supply/demand box - wait for a proper market structure to occur before considering a trade.

ProConcepts (v-1.0.2)ProConcepts is a smart moeny concepts indicator that has several primary functions and features.
BOS Feature: BOS stands for break of structure and this is used to determine market structure support and resistance breakouts. The blue and red lines plot the pivot highs and lows on every time frame. When a trend is in a single direction and BOS appears, that is a strong sign that market structure is broken and the trend will continue.
CHOCH Feature: Similar to BOS the change of character feature is also a smart money concept where in a trend, CHOCH essentially is used to help determine a change of that trend with a low being violated in an uptrend or a high being violated in a downtrend. CHOCH is what determines the high lows of the trend.
Shaded Candle Feature: The candles are shaded either red or blue based on the trend. the CHOCH as discussed previously determines the trend and shades the candles blue and red according to the highs and lows.
Sessions Shading Feature: The background shading with lower opacity indicates a sessions feature that seperates the main trading sessions of the day, London, Asia, and New York. They are color coordinated and can be changed to fit your needs as a trader.
FVG Feature: FVG stands for fair value gap which is an area on the chart where there is a single directional movement either bullish for the blue FVG and bearish for the red FVG. These fvgs are strong areas of interest for rejections of price because they are agressive movements similar to an imbalance. The FVG should be used as a retest confirmation of a trend during a breakout of the BOS or a CHOCH.
High Low Feature: Disabled on the default chart is a a high low feature that marks all of the high lows of a trend so you can identify areas of support and resistance.

SMC IndicatorTitle: Smart Money Concepts Market Structure
Description: This is a technical analysis tool designed to map Market Structure using Smart Money Concepts (SMC) logic. Unlike standard ZigZag indicators that often clutter the chart with repainting lines, this script focuses on delivering a clean, objective view of Trend Structure (Highs/Lows) and Structural Breaks.
The Problem It Solves: Traders often struggle to identify the valid "Swing High" or "Swing Low" in real-time. This indicator automates that process using a non-repainting detection engine, helping traders objectively spot Trend Continuations (BoS) and Potential Reversals (CHoCH).
How It Works:
1. Pivot Detection (The ZigZag Engine): The script identifies Swing Points based on a user-defined Depth and Deviation %.
High (H): A peak is confirmed when price retraces by the deviation percentage.
Low (L): A trough is confirmed when price rallies by the deviation percentage.
Ghost Line: A dotted line connects the last confirmed pivot to the current live price, allowing you to visualize the developing structure before it locks in.
2. Structure Mapping: Once pivots are confirmed, the script analyzes price action relative to those points:
BoS (Break of Structure): Trend Continuation. Triggered when price breaks a confirmed pivot in the direction of the trend (e.g., breaking a Higher High in an uptrend).
CHoCH (Change of Character): Trend Reversal. Triggered when price breaks a major pivot in the opposite direction (e.g., breaking a Higher Low in an uptrend).
Visual Features:
Minimalist Design: Uses floating text labels (no background boxes) to keep price action visible.
Color Coded: Blue/Maroon for Continuation (BoS), Aqua/Orange for Reversal (CHoCH).
Settings Guide:
ZigZag Deviation %: Set this to 5.0 for Higher Timeframes (Daily/4H) or lower it to 0.2 - 0.5 for Intraday Scalping (1m/5m).
Ghost Line: Toggle on/off to see the real-time projection.
Alerts: Full alert support included for Bullish/Bearish BoS and CHoCH signals.
Credits: Logic based on standard Price Action and Market Structure theory.

Demand & Supply (3 MTF) + SMC & Alerts by StockFusion 3.2Demand & Supply (3 MTF) + SMC & Alerts by StockFusion 3.2
**Overview**
Demand & Supply (3 MTF) + SMC & Alerts by StockFusion 3.2 is a multi–timeframe institutional-style trading tool that automatically detects high-quality Demand & Supply zones (3 TF), Smart Money Concepts (CHoCH & BOS), institutional volume footprints, Fair Value Gaps (FVG), and structural Premium/Discount levels. It is designed to give traders a clear HTF–MTF–LTF view, with smart alerts and a compact trend meter, so that execution can be done with more clarity and discipline.
**Description**
This indicator combines three core engines in one:
* **3× MTF Demand & Supply Zones**
* Auto-detection of RBR/DBR (DZ) and DBD/RBD (SZ) across TF-1 / TF-2 / TF-3.
* Manual / Normal / Conservative / Analysis modes for zone quality control (explosive/body ratios, ATR multipliers, volume filters).
* Dynamic zone removal on retest/mitigation (first & second-leg logic) with optional historical label retention.
* Multi-TF visibility controls (show HTF zones on LTF, LTF on HTF, etc.) and live “Nearest Zone Table” with Proximal/Distal & proximity %.
* **SMC (CHoCH, BOS, FVG, Premium/Discount)**
* Automatic CHoCH & BOS mapping with swing-based detection, visual lines and labels.
* FVG detection (bullish & bearish) with mitigation tracking, optional opacity reduction and mitigation alerts.
* Auto structure engine (HH/LL, BOS/CHoCH) with configurable lookback and line styles.
* Premium/Discount auto-fib levels (1.0/0.78/0.71/0.5/0.0) + optional “P / D” labels and 0.71 touch alerts when aligned with FVG & volume.
* **Institutional Volume, Trend Meter & Extras**
* Institutional “I/X” footprint detection with volume multipliers, significant & extreme volume spike markers + optional alerts.
* Trend Meter table for 3 higher timeframes using 50-period MAs (D/W/M by default) with quick visual up/down bias.
* 3-in-1 colored SMA/EMA pack, inside-bar detector with optional coloring and high/low lines for price action traders.
All key components are modular: you can toggle zones, SMC, institutional activity, FVG, fib structure, alerts, trend meter, and inside candles as per your trading style (intraday, swing, positional, or pure analysis).
**Disclaimer**
This indicator is for **educational and analytical purposes only** and does **not** constitute financial, investment, or trading advice. No buy/sell/hold recommendations are given, and no profitability or performance is guaranteed. Markets are risky; always do your own research, test on demo first, and consult your financial advisor if needed. By using this script, you accept that you are fully responsible for your own trading decisions and results.
