RSI-all in one_Pro[vn]👉Hello traders.
Introducing the " RSI all-in-one " Bot that includes the functions:
+ Automatically scan RSI divergence
+ Automatically scan RSI trendlines
+ Create an alert when there is a golden signal (RSI creates a divergence and then breaks its trendline, signaling a trend reversal)
Explain:
During trading when using the indicator "RSI - trendlines - div " in my library on TW web page:
- I have an idea to create a Bot indicator about "Automatically scan RSI divergences and trendlines". Because those are the top strengths when traders use the RSI to forecast trend reversals.
- On each chart of the trading pair, the RSI draws the trendline pair as: uptrendline and downtrendline (closest to the RSI)
- So when the statistics on "Bot" also shows the column of RSI trendlines up and the column of RSI trendlines down
- Column |════🡹 \ʀꜱɪ| - is the above RSI trendline
- Column |ʀꜱɪ \════🡻| - is the below RSI trendline
- When RSI approaches any one of its trendlines and the ratio is 10%, then:
+ in column |✎ \𝖙.𝖑𝖎𝖓𝖊| Red colored digits (downtrend)
+ in column |𝖙.𝖑𝖎𝖓𝖊 \✐| blue colored digits (uptrend)
Is the value of the RSI trendline for traders to pay more attention to when it can be the entry and exit points according to the resistance and support nature of the RSI trendlines.
- When the RSI breaks the above trendline, it shows is "🡹", if it is the first candle, at the column |════🡹 \ʀꜱɪ| it shows as "🡹1|1|1" the cell turns green , that's the RSI signal breaking the line. Its resistance to go up, wait for the candle to close, we can enter "Buy/Long" order.
- When the RSI line breaks below the trendline, it shows is "🡻", if it is the first candle, then at the column |ʀꜱɪ \════🡻| it displays as "🡻1|1|1" the cell turns red , that's the RSI signal breaking the line Support to continue down, wait for the candle to close, we can enter "Sell/Short" order
- The parameter when breaking shows 10|10|10, it means that the RSI has broken 10 candles (RSI candles), and the first 10 candles are colored green (bullish) red (bearish) then hidden. (can be changed in settings). In addition, when displaying the parameters of the cell as above, the column |✎ \𝖙.𝖑𝖎𝖓𝖊| and |𝖙.𝖑𝖎𝖓𝖊 \✐| will show the percentage from when the RSI break point to the current RSI (closed)
- Column |𝚍𝚒𝚟| is a divergence signal. When the price makes a new high, a new low, and the RSI signals a divergence, it will start to increase the base from the number 1. From here, the Trader will know which trading pair is starting to divergence RSI. Cell is Green bullish divergence, Cell is red bearish divergence
- Column|🆁🆂🅸| is the current RSI .{🟢} RSI above the cloud , {🔴} RSI below the cloud , {⚪️} RSI in the cloud(RSI clouds also indicate very well the support and resistance zone of RSI)
- There are 5 warning functions on this indicator
- The parameter {20:2} is the length of the RSI trendline and combines the same parameters with the "RSI - trendlines - div{vn}" indicator when analyzing
💥 Summary:
Trading methods with this indicator:
+ Trade when there is a divergence
+ Trade when the RSI approaches its trendline (it is the support and resistance line of the RSI)
+ Trade when the RSI breaks the trendline (definitively above or below)
+ Trade when there is a divergence then after a few candles, RSI breaks through its trendline, giving a golden signal.
1 . image
Later(sau đó)
2 . image
Later(sau đó)
Note: The indicator can create up to 40 trading pairs, so traders should choose a super nice signal to enter orders.
-----------------------------------------------------Vietnamese-------------------------------------------------------
👉Xin chào các nhà giao dịch VietNam.
xin giới thiệu Bot "RSI-Tất cả trong một " bao gồm các chức năng:
+ Tự động quét phân kì RSI
+ Tự động quét đường xu hướng RSI
+ Tạo cảnh báo khi có tín hiệu vàng(RSI tạo phân kì và sau đó phá vỡ đường xu hướng của nó báo hiệu đảo chiều xu hướng)
Diễn giải:
- Trong quá trình giao dịch khi dùng chỉ báo "RSI - trendlines - div " trong thư viện của tôi trên trang TW . Tôi có ý tưởng tạo chỉ báo Bot về " Tự động quét phân kì và đường xu hướng của RSI ". Vì đó là những điểm mạnh hàng đầu khi nhà giao dịch sử dụng chỉ báo RSI để dự báo đảo chiều xu hướng.
- Trên mỗi biểu đồ của cặp giao dịch, chỉ báo RSI vẽ cặp trendline là: trendline tăng và trendline giảm (gần với RSI nhất)
- Vì vậy khi thống kê trên " Bot " cũng hiển thị cột của RSI trendlines tăng và cột của RSI trendlines giảm
- Cột |════🡹 \ʀꜱɪ| - là trendline RSI bên trên
- Cột |ʀꜱɪ \════🡻|- là trendline RSI bên dưới
- Khi RSI phá đường xu hướng bên trên thì nó hiển thị là "🡹", nếu là cây nến đầu tiên thì tại cột |════🡹 \ʀꜱɪ| nó hiển thị là "🡹1|1|1" ô đổi màu xanh , đó là tín hiệu RSI phá vỡ đường kháng cự của nó để đi lên , chờ nến đóng cửa ta có thể vào lệnh "Buy/Long"
- Khi đường RSI phá đường xu hướng bên dưới thì nó hiển thị là "🡻", nếu là cây nến đầu tiên thì tại cột |ʀꜱɪ \════🡻| nó hiển thị là "🡻1|1|1" ô đổi màu đỏ , đó là tín hiệu RSI phá vỡ đường hỗ trợ để xuống tiếp , chờ nến đóng cửa ta có thể vào lệnh "Sell/Short "
-Khi RSI tiến gần đến 1 đường trendline bất kì của nó mà tỉ lệ còn 10% thì:
+ tại cột |✎ \𝖙.𝖑𝖎𝖓𝖊| chữ số tô màu đỏ (trend giảm)
+ tại cột |𝖙.𝖑𝖎𝖓𝖊 \✐| chữ số tô màu xanh (trend tăng)
Là giá trị của đường trendline RSI để trader chú ý hơn khi đó có thể là điểm vào lệnh và thoát lệnh theo tính chất kháng cự hỗ trợ của RSI trendlines.
-Thông số khi phá vỡ hiển thị 10|10|10 thì hiểu là RSI đã phá vỡ 10 nến(nến RSI), và 10 nến đầu tiên được tô màu xanh(tăng giá) màu đỏ (giảm giá) sau đó được ẩn(có thể thay đổi trong cài đặt). Ngoài ra khi hiện thông số của ô như trên thì cột |✎ \𝖙.𝖑𝖎𝖓𝖊| và |𝖙.𝖑𝖎𝖓𝖊 \✐| sẽ hiển thị được số phần trăm tính từ khi điểm RSI phá vỡ đến RSI hiện tại(đóng cửa)
Cột |𝚍𝚒𝚟| là tín hiệu phân kì . Khi giá tạo đỉnh mới, đáy mới mà RSI báo tín hiệu là phân kì thì nó sẽ bắt đầu cơ số đếm từ số 1 tăng dần lên.Từ đây Trader sẽ biết được cặp giao dịch nào đang bắt đầu phân kì RSI. Ô màu xanh là phân kì tăng, ô màu đỏ là phân kì giảm
- Cột| 🆁🆂🅸 | là RSI hiện tại .{🟢} RSI trên mây , {🔴} RSI dưới mây , {⚪️} RSI trong mây(Mây của RSI cũng cho biết rất tốt vùng hỗ trợ, kháng cự của RSI)
- Có 5 chức năng cảnh báo trên chỉ báo này
- Thông số {20:2} là độ dài đường trendline RSI và kết hợp cùng thông số với chỉ báo "RSI - trendlines - div{vn}" khi phân tích
💥 Tổng kết:
Các phương pháp giao dịch với chỉ báo này:
+ Giao dịch khi có phân kì.
+ Giao dịch khi RSI tiếp cận đến đường xu hướng của nó(nó là đường hỗ trợ, kháng cự của RSI).
+ Giao dịch khi RSI phá vỡ đường xu hướng(trên hoặc dưới cách dứt khoát).
+ Giao dịch khi có phân kì sau đó qua vài nến, RSI phá vỡ qua đường xu hướng của nó báo hiệu tín hiệu vàng.
Lưu ý : Chỉ báo tạo được tối đa 40 cặp giao dịch, nên AE trader Việt cứ chọn tín hiệu siêu đẹp để vào lệnh nhé.
Rsi_divergence

RSI Supreme Multi-Method [MyTradingCoder]Introducing the "RSI Supreme Multi-Method" indicator, a powerful tool that combines the Relative Strength Index (RSI) with selectable manipulation methods to identify overbought and oversold conditions in the market, along with the ability to detect divergences for enhanced trading insights.
The indicator features four distinct manipulation methods for the RSI, each providing valuable insights into market conditions:
1. Standard RSI Method: The indicator uses the traditional RSI calculation to identify overbought and oversold areas.
2. Volatility Weighted RSI Method: This method applies a volatility formula to the RSI calculation, allowing for a more responsive indication of market conditions during periods of heightened volatility. Users can adjust the length of the volatility formula to fine-tune this method.
3. Smoothed RSI Method: The smoothed RSI method utilizes a smoothing algorithm to reduce noise in the RSI values, presenting a clearer representation of overbought and oversold conditions. The length of the smoothing can be adjusted to match your trading preferences.
4. Session Weighted RSI Method: With this innovative method, users can specify multipliers for different time sessions throughout the day to manipulate the base RSI. Each session can be customized with start and end times, enabling or disabling specific sessions, and specifying the multiplier for each session. This feature allows traders to adapt the RSI to different market sessions dynamically.
Additionally, the "RSI Supreme Multi-Method" indicator draws divergences on the oscillator, providing an extra layer of analysis for traders. Divergences occur when the direction of the RSI differs from the direction of the price movement, potentially signaling trend reversals.
Key Settings:
RSI Length: Adjust the length of the base RSI before applying any manipulation.
RSI Source: Determine the data source for the base RSI calculation.
Overbought Value: Set the RSI value at which overbought conditions are indicated.
Oversold Value: Set the RSI value at which oversold conditions are indicated.
RSI Type: Choose from four options: Standard, Smoothed, Volatility Manipulated, or Session Manipulated.
Volatility Manipulated Settings: Adjust the length of the volatility formula (applicable to Volatility Manipulated method).
Smoothed Settings: Adjust the length of the smoothing (applicable to Smoothed method).
Session Manipulated Settings: Customize six different time sessions with start and end times, enable or disable specific sessions, and specify multipliers for each session.
Divergence Color: Adjust the color of the drawn divergences to suit your chart's aesthetics.
Divergence Tuning: Fine-tune the sensitivity of the divergence detection for more accurate signals.
The "RSI Supreme Multi-Method" indicator is a versatile and comprehensive tool that can be used to identify overbought and oversold areas, as well as to spot potential trend reversals through divergences. However, like all technical analysis tools, it should be used in conjunction with other indicators and analysis methods to make well-informed trading decisions.
Enhance your trading insights with the "RSI Supreme Multi-Method" indicator and gain an edge in identifying critical market conditions and divergences with precision.

RSI Divergence Screener by zdmreThis screener tracks the following for up to 20 assets:
-All selected tickers will be screened in same timeframes (as in the chart).
-Values in table indicate that how many days passed after the last Bullish or Bearish of RSI Divergence.
For example, when BTCUSDT appears Bullish-Days Ago (15) , Bitcoin has switched to a Bullish Divergence signal 15 days ago.
Thanks to @QuantNomad and @MUQWISHI for building the base for this screener.
*Use it at your own risk
Note:
Screener shows the information about the RSI Divergence Scanner by zdmre with default settings.
Based indicator:

Custom Range Creator + Normalized Oscillators (Obv, Rsi, Mfi) Hello Traders!
Custom Range Creator is a specialized trading tool designed for traders who incorporate range analysis into their trading strategy.
Once you set the desired number of past candles or provide a manual input, the indicator will automatically draw a range for you. This unique feature allows you to customize the range based on the highest and lowest points within a specified number of bars, known as the "Dynamic Range." Furthermore, you have the flexibility to define up to three additional ranges manually using custom inputs. The lines and labels associated with these ranges can be fully customized in terms of style, color, and width to align with your personal preferences.
Dynamic Range Capabilities:
The indicator automatically generates a range by default, identifying the highest and lowest points within the last 200 bars. However, you have the ability to define the number of bars back by adjusting the setting in the menu. Moreover you can define the range based on either the wicks or the bodies of the candles.
The range includes the following components:
☀ Range High: The highest price point within the selected number of bars in the past
☀ Range Low: The lowest price point within the selected number of bars in the past
☀ Range Mid-Point: The calculated middle value between the Range High and Range Low
☀ First Quartile (Q1): The midpoint between the Range Low and the Range Mid-Point, effectively identifying the 25% level within the range
☀ Third Quartile (Q3): The midpoint between the Range Mid-Point and the Range High, identifying the 75% level within the range
By incorporating these critical levels within a price range, our Dynamic Range provides you with a comprehensive view of how the market evolves, enabling you to make more informed trading decisions.
Manual Ranges Capabilities:
In addition to the Dynamic Range, you can manually define up to three more ranges. By specifying your desired high and low price values as inputs, the system automatically draws the range based on your inputs. Once drawn, you can further adjust the range using the bar offset option, which allows you to shift the entire range backward or forward by a specified number of bars.
Each manually defined range includes the following components:
☀ Range High: Your user-defined highest price point
☀ Range Low: Your user-defined lowest price point
☀ Range Mid-Point: The calculated middle value between the Range High and Range Low
☀ First Quartile (Q1): The midpoint between the Range Low and the Range Mid-Point, identifying the 25% level within the range
☀ Third Quartile (Q3): The midpoint between the Range Mid-Point and the Range High, identifying the 75% level within the range
This allows you to precisely define your desired price range and visually represent it on the chart. The customizable manual ranges provide you with a powerful tool for analyzing price dynamics and identifying potential support and resistance levels.
Both Dynamic Range and Manual Ranges Capabilities:
a) Timeframe-Adaptive: This indicator dynamically adjusts to your selected timeframe. Whether you are a day trader or a long-term investor, this tool adapts to meet your needs.
b) Complete Customization: You have the flexibility to customize every aspect of "Custom Range Indicator". You can modify the color, style, and width of each of the five lines to seamlessly integrate them into your chart setup. Choose from various line styles, including solid, dashed, or dotted, and select colors that suit your visual preferences. Additionally, you can customize the color and text of the labels. Additionally, you can utilize the bar offset option to fine-tune the placement of the range within your analysis.
c) Hide Lines and Labels: You have the option to hide each line or label of the range individually, or hide the entire range with labels or without labels. This customization feature allows you to focus on specific aspects of the chart and declutter the visual representation of the ranges when needed.
Normalized Oscillators
Normalization is a process applied in data handling and statistics, and in the context of trading indicators, it can be incredibly useful. Trading indicators such as Volume, the Relative Strength Index (RSI), the Money Flow Index (MFI), and On Balance Volume (OBV), often vary in their range and scale.
Normalization adjusts these values to fit within a specific range, making different indicators directly comparable and aiding in the interpretation of their relationship and impact on price action. This can offer additional insights for traders, making it easier to identify trends, patterns, and potential trading signals across different indicators.
This indicator offers a selection of three oscillators to normalize and Volume Data:
☀Volume: The amount of a particular asset that is traded within a particular period.
☀Relative Strength Index (RSI): A momentum oscillator that measures the speed and change of price movements. It is typically used to identify overbought or oversold conditions in a market.
☀Money Flow Index (MFI): A momentum indicator that uses price and volume data to identify overbought or oversold signals in an asset.
☀On Balance Volume (OBV): A technical trading momentum indicator that uses volume flow to predict changes in price. It does this by cumulatively adding volume on days when the price increases, and subtracting volume on days when the price decreases.
This script also offers aesthetic customizations for the plot, which can enhance readability and visual appeal:
✔"Plot Color": This input lets users select the color of the plotted line on the chart, allowing for personalization and better visual differentiation when multiple indicators are used.
✔"Plot Width": Users can also adjust the thickness of the plotted line, enhancing visibility based on individual preference or screen resolution.
Why is useful the Normalization?
Normalization plays a crucial role in trading as it helps bring together diverse sets of information to support more informed decision-making. For instance, observing the correlation between the price chart and oscillators like On Balance Volume (OBV) near range levels can provide valuable insights.
Consider this example using a daily (1D) Ethereum (ETH) chart:
We observe that the price is at a Range Quarter, making a higher high while the OBV makes a higher low. This scenario presents a significant degree of confluence. The price is at a critical range level and there is a bearish divergence between the OBV and the price. Such confluence often indicates a potential shift in market dynamics, and as observed, the price trends lower subsequently.
Below is the same scenario represented on a linear chart, providing a clearer visualization:
Normalization enables us to make these comparisons more accurately, ultimately leading to more reliable trading signals and better trading outcomes. By adjusting the scale of various indicators to a standard range, traders can directly compare and correlate them to price action, making it easier to spot trends, divergences, and other key market patterns.
Keep attention!
It is important to note that no trading indicator or strategy is foolproof, and there is always a risk of losses in trading. While this indicator may provide useful information for making conclusions, it should not be used as the sole basis for making trading decisions. Traders should always use proper risk management techniques and consider multiple factors when making trading decisions.

RSI Chart LevelsThe RSI Chart Levels shows you in a simple way where Support/Resistance might be. You want to make sure all settings are the same in the RSI that you are using with this overlay to be accurate.
This is also good at spotting divergence in real-time. If price goes over the Higher High but the RSI hasn't gained a new Higher High it is showing divergence, vice versa for Lower Low.
This overlay was created with the idea of RSI Divergence Scanner by zdmre indicator. Add his RSI and match the settings to the chart overlay. The default Zigzag is set to 7 which zdmre settings is different so change to whatever you prefer.
Shoutout to zdmre original work!

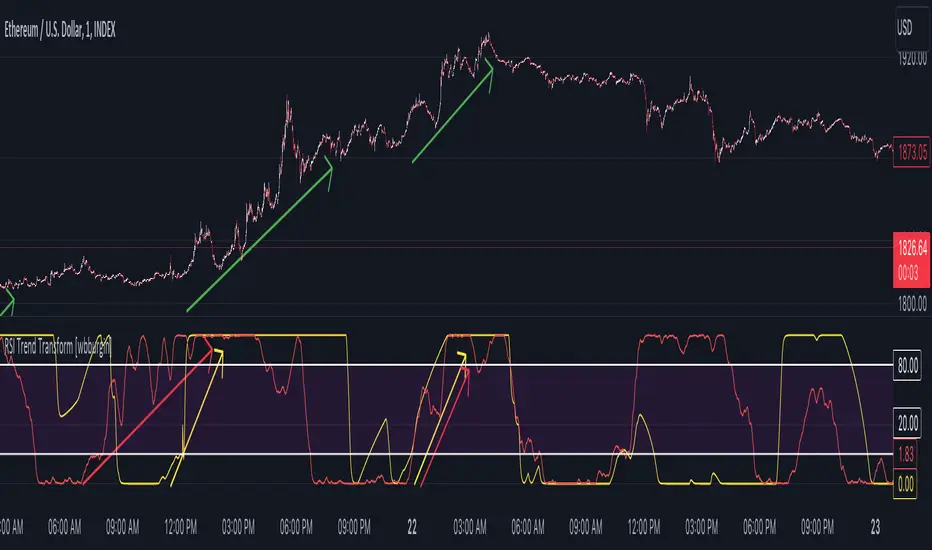
RSI Trend Transform [wbburgin]The RSI Trend Transform indicator is a dual-concept indicator that transforms volume data and price data into two different RSI values, which can then be used together to determine trend strength and momentum. The volume RSI does not use any price data in its calculation - it is purely a transform from nondirectional volume into a directional indicator.
The RSI for all three RSI values (price, volume,combined average) can be plotted as either stochastic or normal. The RSI calculation is adapted for use on volume, which is why the normal ta.rsi() function is not used for the price RSI calculation; both use the same formula for indicator consistency.
How to Use the Indicator
In the examples below, the Price RSI is plotted in yellow and the Volume RSI is plotted in red (length = 200, which is why the indicator is large in these examples). The indicator can be used on any timeframe and any asset, provided volume data is provided by the vendor to TradingView.
Identifying Bullish Trends
A rising volume RSI with a rising price RSI signifies a bullish trend. Example 1:
Example 2:
You can use the combined RSI (the average of the volume RSI and the price RSI) to help with the identification of these trends:
Identifying Bearish Trends
A falling volume RSI with a falling price RSI signifies a bearish trend:
Example 2:
Settings
Source is the source of the price RSI, the volume RSI will by default use volume in its calculations. If you have other indicators on-chart, you could even use the ATR, a volatility indicator, or any nondirectional or directional indicator and transform it into the "price" RSI.
Length is both the length of the RSI and the stochastic.
The next three rows are for each RSI you can plot on the indicator: price RSI, volume RSI, and combined RSI (average of price and volume). The first checkbox plots/removes them from the chart, you can subsequently choose the type of RSI (regular or stochastic), the color of the plot, and the length of the EMA smoothing applied afterward to the plot.
Upper Band and Lower Band refer to the overbought and oversold lines, respectively.
A note about the combined RSI- you will be unable to spot divergences if the combined RSI is the only plot on the indicator, so I encourage you to use the combined RSI as a way to confirm the overall trend if you notice the price RSI and the volume RSI and trending similarly.
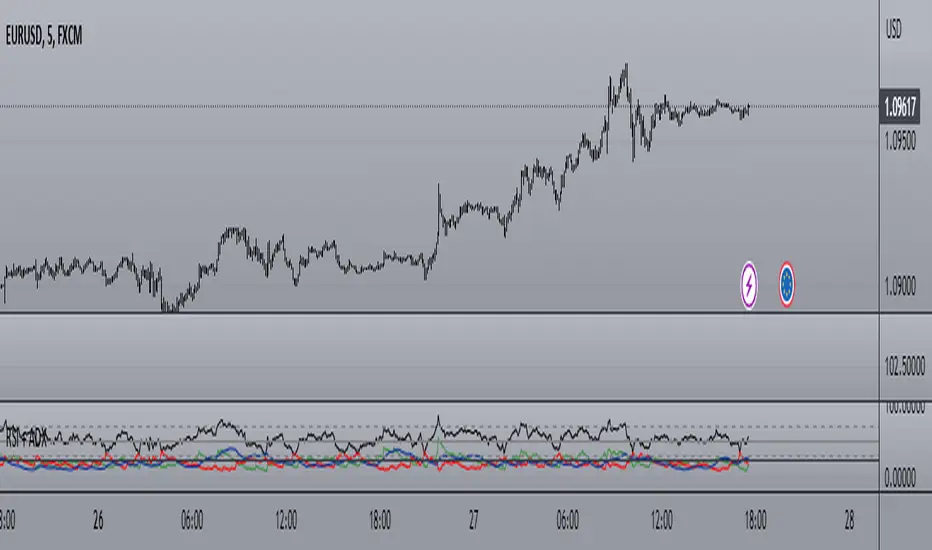
RSI + ADX + MACDINDICADOR COMBINADO DE RSI + ADX
Aprovecha las ventajas de cada indicador en uno solo.
Teniendo en un solo indicador el momentum de cada tendencia y la fuerza relativa con sus puntos de sobre compra y sobre venta.
También al poder analizar divergencias en el indicador oscilador RSI y poder crear estrategias de entrada con el ADX
-------------------------------------------------------------------------------------------------------------------------------------------------------------------------------
RSI + ADX COMBINED INDICATOR
Take advantage of each indicator in one.
Having in a single indicator the momentum of each trend and the relative strength with its points of overbought and oversold.
Also by being able to analyze divergences in the RSI oscillator indicator and being able to create entry strategies with the ADX
DERECHOS DEL CREADOR PARA: Dvd_trading
RSI MTF [Market Yogi]The Multi-Time Frame RSI with Money Flow Index and Average is a powerful trading indicator designed to help traders identify overbought and oversold conditions across multiple time frames. It combines the Relative Strength Index (RSI) with the Money Flow Index (MFI) and provides an average value for better accuracy.
The Relative Strength Index (RSI) is a popular momentum oscillator that measures the speed and change of price movements. It oscillates between 0 and 100 and is used to identify overbought and oversold conditions in an asset. By incorporating the RSI across multiple time frames, this indicator offers a broader perspective on market sentiment.
In addition to the RSI, this indicator also includes the Money Flow Index (MFI). The MFI is a volume-based oscillator that measures the inflow and outflow of money into an asset. It takes into account both price and volume, providing insights into the strength and direction of buying and selling pressure.
By combining the RSI and MFI across multiple time frames, traders gain a comprehensive understanding of market dynamics. The indicator allows for comparing the RSI and MFI values across different time frames, enabling traders to identify divergences and potential trend reversals.
Furthermore, this indicator provides an average value of the multi-time frame RSI, offering a consolidated signal that helps filter out noise and enhance the accuracy of trading decisions.
Key Features:
1. Multi-Time Frame RSI: Combines the RSI across different time frames to provide a comprehensive view of market sentiment.
2. Money Flow Index (MFI): Incorporates the MFI to gauge buying and selling pressure based on both price and volume.
3. Average Calculation: Computes the average value of the multi-time frame RSI to generate a consolidated trading signal.
4. Divergence Detection: Enables traders to spot divergences between the RSI and MFI values, indicating potential trend reversals.
5. Overbought and Oversold Levels: Highlights overbought and oversold levels on the RSI, aiding in timing entry and exit points.
The Multi-Time Frame RSI with Money Flow Index and Average is a versatile tool that can be applied to various trading strategies, including trend following, swing trading, and mean reversion. Traders can adjust the time frame settings to suit their preferences and trading style.
Note: It's important to use this indicator in conjunction with other technical analysis tools and indicators to validate signals and make informed trading decisions.

*Zig Zag Price, % Change w/RSI*With immense help from ©SimpleCryptoLife who reimagined this script for me, and to ©mmoiwgg and ©ocaptain who's ideas led to this updated version 5.
This indicator is fairly straight-forward and visually appealing because you get a running zig zag price, price % change with an added bonus - RSI. However you won't find zig zag lines but the script reacts the same by changing the inputs. The higher the value the less data points you'll see on the screen.
The main objective of this indicator is to be able to spot high and low prices easily with the price % change between the same 2 data sets. Additionally and arguably more importantly, with the RSI values associated with the high and low prices, you can spot divergences easily - meaning the price is making a higher high while conversely the RSI value at the next pop (around the same price as previous high) is lower which can mean that momentum has exhausted for the time being and a reversal could be imminent.
This script is meant only as a tool to try to enrich your trading journey and I hope it helps you become a more consistent and profitable trader. If you find it invaluable drop a like and comment. Good luck!

Divergence RSI V2This indicator is based on the concept of divergence. I recommend that you find out and study about this yourself as the concept of divergence will not be explained in depth in this description.
This indicator will show divergences between the asset price and the RSI oscillator. The indicator will look for divergent points between the rising highs and falling lows of the asset; and the rising lows and falling highs of the RSI.
The trend of the asset tends to follow the behavior of the oscillator when a divergence occurs. So if we find a divergence between the two, the price of the asset is likely to follow the trend of the oscillator.
This indicator looks for these types of divergences and will show (based on the RSI) if there is a bullish or bearish divergence.
If it is bullish, it will show a line joining those points in green and if it is bearish in red. In addition, it will show a label where you can see the number of occurrences that have been found from a certain point to another.
Note: this indicator can be complemented with the “Divergence V2” indicator which is also found in my library.
Settings
Backtesting Bars : is the number of bars back that the indicator will check. No more than 1000 is recommended as this will slow down the search.
Tolerance: number of times a divergent line can cross a bar. If you place 0, no bar can be crossed by a diverging line.
Min Bars To detect: will only search for divergences (or lines) that have the minimum number of bars selected in this option. Default option is 30.
Min Bars To detect: it will only search for divergences (or lines) that have the maximum number of bars selected in this option. Default option is 100.
Source Highs: The high points will be based on the close of each bar. You can use as another alternative.
Source Lows: The low points will be based on the close of each bar. You can use as another alternative.
Use squeeze parameter: only look for divergences (bullish or bearish) at times when such an indicator is in favor of the trend or coincides with the corresponding RSI divergence.
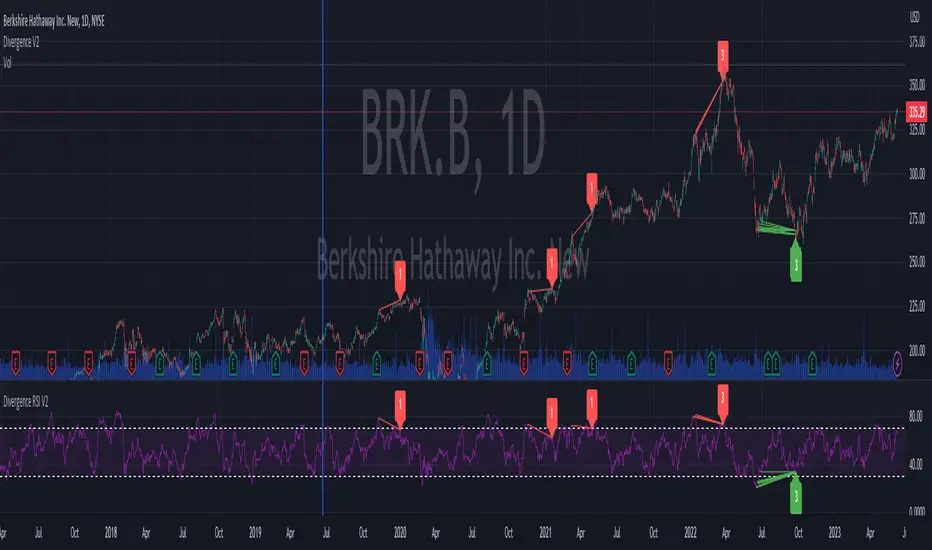
Divergence V2This indicator is based on the concept of divergence. I recommend that you find out and study about this yourself as the concept of divergence will not be explained in depth in this description.
This indicator will show divergences between the asset price and the RSI oscillator. The indicator will look for divergent points between the rising highs and falling lows of the asset; and the rising lows and falling highs of the RSI.
The trend of the asset tends to follow the behavior of the oscillator when a divergence occurs. So if we find a divergence between the two, the price of the asset is likely to follow the trend of the oscillator.
This indicator looks for these types of divergences and will show (based on the RSI) if there is a bullish or bearish divergence.
If it is bullish, it will show a line joining those points in green and if it is bearish in red. In addition, it will show a label where you can see the number of occurrences that have been found from a certain point to another.
Note: this indicator can be complemented with the “Divergence RSI V2” indicator which is also found in my library.
Settings
Backtesting Bars: is the number of bars back that the indicator will check. No more than 1000 is recommended as this will slow down the search.
Tolerance: number of times a divergent line can cross a bar. If you place 0, no bar can be crossed by a diverging line.
Min Bars To detect: will only search for divergences (or lines) that have the minimum number of bars selected in this option. Default option is 30.
Min Bars To detect: it will only search for divergences (or lines) that have the maximum number of bars selected in this option. Default option is 100.
Source Highs: The high points will be based on the close of each bar. You can use as another alternative.
Source Lows: The low points will be based on the close of each bar. You can use as another alternative.
Use squeeze parameter : only look for divergences (bullish or bearish) at times when such an indicator is in favor of the trend or coincides with the corresponding RSI divergence.

Stochastic RSI with DivergencesThis indicator is Stochastic RSI using code loops* rather than pivot low/high functions.
The pivot low/high function provided by Pine Script requires a set number of bars to pass prior to locating a swing low/high.
This can mean large moves have occurred prior to a swing low having passed if the lookback range was set to five bars (5).
5 bars on a 2 hour chart is a long time and large moves may be missed.
As I don't use these functions, there is no requirement for a set number of bars to have passed prior to swing low/high positions to be identified.
This means it doesn't rely on a set number of bars to pass prior to finding a new pivot point.
* Code loops are a function which will check conditions in a range until a defined condition is met.
In this case a pivot low is a bar with no lower bars within 3 bars either side of the current checked bar.
Additional:
Lines will redraw and delete previous divergences to remove clutter on the indicator.
A table cells for alternate timeframe Stochastic RSI values so you don't need to swap between charts constantly.
How it works:
The first lookback finds an initial low/high within a small range of the current bar. (default of 10)
This low/high must be the lowest/highest point within 3 bars either side.
The second low/high must be over 5 bars prior to the recent low and a max range of previous lookback. (default of 30)
This low/high must be the lowest/highest point within 3 bars either side.
If a divergence is found, it will draw the divergence on the indicator and delete the prior line drawn.
Personal note:
Personally coded functions for my personal use, though others may find use with it.

Comparison with BTC (RSI)显示当前品种与BTC汇率对的RSI值
以此判断强势或弱势品种以及超买超卖
——————————
Display the RSI value of the exchange rate between the current variety and BTC
Use this to determine strong or weak varieties, as well as overbought and oversold

RSI Trending with DivergencesThis script uses the RSI and RSI divergences to mark signals where the rsi is both below/above the 50, below/above its moving average, and where the last regular or hidden divergence matches that state. The RSI is built into the indicator, so you don't need it in your bottom pane if you don't want it, I just put one there for illustrative purposes. Please note it will not print the same signal consecutively, as it is meant to show an overall direction, not the in and out fluctuations. I suggest using it in conjunction with some moving averages so you can ignore signals not in the trend.
DCA Detective | v1.0BINANCE:FETBUSD
The DCA Detective | v1.0 strategy revolutionizes the realm of DCA (Dollar Cost Averaging) trading, integrating advanced trade initiation predicated on savvy Technical Analysis (TA) signals. This strategy's distinctive feature rests in its capacity to leverage TA signals or preset percentage levels to trigger safety orders, providing adaptability based on your preference. Bid farewell to rudimentary safety order placements.
The strategy incorporates a comprehensive array of parameters:
RSI Oversold Level - a predetermined level signaling a potential oversold condition where a price rebound may be imminent.
Divergence Lookback Period - this parameter specifies the duration over which the system scrutinizes for any disparity between price and RSI.
Minimum Bars Between Trades - this guarantees a specific interval between trades, thwarting excessive trading and promoting diversification over time.
Rate of Change (ROC) - a momentum-oriented technical indicator that gauges the percentage alteration in price between the current price and the price a certain number of periods back.
Stochastic Length and Oversold - parameters that delineate the Stochastic Oscillator, another momentum indicator that compares a particular closing price of a security to a spectrum of its prices over a specified period.
Higher Timeframe RSI Length and Oversold Level - for heightened precision, these parameters operate on lower timeframes, offering a wider outlook and aiding in the filtering of market noise.
The DCA Detective | v1.0 strategy deploys bullish divergence identified by the RSI and a crossover of the RSI over the oversold level as primary entry signals. Safety order conditions can be set to either Percentage or Smart, based on your preference. The "Smart" condition utilizes the same rules as the initial entry order to place safety orders.
The strategy also entails additional configuration settings such as the maximum safety orders, safety order price deviation, safety order volume scale, safety order step scale, and take profit percentage.
Main goal is to catch possible market bottom/dip.
In summary, the DCA Detective | v1.0 strategy proposes a sophisticated and nuanced approach to DCA trading. It taps into the potential of TA signals to initiate trades, while using safety orders as a risk management tool, with the intent to minimize possible losses and decrease overall time in trade. This strategy stands as a testament to refined trading tactics, crafted for those who endorse strategic investment and measured risk-taking.
Through webhook integration, the DCA Detective | v1.0 strategy can send signals to 3commas to initiate trades, adjust safety orders, and take profit at the designated percentages. This provides traders with a hands-off approach to trading, allowing them to focus on other areas of their portfolio or strategy while the DCA Detective | v1.0 strategy runs in the background.
So far, I haven't come across a good DCA strategy based on TA orders, so I created my own. I was troubled by my prolonged exposure to red bags, but with proper configuration, this strategy should get you out of the trade as soon as possible. I have managed to enter most of the good coins at an unbeatable average trade time and also eliminate the maximum trade time to less than 10 days !

JS-TechTrading: Supertrend-Strategy_Basic versionAre you looking for a reliable and profitable algorithmic trading strategy for TradingView? If so, you might be interested in our Supertrend basic strategy, which is based on three powerful indicators: Supertrend (ATR), RSI and EMA.
Supertrend is a trend-following indicator that helps you identify the direction and strength of the market. It also gives you clear signals for entry and exit points based on price movements.
RSI is a momentum indicator that measures the speed and change of price movements. It helps you filter out false signals and avoid overbought or oversold conditions.
EMA is a moving average indicator that smooths out price fluctuations and shows you the long-term trend of the market. It helps you confirm the validity of your trades and avoid trading against the trend.
Our Supertrend basic strategy combines these three indicators to give you a simple yet effective way to trade any market. Here's how it works:
- For long trades, you enter when the price is above Supertrend and pulls back below it (the low of the candle crosses Supertrend) and then rebounds above it (the high of the next candle goes above the pullback candle). You exit when the price closes below Supertrend or when you reach your target profit or stop loss.
- For short trades, you enter when the price is below Supertrend and pulls back above it (the high of the candle crosses Supertrend) and then drops below it (the low of the next candle goes below the pullback candle). You exit when the price closes above Supertrend or when you reach your target profit or stop loss.
- You can also use RSI and EMA filters to improve your results. For long trades, you only enter if RSI is above 50 and price is above 200 EMA. For short trades, you only enter if RSI is below 50 and price is below 200 EMA.
- You can set your stop loss and target profit as a percentage of your entry price or based on other criteria. You can also adjust the parameters of each indicator according to your preferences and risk tolerance.
Our Supertrend basic strategy is easy to use and has been tested on various markets and time frames. It can help you capture consistent profits while minimizing your losses.

The Flash-Strategy (Momentum-RSI, EMA-crossover, ATR)The Flash-Strategy (Momentum-RSI, EMA-crossover, ATR)
Are you tired of manually analyzing charts and trying to find profitable trading opportunities? Look no further! Our algorithmic trading strategy, "Flash," is here to simplify your trading process and maximize your profits.
Flash is an advanced trading algorithm that combines three powerful indicators to generate highly selective and accurate trading signals. The Momentum-RSI, Super-Trend Analysis and EMA-Strategy indicators are used to identify the strength and direction of the underlying trend.
The Momentum-RSI signals the strength of the trend and only generates trading signals in confirmed upward or downward trends. The Super-Trend Analysis confirms the trend direction and generates signals when the price breaks through the super-trend line. The EMA-Strategy is used as a qualifier for the generation of trading signals, where buy signals are generated when the EMA crosses relevant trend lines.
Flash is highly selective, as it only generates trading signals when all three indicators align. This ensures that only the highest probability trades are taken, resulting in maximum profits.
Our trading strategy also comes with two profit management options. Option 1 uses the so-called supertrend-indicator which uses the dynamic ATR as a key input, while option 2 applies pre-defined, fixed SL and TP levels.
The settings for each indicator can be customized, allowing you to adjust the length, limit value, factor, and source value to suit your preferences. You can also set the time period in which you want to run the backtest and how many dollar trades you want to open in each position for fully automated trading.
Choose your preferred trade direction and stop-loss/take-profit settings, and let Flash do the rest. Say goodbye to manual chart analysis and hello to consistent profits with Flash. Try it now!
General Comments
This Flash Strategy has been developed in cooperation between Baby_whale_to_moon and JS-TechTrading. Cudos to Baby_whale_to_moon for doing a great job in transforming sophisticated trading ideas into pine scripts.
Detailed Description
The “Flash” script considers the following indicators for the generation of trading signals:
1. Momentum-RSI
2. ‘Super-Trend’-Analysis
3. EMA-Strategy
1. Momentum-RSI
• This indicator signals the strength of the underlying upward- or downward-trend.
• The signal range of this indicator is from 0 to 100. Values > 60 indicate a confirmed upward- or downward-trend.
• The strategy will only generate trading signals in case the stock (or any other financial security) is in a confirmed upward- (long entry signals) or downward-trend (short entry signals).
• This indicator provides information with regards to the strength of the underlying trend and it does not give any insight with regard to the direction of the trend. Therefore, this strategy also considers other indicators which provide technical confirmation with regards to the direction of the underlying trend.
Graph 1 shows this concept:
• The Momentum-RSI indicator gives lower readings during consolidation phases and no trading signals are generated during these periods.
Example (graph 2):
2. Super-Trend Analysis
• The red line in the graph below represents the so-called super-trend-line. Trading signals are only generated in case the price action breaks through this super-trend-line indicating a new confirmed upward-trend (or downward-trend, respectively).
• If that happens, the super trend-line changes its color from red to green, giving confirmation that the trend changed from bearish to bullish and long-entries can be considered.
• The vice-versa approach can be considered for short entries.
Graph 3 explains this concept:
3. Exponential Moving Average / EMA-Strategy
The functionality of this EMA-element of the strategy has been programmed as follows:
• The exponential moving average and two other trend lines are being used as qualifiers for the generation of trading-signals.
• Buy-signals for long-entries are only considered in case the EMA (yellow line in the graph below) crosses the red line.
• Sell-signals for short-entries are only considered in case the EMA (yellow line in the graph below) crosses the green line.
An example is shown in graph 4 below:
We use this indicator to determine the new trend direction that may occur by using the data of the price's past movement.
4. Bringing it all together
This section describes in detail, how this strategy combines the Momentum-RSI, the super-trend analysis and the EMA-strategy.
The strategy only generates trading-signals in case all of the following conditions and qualifiers are being met:
1. Momentum-RSI is higher than the set value of this strategy. The standard and recommended value is 60 (graph 5):
2. The super-trend analysis needs to indicate a confirmed upward-trend (for long-entry signals) or a confirmed downward-trend (for short-entry signals), respectively.
3. The EMA-strategy needs to indicate that the stock or financial security is in a confirmed upward-trend (long-entries) or downward-trend (short-entries), respectively.
The strategy will only generate trading signals if all three qualifiers are being met. This makes this strategy highly selective and is the key secret for its success.
Example for Long-Entry (graph 6):
When these conditions are met, our Long position is opened.
Example for Short-Entry (graph 7):
Trade Management Options (graph 8)
Option 1
In this dynamic version, the so-called supertrend-indicator is being used for the trade exit management. This supertrend-indicator is a sophisticated and optimized methodology which uses the dynamic ATR as one of its key input parameters.
The following settings of the supertrend-indicator can be changed and optimized (graph 9):
The dynamic SL/TP-lines of the supertrend-indicator are shown in the charts. The ATR-length and the supertrend-factor result in a multiplier value which can be used to fine-tune and optimize this strategy based on the financial security, timeframe and overall market environment.
Option 2 (graph 10):
Option 2 applies pre-defined, fixed SL and TP levels which will appear as straight horizontal lines in the chart.
Settings options (graph 11):
The following settings can be changed for the three elements of this strategy:
1. (Length Mom-Rsi): Length of our Mom-RSI indicator.
2. Mom-RSI Limit Val: the higher this number, the more momentum of the underlying trend is required before the strategy will start creating trading signals.
3. The length and factor values of the super trend indicator can be adjusted:ATR Length SuperTrend and Factor Super Trend
4. You can set the source value used by the ema trend indicator to determine the ema line: Source Ema Ind
5. You can set the EMA length and the percentage value to follow the price: Length Ema Ind and Percent Ema Ind
6. The backtesting period can be adjusted: Start and End time of BackTest
7. Dollar cost per position: this is relevant for 100% fully automated trading.
8. Trade direction can be adjusted: LONG, SHORT or BOTH
9. As we explained above, we can determine our stop-loss and take-profit levels dynamically or statically. (Version 1 or Version 2 )
Display options on the charts graph 12):
1. Show horizontal lines for the Stop-Loss and Take-profit levels on the charts.
2. Display relevant Trend Lines, including color setting options for the supertrend functionality. In the example below, green lines indicate a confirmed uptrend, red lines indicate a confirmed downtrend.
Other comments
• This indicator has been optimized to be applied for 1 hour-charts. However, the underlying principles of this strategy are supply and demand in the financial markets and the strategy can be applied to all timeframes. Daytraders can use the 1min- or 5min charts, swing-traders can use the daily charts.
• This strategy has been designed to identify the most promising, highest probability entries and trades for each stock or other financial security.
• The combination of the qualifiers results in a highly selective strategy which only considers the most promising swing-trading entries. As a result, you will normally only find a low number of trades for each stock or other financial security per year in case you apply this strategy for the daily charts. Shorter timeframes will result in a higher number of trades / year.
• Consequently, traders need to apply this strategy for a full watchlist rather than just one financial security.

RSI Screener and Divergence [5ema]
Displayed on the RSI chart according to a custom timeframe.
Displays the RSI tracking table of various timeframes.
Identify normal divergence, hidden divergence on RSI chat.
Show buy and sell signals (strong, weak) on the board.
Send notifications when RSI has a buy or sell signal.
-----
I reused some functions, made by (i believe that):
©paaax : The table position function.
@everget : The RSI divergence function.
@QuantNomad : The function calculated value and array to show on table for input symbols.
I have commented in my code. Thanks so much!
-----
How it works:
1. Input :
input.int length of RSI => calculate RSI.
input.int upper/lower => checking RSI overbought/oversold.
input.int right bars / left bars => returns price of the pivot low & high point => checking divergence.
input.int range upper / lower bars => compare the low & high point => checking divergence.
input.timeframe => request.security another time frame.
input.string table position => display screener table.
2. Input bool:
plot RSI on chart.
Plot Regular Bullish divergence .
Regular Bearish divergence.
Hidden Bullish divergence .
Hidden Bearish divergence.
3. Basic calculated:
Make function for RSI , pivot low & high point of RSI and price.
Request.security that function for earch time frame.
Result RSI, Divergence.
4. Condition of signal:
Buy condition:
RSI oversold (1)
Bullish divergence (2).
=> Buy if (1) and (2), review buy (1) or (2).
Sell condition:
RSI overbought (3).
Bearish divergence (4).
=> Sell if (3) and (4), review sell (3) or (4).
5. Table screener:
Time frame.
RSI (green - oversold, red - overbought)
Divergence (⬈⬈ - regular bullish , ⬊⬊ regular bearish , ⬊ - hidden bullish , ⬈ - hidden bearish ).
Signal (🟢 - Buy, 🔴 - sell, green 〇 - review buy, red 〇 - review sell)
----
This indicator is for reference only, you need your own method and strategy.
If you have any questions, please let me know in the comments.

Multiple Divergences - Candle Edition - Libertus█ OVERVIEW
This script will help you track multiple indicator divergences in an easy, clean, and very visible way. Currently supported indicators at the time of script publishing are the Relative strength index (RSI) and On balance volume (OBV). If you have suggestions on which other popular indicators to add, leave them in the comments or message me directly.
You can track divergences manually, but it's time-consuming, you can easily miss them and if you want to track it on more than one indicator it will consume a lot of your screen space.
The script is using my time-tested divergences code, loved by a lot of TradingView users. If you want to use RSI divergences code in your scripts, you can find it in my Relative Strength Index - Divergences - Libertus indicator .
This script continues to improve on my popular RSI Divergences - Candle Edition - Libertus .
█ USAGE
In short, divergences occur between price and indicator. When the price makes a new high or low, but the indicator doesn't make a new high or low. Please check Investopedia for a more detailed explanation of RSI and OBV divergences.
BULL marks bullish divergence, which means the price made a new low, but the indicator value still hasn't made a new low. It can indicate a bullish trend change.
BEAR marks bearish divergences, which means the price made a new high, but the indicator value still hasn't made a new high. It can indicate a bearish trend change.
PIVOT is the highest or lowest price (candle) in the lookback period.
ALERTS are available for all PIVOTS and divergences, including candles with multiple divergences.
█ SETTINGS
HIDE PIVOT - ON by default, hides pivots.
SHORTER LABELS - OFF by default, removes text from BEAR / BULL labels.
HIDE LABELS AND COLOR BACKGROUND - OFF by default, hides labels completely and colors chart background.
LOOKBACK PERIODS - number of candles script will check in history for the pivot.
Hopefully, this indicator will help you in your trading. Good luck!

Minervini Pullback Strategy_Trend-Template QualifierGeneral Description and Unique Features of this Script
Introducing the ultimate trend-following (long-only) strategy that offers a unique feature you won't find anywhere else!
1. Our script/strategy utilizes Mark Minervini's Trend-Template as a qualifier for identifying stocks and other financial securities in confirmed uptrends. Mark Minervini, a 3x US Investment Champion, developed the Trend-Template, which covers eight different and independent characteristics that can be adjusted and optimized in this trend-following strategy to ensure the best results. The strategy will only trigger buy-signals in case the optimized qualifiers are being met.
2. Our strategy is based on supply/demand balance in the market, making it timeless and effective across all timeframes. Whether you're day trading using 1- or 5-min charts or swing-trading using daily charts, this strategy can be applied and works very well.
3. We also incorporate technical indicators such as RSI and MACD to identify low-risk pullback entries in the context of confirmed uptrends. By doing so, the risk profile of this strategy and drawdowns are being reduced to an absolute minimum, giving you peace of mind while trading.
Minervini’s Trend-Template and the ‘Stage-Analysis’ of the Markets
This strategy is a so-called 'long-only' strategy. This means that we only take long positions, short positions are not considered.
The best market environment for such strategies are periods of stable upward trends in the so-called stage 2 - uptrend.
In stable upward trends, we increase our market exposure and risk.
In sideways markets and downward trends or bear markets, we reduce our exposure very quickly or go 100% to cash and wait for the markets to recover and improve. This allows us to avoid major losses and drawdowns.
This simple rule gives us a significant advantage over most undisciplined traders and amateurs!
'The Trend is your Friend'. This is a very old but true quote.
What's behind it???
• 98% of stocks made their biggest gains in a Phase 2 upward trend.
• If a stock is in a stable uptrend, this is evidence that larger institutions are buying the stock sustainably.
• By focusing on stocks that are in a stable uptrend, the chances of profit are significantly increased.
• In a stable uptrend, investors know exactly what to expect from further price developments. This makes it possible to locate low-risk entry points.
The goal is not to buy at the lowest price – the goal is to buy at the right price!
Each stock goes through the same maturity cycle – it starts at stage 1 and ends at stage 4
Stage 1 – Neglect Phase – Consolidation
Stage 2 – Progressive Phase – Accumulation
Stage 3 – Topping Phase – Distribution
Stage 4 – Downtrend – Capitulation
This strategy focuses on identifying stocks in confirmed stage 2 uptrends. This in itself gives us an advantage over long-term investors and less professional traders.
By focusing on stocks in a stage 2 uptrend, we avoid losses in downtrends (stage 4) or less profitable consolidation phases (stages 1 and 3). We are fully invested and put our money to work for us, and we are fully invested when stocks are in their stage 2 uptrends.
But how can we use technical chart analysis to find stocks that are in a stable stage 2 uptrend?
Mark Minervini has developed the so-called 'trend template' for this purpose. This is an essential part of our JS-TechTrading pullback strategy. For our watchlists, only those individual values that meet the tough requirements of Minervini's trend template are eligible.
The Trend Template
• 200d MA increasing over a period of at least 1 month, better 4-5 months or longer
• 150d MA above 200d MA
• 50d MA above 150d MA and 200d MA
• Course above 50d MA, 150d MA and 200d MA
• Ideally, the 50d MA is increasing over at least 1 month
• Price at least 25% above the 52w low
• Price within 25% of 52w high
• High relative strength according to IBD.
We have developed an algorythm (for TradingView) that uses Minervini’s trend template as a qualifier. This means that the strategy only generates trading signals in case the selected elements of the trend template are being met. The user is fully flexible to adjust the requirements of this Trend-Template qualifier:
This strategy is normally applied to the daily chart ideal for selecting individual stocks for trend-following strategies. Nevertheless, Minervini’s principles are timeless and this alogrithmic strategy with the Trend-Template qualifier can also be applied to any other timframe.
The qualifier #9 (RS-Ratings) can be modified and optimized in the strategy’s settings to fit your individual needs.
In general, it should be noted that ideally all 8/8 trend template criteria are met. Stocks or other securities that meet only some of these 8 criteria can also be very promising candidates for this strategy, provided that backtesting yields good results.
The Pullback Strategy
For the JS-TechTrading pullback strategy, only stocks and other financial instruments that meet the selected criteria of Mark Minervini's trend template are considered. If not, the strategy will not generate any signals.
Further prerequisites for generating a buy signal is that the individual value is in a short-term oversold state (RSI).
When the selling pressure is over and the continuation of the uptrend can be confirmed by the MACD after reaching a price low, a buy signal is issued by the pullback strategy.
Stop-loss limits and profit targets can be set variably.
Relative Strength Index (RSI)
The Relative Strength Index (RSI) is a technical indicator developed by Welles Wilder in 1978. The RSI is used to perform a market value analysis and identify the strength of a trend as well as overbought and oversold conditions. The indicator is calculated on a scale from 0 to 100 and shows how much an asset has risen or fallen relative to its own price in recent periods.
The RSI is calculated as the ratio of average profits to average losses over a certain period of time. A high value of the RSI indicates an overbought situation, while a low value indicates an oversold situation. Typically, a value > 70 is considered an overbought threshold and a value < 30 is considered an oversold threshold. A value above 70 signals that a single value may be overvalued and a decrease in price is likely , while a value below 30 signals that a single value may be undervalued and an increase in price is likely.
For example, let's say you're watching a stock XYZ. After a prolonged falling movement, the RSI value of this stock has fallen to 26. This means that the stock is oversold and that it is time for a potential recovery. Therefore, a trader might decide to buy this stock in the hope that it will rise again soon.
Moving Average Convergence Divergence (MACD)
The MACD (Moving Average Convergence Divergence) is a technical indicator used in both short-term and long-term trading strategies. The indicator was developed by Gerald Appel and is one of the most well-known indicators for the stock market.
The MACD consists of two lines calculated by the difference between two moving averages. The first line is a fast moving average that targets a short period of time. The second line is a slow moving average that targets a longer period of time. In addition, a trigger line is calculated, which consists of another moving average of the MACD line.
The MACD line is the difference between the fast and slow moving average.
The greater the difference between the two lines, the more likely a subsequent price increase. The lower the difference, the more likely a subsequent price drop is.
If the MACD line crosses upwards over the trigger line, this is a buy signal that signals a potential price increase. If the MACD line crosses down below the trigger line, this is a sell signal that signals a potential price weakening.
This strategy is applicable to all timeframes and the relevant parameters for the underlying indicators (RSI and MACD) can be adjusted and optimized as needed.
Backtesting
Backtesting give outstanding results on all timeframes and drawdowns can be reduced to a minimum level. Swing-Traders (daily charts) will see that the strategy does not give any buy signals during market corrections and bear markets.
Settings for backtesting are:
- Period from Jan 2000 until now
- Starting capital 100k USD
- Position size = 25% of equity
- 0.01% commission = USD 2.50.- per Trade
Other comments
• This strategy has been designed to identify the most promising, highest probability entries and trades for each stock or other financial security.
• The trend-template qualifier is highly selective and filters out the most promising swing-trading entries. As a result, you will normally only find a single-digit number of trades for each stock or other financial security per year in case you apply this strategy for the daily charts. Shorter timeframes will result in a higher number of trades / year.
• As a result, traders need to apply this strategy for a full watchlist rather than just one financial security.

{20}Dashboard RSI-trendlines_Pro[vn]👉 Here is a script of 20 trading pairs scanner with RSI trendline.
-On each chart of the trading pair, there is only 1 trendline pair that comes closest to the RSI: 1 uptrendline and 1 downtrend line.
-So when the statistics on the table also show the column of the uptrend and the column of the downtrend
-When the RSI approaches any trendline and the ratio is 10%, the trendline will be colored blue (downtrend) and red (uptrend).
-Column ✎ T.line-trendline above (✐ T.line-trendline below) is the value of the current trendline compared to RSI
-Column \𝖗𝖊𝖘𝖎𝖘𝖙𝖆𝖓(𝖘𝖚𝖕𝖕𝖔𝖗𝖙 \══════) when RSI breaks trendline will show 1|1|1 ( first candle) and percentage value when breaking through the point of the trendline. This is a good signal for us to consider trading with the RSI line
-The parameter when breaking shows 10|10|10, it means that the price has broken 10 candles (RSI candles), and the first 10 candles are colored yellow, then it will be
hidden. (can be changed in settings) put)
-Also, when displaying the parameters and yellow color of the box as above, the column next to it (above/below T.line) will show the percentage from when RSI broke that
point to the current price of the candle.
-The RSI column is the current of the candle and the 20:2 parameter is the RSI trendline length and to combine the same parameters with the "RSI - trendlines - div "
indicator.
-The time can be changed in the Resolution indicator setting to show multiple time arcs.
-The up arrow symbols represent the price breaking upwards, the down arrow showing the price breaking downwards
Thank you everyone for your interest and trust
-----------------------------------------------------------------------------
Vietnamese
👉 Đây là script về máy quét 20 cặp giao dịch với đường trendline của RSI .
-Trên mỗi biểu đồ của cặp giao dịch chỉ tồn tại duy nhất 1 cặp trendline đi sát nhất với RSI là: 1 trendline tăng và 1 trendline giảm
-Vì vậy khi thống kê trên bảng cũng hiển thị cột của trend tăng và cột của trend giảm
-Khi RSI tiến gần đến 1 đường trendline bất kì mà tỉ lệ còn 10% thì đường trendline đó tô màu xanh(trend giảm) ,màu đỏ(trend tăng)
-Cột ✎ T.line-đường trendline bên trên(✐ T.line-đường trendline bên dưới) là giá trị của đường trendline hiện tại so với RSI
-Cột ══════ \𝖗𝖊𝖘𝖎𝖘𝖙𝖆𝖓(𝖘𝖚𝖕𝖕𝖔𝖗𝖙 \══════) khi RSI phá vỡ trendline sẽ thể thiện 1|1|1 (tức là cây nến đầu tiên) và giá trị phần trăm khi phá qua điểm của trendline.Đây là tín hiệu tốt để ta xem xét giao dịch với đường RSI
-Thông số khi phá vỡ hiển thị 10|10|10 thì hiểu là giá đã phá vỡ 10 nến(nến RSI), và 10 nến đầu tiên được tô màu vàng ,sau đó sẽ bị ẩn.(có thể thay đổi trong cài đặt)
-Ngoài ra khi hiện thông số và màu vàng của ô như trên thì cột bên cạnh (above/below T.line) sẽ hiển thị được số phần trăm tính từ khi RSI phá vỡ điểm đó đến giá hiện tại của cây nến.
-Cột RSI là hiện tại của nến và thông số 20:2 là độ dài đường trendline RSI và để kết hợp cùng thông số với chỉ báo "RSI - trendlines - div "
-Có thể thay đổi thời gian trong cài đặt chỉ báo Resolution để hiển thị nhiều cung thời gian.
-Các biểu tượng mũi tên lên 🡹 thể hiện giá phá vỡ lên trên, mũi tên xuống 🡻 thể hiện giá đã phá vỡ xuống dưới
Cảm ơn mọi người đã quan tâm và tin dùng

RSI - trendlines - div[vn]This is an indicator for traders of trendline analysis with RSI (the formula for calculating RSI I don't mention here anymore because every trader knows it)
-
The Pine Script strategy plots pivot points and trendlines on the RSI chart.
This strategy allows the user to specify the interval for calculating the pivot points and the number of pivot points used to generate the RSI trendlines.
As all traders know, the RSI line closely follows the actual price line, it is an indicator of momentum, the RSI often tells us the direction of the price line in advance, it often precedes and goes along with the price.
RSI is one of the indicators that predicts price trends very well when it crosses its trendline (except in case of divergence).
On the chart of the RSI indicator, I only show 2 trendlines closest to the RSI (1 increase, 1 decrease) and the trend lines far away from me are hidden so that traders can focus on observing better.
When an uptrend line of RSI (or a decrease of RSI) is drawn according to the settings in the settings of the indicator, then that line is support and resistance so that we can proceed to make a BUY or SELL point according to the indicator. RSI support and resistance strategy
When the RSI line breaks above the definitive uptrend line or breaks below the trendline definitively, the price signals a reversal to the nearest trendline.
When the RSI breaks the downtrend line of the RSI (definitively), it signals that the price has a high probability of reversing or approaching the nearest resistance area or possibly reversing from bearish to bullish.
When the RSI breaks the uptrend line of the RSI (definitively), it signals that the price is likely to reverse or reach the nearest resistance area or it may reverse from bullish to bearish.
In addition, I have integrated the normal divergence function of RSI for traders to use in case of divergence - combined with trendline to identify trend reversal more clearly.
-------------------------------------------------------------------------------------------------------
Vietnamese
-Đây là chỉ báo dành cho các trader thuộc trường phái phân tích đường xu hướng với RSI(công thức tính RSI tôi không nhắc ở đây nữa vì mọi trader đều biết)
-Chiến lược Pine Script vẽ các điểm trục và đường xu hướng trên biểu đồ RSI.
-Chiến lược này cho phép người dùng chỉ định khoảng thời gian tính toán các điểm xoay và số điểm xoay được sử dụng để tạo các đường xu hướng của RSI.
-Như các Trader đều biết đường RSI bám sát thực tế với đường giá, nó là chỉ báo về động lượng ,RSI nhiều khi cho chúng ta "biết trước" được hướng đi của đường giá, nó thường đi trước và đi cùng với giá
-RSI là một trong những chỉ báo dự đoán xu hướng giá rất tốt khi cắt đường xu hướng của nó (chỉ trừ trường hợp phân kì)
-Trên biểu đồ của chỉ báo RSI tôi chỉ đưa ra 2 đường trendline gần với đường RSI nhất (1 tăng , 1 giảm)còn các đường xu hướng cách xa tôi đều để ẩn để các Trader tập chung quan sát tốt hơn
-Khi đường xu hướng tăng của RSI (hoặc giảm của RSI) được vẽ ra theo các thiết lập trong cài đặt của chỉ báo,thì đường đó là hỗ trợ,kháng cự để ta có thể tiến hành thực hiện điểm BUY hoặc SELL theo chiến lược hỗ trợ và kháng cự của RSI
-Khi đường RSI mà phá vỡ lên trên đường xu hướng tăng dứt khoát hoặc phá xuống dưới đường xu hướng cách dứt khoát thì giá báo hiệu sắp đảo chiều ngược với đường xu hướng gần nhất
-Khi RSI phá vỡ đường xu hướng giảm của RSI (cách dứt khoát) thì báo hiệu sắp tới giá có khả năng cao sẽ đảo chiều hay tiến tới vùng kháng cự gần nhất hay có thể đảo chiều từ giảm thành tăng
-Khi RSI phá vỡ đường xu hướng tăng của RSI (cách dứt khoát) thì báo hiệu sắp tới giá có khả năng cao sẽ đảo chiều hay tiến tới vùng kháng cự gần nhất hay có thể đảo chiều từ tăng thành giảm
-ngoài ra tôi có tích hợp thêm vào công cụ chức năng phân kì thường của RSI để trader dùng trong trường hợp phân kì - kết hợp với đường trendline để xác định xu hướng đảo chiều rõ ràng hơn

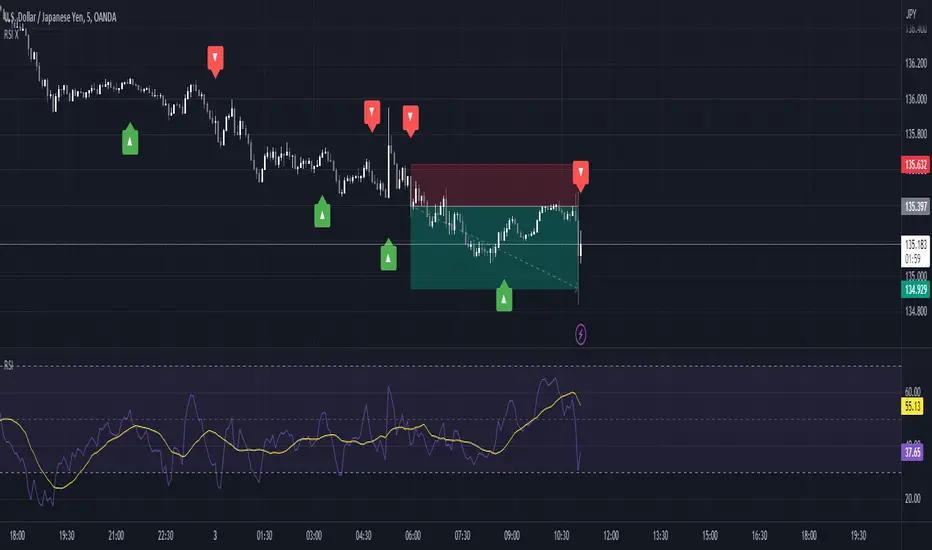
RSI Pull-BackA pull-back occurs whenever the price or the value of an indicator breaks a line and comes back to test it before continuing in the prevailing trend.
The RSI has oversold and overbought levels such as 20 and 80 and whenever the market breaks them returns to normality, we can await a pull-back to them before the reversal continues.
This indicator shows the following signals:
* A bullish signal is generated whenever the RSI surpasses the chosen oversold level then directly shapes a pull-back to it without breaking it again.
* A bearish signal is generated whenever the RSI breaks the chosen overbought level then directly shapes a pull-back to it without surpassing it again.
