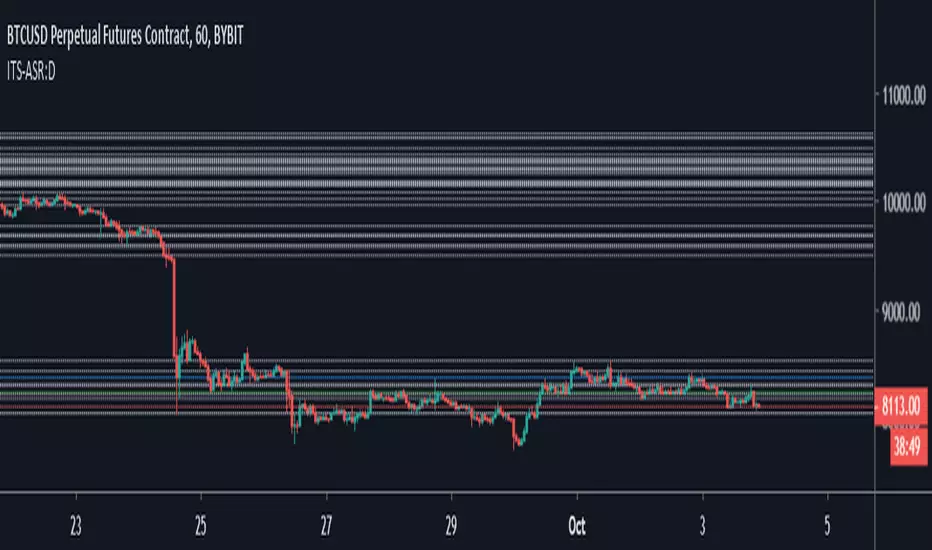
Iconik Trading Suite: Auto Support/Resistance - DailyAutogeneration of support and resistance lines. Posts a horizontal line of the open/close for the past 40 daily candles.
DM for a PowerPoint describing this indicator and the rest of Iconik in detail.
Iconik Trading Suite Indicator List:
ITS-OSC: Oscillators (v2)
ITS-PAA: Price Action Alerts (v2)
ITS-ASR: Auto Support/Resistance
-> Daily (v2)
-> 3 Day (v2)
-> Weekly (v2)
ITS-4TFC: 4 Time Frame Confirmation (v1)
ITS-DIV: Divergence Seeker (v1)
Resistances
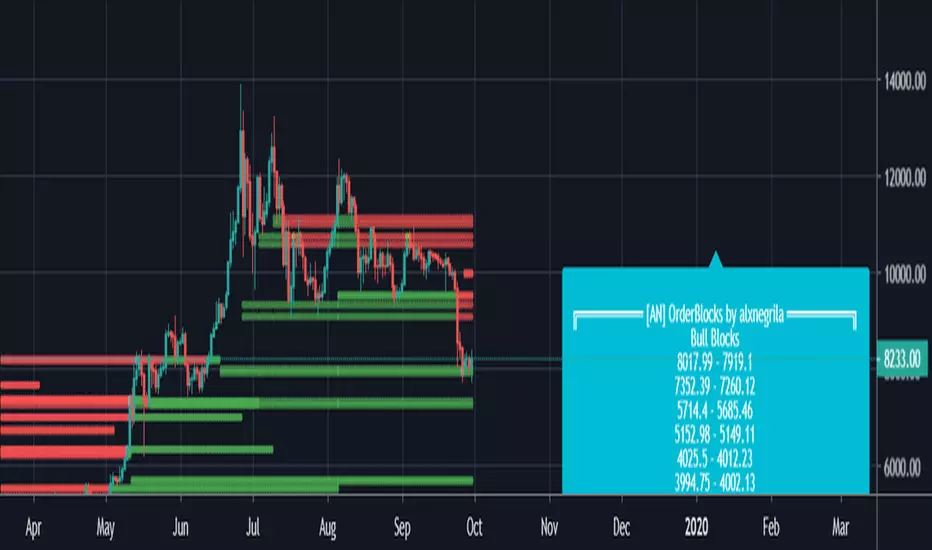
[AN] OrderBlocksEases the find of possible support and resistance areas.
The Orderblock finder allows overlaying blocks from another timeframe
Customizable strength of previous move and extended info pane.
Support/Resistance Zones x3Support and Resistance Levels + Zones for 3 time frames, based on volume at fractal levels with Zones based on wick size which is a true reflection of a Zone when compared to other S/R Zone scripts which only use a thick line not based on anything.
Original script is thanks to synapticex I have just migrated to version 3, heavily modified it and added Support and Resistance Zones.


[IE] Multiple price indicators + SCALPERDetect divergences in price and RSI + pivot points (with alert option). Credits to @Libertus for this, I only reproduced it and after that he pointed me to his work.
Has ChartVamp and EricChoe MAs with prediction.
Displays Support and Resistance areas
Detects momentum changes.
Custom scalper with alert option.

DYNAMIC SUP/RESDynamic Support / Resistance Indicator.
Dynamic volume based support/resistance levels.
Plots also4 EMA and 2 SMA.
Best used for scalping ranging price but can also help find trade entries for trending market.
White area represents current range. Red lines are Stop Loss levels based on range and Risk to Reward ratio which you can change in settings.
Trade Safe and DYOR!

DYNAMIC SUP/RES 1.0Dynamic Support / Resistance Indicator. Good for scalping ranging price action and detecting breakouts.
White area represents current range. Red lines are Stop Loss levels based on range and Risk to Reward ratio of choice.
Free to use for Cryptosurge discord members: discord.gg
Trade safe and DYOR.
