Profit Accumulator Support and ResistanceHi Everyone
Thought I'd share this support and resistance script.
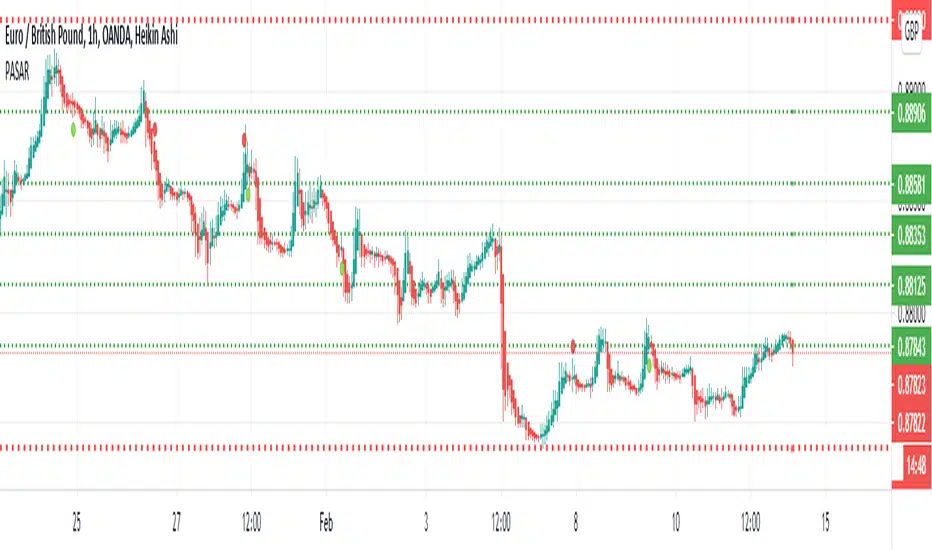
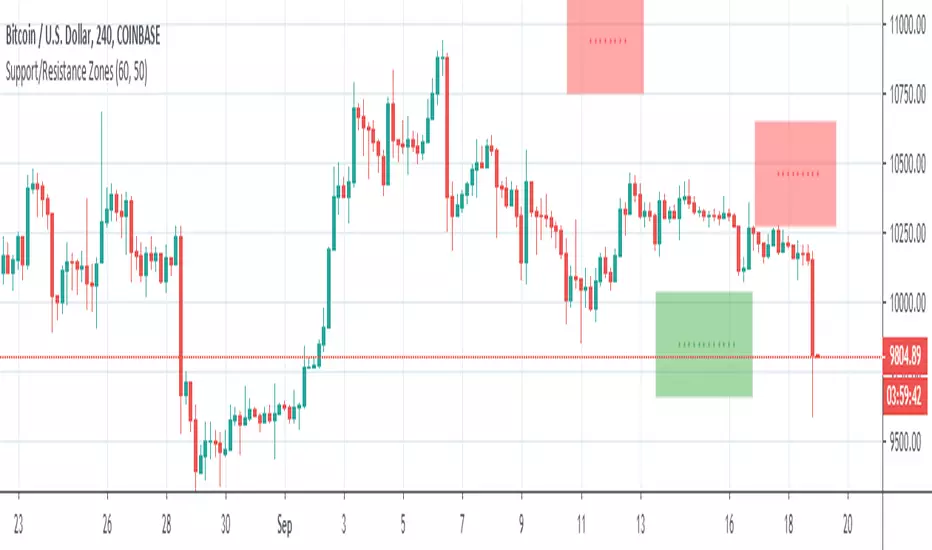
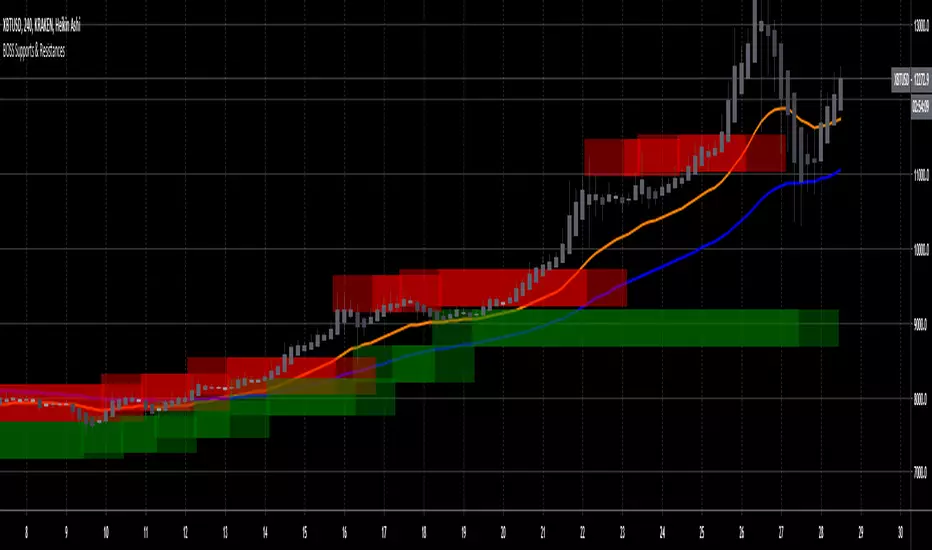
This has two settings on it which are resolution (timeframe) and the number of bars back to look. The default setting is 1 Week and 2 bars which is the one I like using the most.
The highest high and lowest low are indicated by the thicker red lines on the chart.
Enjoy using this.
Cheers
Mike
Indicador Pine Script®