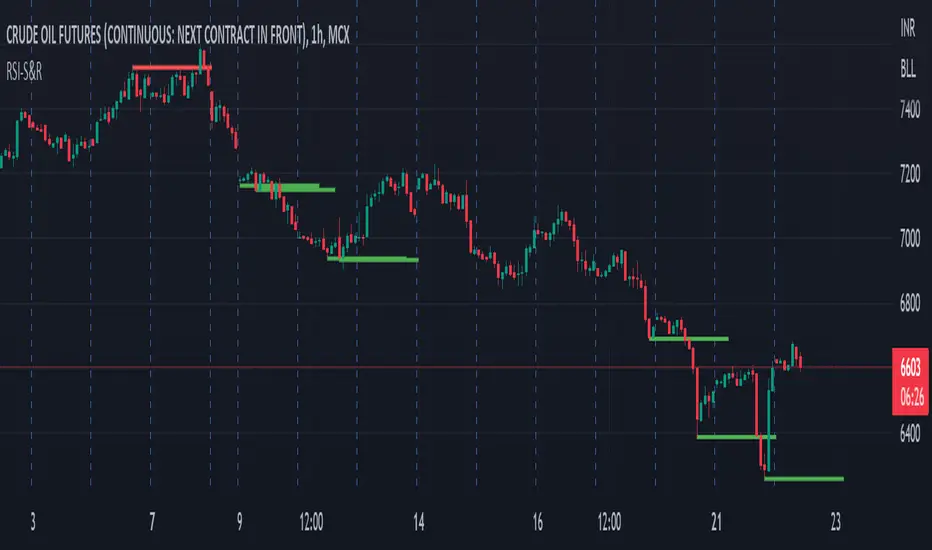
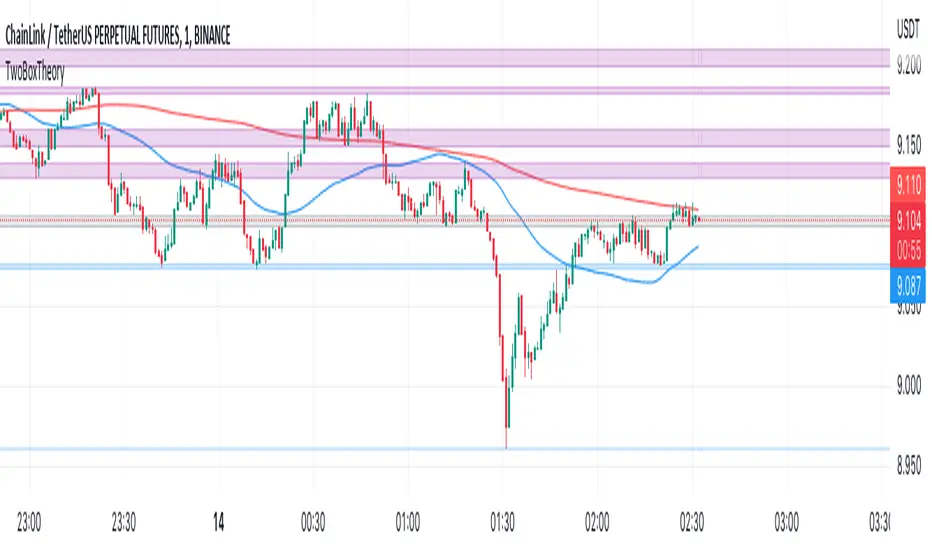
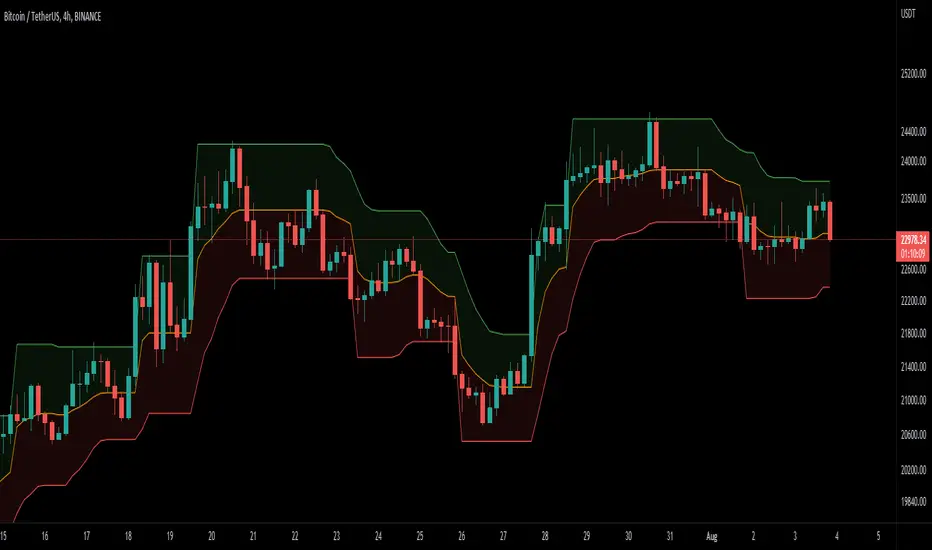
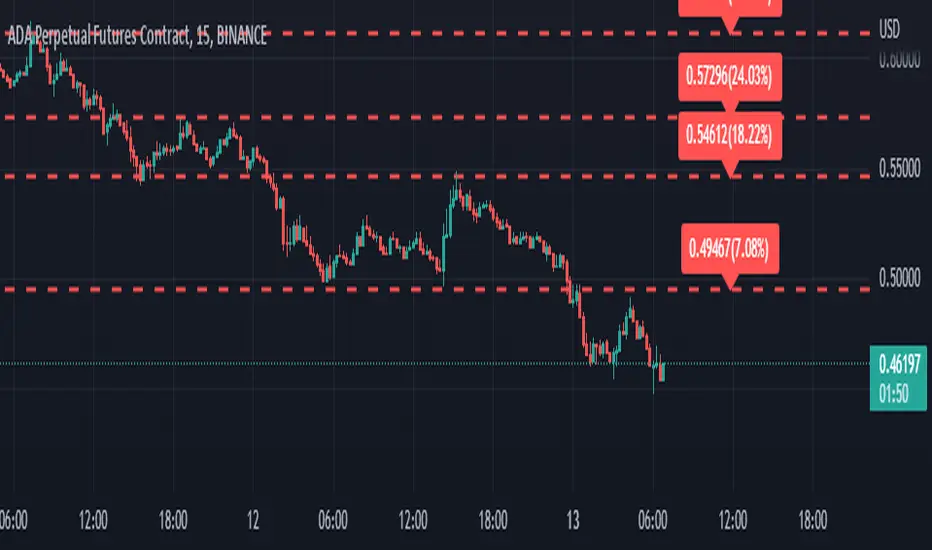
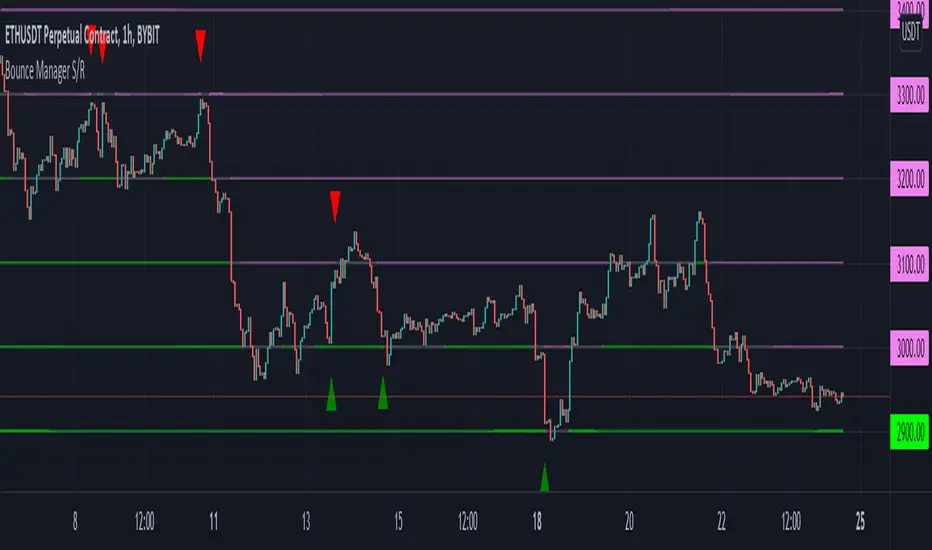
DEMA Supertrend Bands [Misu]█ Indicator based on DEMA (Double Exponential Moving Average) & Supertrend to show Bands .
DEMA attempts to remove the inherent lag associated with Moving Averages by placing more weight on recent values.
Supertrend aims to detect price trends, it's also used to set protective stops.
█ Usages:
Combining Dema to calculate Supertrend results in nice lower and upper bands.
This can be used to identify potential supports and resistances and set protective stops.
█ Parameters:
Length DEMA: Double Ema lenght used to calculate DEMA. Dema is used by Supertrend indicator.
Length Atr: Atr lenght used to calculate Atr. Atr is used by Supertrend indicator.
Band Mult: Used to calculate Supertrend Bands width.
█ Other Applications:
The mid band can be used to filter bad signals in the manner of a more classical Moving Average.
Resistance_level
Trendlines Boll Ichi S1 by GammaprodI. How to use this indicator :
------------------------------
I.1. Set your teadingview theme to dark theme.
I.2. Gammaprod indicator is valid for forex, stock and but more valid for crypto.
I.3. Use three timeframe for more validation (choose between those, that fit to your trading style) :
- Timeframe 1m, 5m, and 15m for Scalping
- Timeframe 30m, 1h and 4h for Intraday
- Timeframe 4h, 1D and 1W for Swing Trading
I.4 Always use THREE INDICATORS FROM GAMMAPROD, those three indicators is back to back each other, by the way, I only made those three indicators only (for now) :
- Trendlines Boll Ichi S1 by Gammaprod
- MACD Volume S2 by Gammaprod
- Stoch RSI Divs Zone S2 by Gammaprod
============================================================================
II. How to setting :
--------------------
II.1. Trendlines Boll Ichi Crypto by Gammaprod
II.1.A. Support and Resistance
- Well if you familiar with this indicator you can add it, but recommended for Timeframe 30m or more
II.1.B. Trendlines Primary or Trendlines Secondary
- Timeframe 1m you DON'T NEED Trendlines Primary or Trendlines Secondary
- Timeframe 5m you DON'T NEED Trendlines Secondary, but you CAN ADD Trendlines Primary if you fell it helpful (for me, it is helpful to find where the candles start or the end trend or a consolidation or where the candles will surpass a resistance or a support).
- Timeframe 15m you DON'T NEED Trendlines Secondary, DEFENITELY add Trendlines Primary it will help to find where the candles stop or a consolidation or where the candles will surpass a resistance or a support).
- Timeframe 30m or more, DEFENITELY NEED BOTH Trendlines Primary and Secondary Trendlines, it will help to find where the candle stop or consolidation or where the candle will surpass a resistance or support).
II.1.C. Bollinger, Ichimoku Cloud and Lagging Span
- Please DON'T CHANGE IT at all, it's really helpful to know when and where to make an entry decesion or a trend or a consolidation, if you don't understand how to read it, you better to learn it first (on "how to read" section and "How to OPEN position" the section below)
II.2. Stoch RSI Divs Zone Crypto by Gammaprod (DON'T CHANGE IT)
II.3. MACD Volume Crypto by Gammaprod (DON'T CHANGE IT)
============================================================================
III. How to read :
------------------
III.1. Sell or Buy Priority :
III.1.A. Sell Priority
- Color background on macd and stoch rsi is pink or purple sell is the priority, (if you're not sure to buy, just wait until the best moment to sell)
III.1.B. Buy Priority
- Color background on macd and stoch rsi Teal or light green buy is the priority, (if you're not sure to sell, just wait until the best moment to buy)
III.1.C. Indecision / Golden Moment
- Color background on stoch rsi yellow is indecision / golden moment of reversal pattern (wait until it formed background only on Stoch RSI), please be careful at this moment.
III.2. Trend / Consolidation :
III.2.A. BULLISH trend
- When Stoch RSI and MACD have teal or light green background that's means BULLISH trend, better to confirm by the candle is above green cloud and lagging span (red line) is also above the candle.
III.2.B. BEARISH trend
- When Stoch RSI and MACD have the Pink or purple background that's means BEARISH trend, better to confirm by the candle is above purple cloud and lagging span (red line) is also below the candle.
III.2.C. CONSOLIDATION
- When Stoch RSI have the mix background that's means CONSOLIDATION, better to confirm by the candle is in or near to green / purple cloud and lagging span (red line) is also on the candle.
III.3. Special Mark
III.3.A. Ideal Bullish :
- Near line 20 and green / teal background = When Stoch RSI have the char R / H on lime color label, that's means divergence or hidden divergence for buy position, if you not see this label that's means just a standard confirmation for buy
III.3.B. Not an Ideal Bullish :
- Near line 80 and green / teal background = if this happens make sure you know what happen, it could be a false signal or bullish continual pattern
III.3.C. Ideal Bearish :
- Near line 80 and pink / purple background = When Stoch RSI have the char R / H on lime color label, that's means divergence or hidden divergence for buy position, if you not see this label that's means just a standard confirmation for sell position.
III.3.D. Not an Ideal Bearish:
- Near line 20 and pink / purple background = if this happens make sure you know what happen, it could be a false signal or bearish continual pattern
III.3.E. The Beginning of Reversal (from BEARISH to BULLISH) :
- When Stoch RSI line shaping GREEN position is near 20.
- MACD lines still PINK, position lines is UNDER the HISTOGRAM, but the HISTOGRAM start to SHAPE FALL PINK (light pink) and the BACKGROUND still PINK / PURPLE.
- Position CANDLES NEAR BLUE line, NEAR PURPLE CLOUD, and lagging span (red line) STILL ON the area candle. (it used to be confirmed with the golden moment).
III.3.F. The Beginning of Reversal (from BULLISH to BEARISH) :
- When Stoch RSI line shaping PINK position is near 80.
- MACD lines still GREEN, position lines is ABOVE the HISTOGRAM, but the HISTOGRAM start to SHAPE FALL GREEN (light green) and the BACKGROUND still TEAL / GREEN.
- Position CANDLES NEAR WHITE line, NEAR TEAL CLOUD, and lagging span (red line) STILL ON the area candle. (it used to be confirmed with the golden moment).
III.3.G. False Signals, or It could be a Golden Moment (better to see it on TF 15 or bigger):
- Near line 20 or 80 and yellow background = When Stoch RSI have the char R / H on color label, that's means divergence or hidden divergence for buy / sell position, if you not see this label that's means just a standard confirmation for buy / sell depends on where the Stoch RSI line if near 20 that's means buy, near 80 means sell
============================================================================
IV. How to OPEN position:
-------------------------
IV.1. Bullish
IV.1.A. Trendlines Boll Ichi S1 by Gammaprod
- The candles above the green cloud.
- Lagging span (red line) above the candles.
- then open buy near yellow line (the first option) / blue line (the second option) (always confirm the position with two other indicators below).
IV.1.B. MACD Volume S2 by Gammaprod
- Teal or Green background.
- The lines is shaped or shaping green.
- Better if at the green histogram.
IV.1.C. Stoch RSI Divs Zone S3 by Gammaprod
- Teal or Green background.
- The lines is shaping green.
- Better if on the bottom (at a range 20).
IV.2. Bearish
IV.2.A. Trendlines Boll Ichi S1 by Gammaprod
- The candles below the purple cloud.
- Lagging span (red line) below the candles.
- then open buy near yellow line (the first option) / white line (the second option) (always confirm the position with two other indicators below).
IV.2.B. MACD Volume S2 by Gammaprod
- Pink or purple background.
- The lines are shaped or shaping green.
- Better if at the pink histogram.
IV.2.C. Stoch RSI Divs Zone S3 by Gammaprod
- Pink or purple background.
- The lines are shaping pink.
- Better if the line on the top (at a range 80).
IV.3. Consolidation
IV.3.A. Trendlines Boll Ichi S1 by Gammaprod
- The candles on the cloud (green or purple).
- Lagging span (red line) on the candles.
- then open buy near the white or blue line (always confirm the position with two other indicators below).
IV.3.B. MACD Volume S2 by Gammaprod
- Changing the background.
- The line is near the middle line.
- Have small Histogram.
IV.3.C. Stoch RSI Divs Zone S3 by Gammaprod
- Mix background specially on a timeframe 15m or more.
- The line move fast up and down.
- Better if on the bottom or the top of the lines (at a range 20 or 80).
============================================================================
>> The secret ingredient is comparing the timeframe :
The example scalping (Timeframe 1m, 5m and 15m)
- TF 1m is for making an open position.
- TF 5m is for making a judgement of the trend market.
- TF 15m is to confirm that judgement from TF 5m, be careful if it not similar then it used to be a consolidation or the beginning of the reversal.
There's a lot a way to open the position than above information that i gave it to you, but consider there are a limit chars on this column, I hope it will help your trading and make a more profit on it.
Support & Resistance[VTA]Description:
This indicator uses pivot points to draw support and resistance for you in different timeframes.
It also shows you the decrease in the increase of the currency compared to the resistance and support line, and you can see the end of the failures by the label.
Manufacturer:
This indicator was designed and developed by the VTA team.
Resistance/Support Indicator - FontiramisuIndicator showing resistances and support, based on pivots location
When a new pivot location is near from a resistance/support the latter gains weight.
You can modify multiple parameters :
Nb Max res/sup : Define the number max res/sup to keep in our res/sup history array. The greater it is the older bar index will be taken.
Nb show res/sup : Define the number of res/sup to be drawn.
Min weight shown : Define min res/sup weight to be shown. Weight is used to measure strengh of res/sup.
% range stack : Define price percentage change required to stack a pivot into an existing res/sup. Default is 0.015 = 1.5%.
Pivots are calculated with deviation parameter to validate with more precision.
Fontilab Library is used to code this indicator.
Support and Resistance Multi Time frameSimple indicator showing the support and resistance on Daily, Weekly and Monthly time frames no matter what time frame you're currently on by highlighting the highest and lowest points on each over the last 34 bars.
Daily support and resistance are coloured green.
support and resistance are coloured yellow.
Monthly support and resistance are coloured red.
For best results check where multiple support and resistance areas line up and combine with another indicator for example oscillators to gauge if the support or resistance will reverse the market.
Trend Indicator (dow trending) - FontiramisuIndicator showing pivots and interpret a trend out of it.
Pivots are calculating with deviation parameter to validate with more precision.
Trending moves are calculated according to Dow Theory :
In an uptrend, if the price made a new high, the price must make a new high to confirm the trend, otherwise, it might signal a possible change in the trend.
In an uptrend, if the price made a new low, the price must make a new low to confirm the trend, otherwise, it might signal a possible change in the trend.
The indicator can show 2 trends with 2 different "Pivot Depth"
See indicator parameters.
Tab is display at the bottom right corner to show trend direction and if it is hesitating
Fontilab Library is used to code this indicator
Bounce Manager S/RThis script is based on the bounce manager ATR script
The S/R script is made for manual input of horizontal S/R lines, the script will then see if price respects these levels by the parameters you input in settings panel. On a respectable bounce it will print buy/sell arrows. The script also has functionality to send alerts, this is helpful if you want to automate S/R lines.
An easy strategy to use would be the one you see in the preview using a grid of round numbers. This script in no way shape or form promises easy gains and like all algorithms should be forward tested on a paper trading account before using real money.
components:
- Max violation: When price moves past this the script will no longer look for entry until a new trend has been established. The line can also be used as a stop loss.
- Confirmation line: When price touches the line during a trend it
will wait to cross over this line to confirm a reaction from the line.
- Min past distance: A trend filtering system, this is a distance from
the line price has to break to confirm trend direction.
- Stop loss: This can be set to a percentage distance from the low after
bounce. Or it can be set to the max violation line
- Take profit: This can be a fixed take profit target or a risk to reward
based take profit. With risk to reward it will multiply the stop loss
distance by the input and use that to create target (green cross)
- ATR based or % based: there are 2 versions of the script, one for strict
percentage based logic and another one based on ATR values
Part of the Honest Algo service.
MTF S/R + PVSRAA simple tool to find Support and Resistance.
List of features:
-MTF Support and Resistance
-VWAP
-PVSRA Candles
Usage instructions:
There are 4 boxes, each individual box can be assigned a separate time. The lookback period setting is used to specify the number of candles that you want to look back.
The highesthigh and the lowestlow are now displayed as the support and resistance line of the respective lookback period.
In addition to the support and resistance lines, fibonacci levels are calculated from top to bottom (resistance) and from bottom to top (support). These levels can be switched on and off using the "Fibb Level" button.
PVSRA candle colors meaning:
Green (bull) and red (bear): Candles with volume >= 200% of the average volume of the 10 previous chart candles, and candles where the product of candle spread x candle volume is >= the highest for the 10 previous chart time candles.
Blue (bull) and blue-violet (bear): Candles with volume >= 150% of the average volume of the 10 previous chart candles
The PVSRA can be turned on and off using the "Vector Candle" button.
PVSRA "vector"/"climax" candles
example for the Fibb LvL
Support and ResistanceOur Indicator “Support and Resistance” offers an insight into the structure of any given Instrument applied to. Understanding Support and Resistance is essential for using this Indicator. If you are familiar with the concept, then you will most likely find this indicator useful in your trading. If you are unfamiliar with the concept and are interested then continue reading a “Brief Concept of Support and Resistance” at the end of the description, where we will provide some informational Links.
This description will provide a High Level description of how our Indicator identifies and visualizes Support and Resistance, followed by how to use the Indicator in your trading. At the end we would like to introduce our team and experience.
High Level Description of “Support and Resistance”:
Our indicator searches for prices where the current Instrument has experienced a significant pivot point in the recent relative past. Our indicator identifies relevant Highs and Lows, and clusters theses pivots into levels.
Visualization:
What do the Lines mean:
Our Indicator visualizes Support and Resistance Levels with a dash Line. All the Support and Resistance displayed is a snapshot of the current Levels Identified. As price evolves the Support and Resistance levels evolve.
Important:
All Zones will REPAINTED. As previously mentioned, all levels are a snapshot of the current state. To view a history of Support and Resistance development please use the Replay function.
How to use it:
Approaching a Support and Resistance level:
When price is approaching a Support/Resistance Level, look for reversal patterns you are familiar with.
When price has penetrated/broke a Support/Resistance Level significantly, look for a retest and reversal structure at the level.
It is important that you have a tested method behind your entry and exit strategy. Please note, that the indicator itself just presents price areas where there is a potential for a price reversal, and that these levels should not be traded blindly.
Time frame:
This indicator is programmed to be used on all Timeframes.
Instruments:
This indicator aims to visualize areas of where Market price has the potential to reversal, hence this is a mean reverting Indicator.
Taking this statement to account, it is recommended to apply this Indicator to Instruments with a mean reverting character.
Examples of mean reverting markets could be for example …
...all FOREX instruments, as FOREX is considered a mean reverting Market.
...an instrument that is in a consolidation, or which you are expecting to enter a period of consolidation.
Indicator settings and configuration:
Please view “Tooltips” in the configuration for detailed setting information.
Brief concept of Support and Resistance:
Support and Resistance is a concept that has been around for a very long time. Following links are helpful to get a grasp of the concept:
en.wikipedia.org
www.investopedia.com
Our Team:
We are a team of 3 Traders with a combined experience of 40 years. We are using our experiences from the market to create Indicators to Visualize the most relevant Patterns to us in our trading today. Our goal is to reconstruct these patterns to match our understanding of the market and to simplify the process of creating reproducible trading Strategies.
Support Resistance Zones using confluence & Std. DeviationOverview:
This indicator takes (interactive) input from the user for support and resistance levels and plots important zones considering the other confluence levels in the indicator.
Working of indicator:
This indicator takes six input of Support/resistance level form the user
It has following 32 confluence levels
a.4 Recent positive Divergence levels (DN1, DN2, DN3, DN4)
b.4 recent negative divergence levels (DP1, DP2, DP3, DP4)
d.5 Fibonacci levels (Fib0, Fib236, Fib5, Fib618, Fib786)
e. 7 Pivot levels (P, PR1, PR2, PR3, PS1, PS2, PS3)
f.4 EMAs (E20, E200, E100, E50)
g. ATH, ATL, Weekly High, Weekly Low, two days ago high, two days ago low, previous day high , previous day low
The code checks nearest ‘n’ CONFLUENCE for each level (“Number of confluences to check”) in the indicator, after getting the nearest confluence it calculates the standard deviation of those levels WITH RESPECT TO THE MANUAL INPUT LEVELS.
If the Std. Deviation is less than the input value (“Minimum standard deviation” option) then the zone is displayed on the chart.
How to use:
Add the indicator on the chart select your important support and resistance levels.
Set standard deviation, if the confluence is less than the input standard deviation then you will see those zones on the chart.
You can display all divergence levels; you can display all fib levels. All confluences can be displayed by using the setting of the indicator
How to read the indicator values:
The zone will show all the confluence it has in its zone,
Example:
Table details:
The table shows the maximum and minimum deviation out of all six levels .To see at least one zone you have to make sure that Input value Std. Deviation must be greater than Min Std. Deviation of the table
Sources & refences :
Big thank to www.pinecoders.com and kodify.net
Standard deviation :
www.investopedia.com
function to find 'k' closest elements :
www.techiedelight.com
Interactive support resistance :
Divergence for many indicators:
Auto fib level by DGT:
www.tradingview.com
[AB] Support/Resistance Drawing ToolThis script is designed to help you identify viable support and resistance levels by automatically creating lines that become less transparent when said levels hold. It is based on Donchian Channels created by rounded closes, not by highs and lows. You can use it as an aid to draw your levels manually, or stick exclusively to automatic charting.
Available settings are as follows:
Source - highly recommended to use Close, but other options are available if you'd like to do some experimentation.
Source Rounding - the accuracy of price sampling; higher rounding will make your lines more visible at the expense of precision. It is highly recommended to use decimals.
Length (Array) - the overall lookback of the script (length of the array). This value shouldn't be higher than 500 if skip = 2, or 250 if skip = 1. If you'd like to reach further back into the past, I'd recommend switching timeframes instead of increasing this beyond 500.
Sampling Skip - how frequently the data is sampled. I wouldn't recommend going beyond 2, especially with the default settings.
Transparency Skip - you can think of it as "pencil hardness". The higher the skip, the bigger the imprint of a single level detection will be. Wouldn't recommend going beyond 10.
Color R, G, and B - you can use these settings to adjust the color of the lines.
Eliza's S&R FrameThe frame has been put together to show greatly enhanced accuracy of support and resistance. Forget using open, high, low, close data for your S&R. This frame is built off e = 2.71828 and its multiples. The particularly important levels are yellow instead of blue and are to be given more attention when price is between a blue and yellow. Look for institutional candles which will open above and close below the level and vice versa. Look for trends which turn away just before the level on the retrace as this will get you laser accurate entries. Once a level breaks even by the tiniest bit assume it is no longer valid and price will now be caught in the range between the higher and lower levels it hasn't broken yet. Use with 1 minute chart as I do for greatest chance of success.
Bitcoin Daily Support/ResistanceA new indicator for tradingview.
Indicator Overview
The 2-Year MA Multiplier is intended to be used as a long term investment tool.
It highlights periods where buying or selling Bitcoin during those times would have produced outsized returns.
To do this, it uses a moving average (MA) line, the 2yr MA, and also a multiplication of that moving average line, 2yr MA x5.
Note: the x5 multiplication is of the price values of the 2yr moving average, not of its time period.
Buying Bitcoin when price drops below the 2yr MA (green line) has historically generated outsized returns. Selling Bitcoin when price goes above the 2yr MA x 5 (red line) has been historically effective for taking profit.
Why This Happens
As Bitcoin is adopted, it moves through market cycles. These are created by periods where market participants are over-excited causing the price to over-extend, and periods where they are overly pessimistic where the price over-contracts. Identifying and understanding these periods can be beneficial to the long term investor.
This tool is a simple and effective way to highlight those periods
MA 50/100/150 was historically good support and resistance. When we cross them we have a new trend that is established.
[PX] Pivot ZonesHello everyone,
I was having some fun with the new gradient function, arrays and pivots. Decided that i would publish my little playground :)
This script basically draws lines or zones for detected pivot high and lows and counts the number of candles those levels have been untested.
Tested levels will stop at the candle, which breaks them.
How does it work?
- Define the number of candles that make up the pivot point with the "Pivot Left" and "Pivot Right" parameter (I took more extreme values to showcase the indicator).
- Select your "Layout Type": This can be either a line at the pivot point, a zone between the pivot point and its body or the average of the two.
- You can in-/decrease the number of lines with the "Number of Lines/Zones" parameter.
The older a line becomes the more it will lose of its original transparency.
Hope that might be useful to some of you :)
Please click the "Like"-button and follow me for future open-source script publications.
If you are looking for help with your custom PineScript development, don't hesitate to contact me directly here on Tradingview or through the link in my signature :)
Dynamic Support And Resistance [CC]The Dynamic Support And Resistance Indicator was created by Mike Siroky (Stocks and Commodities pgs 14-18) and this is a handy indicator that will show you useful support and resistance levels no matter how the stock is doing right now. I have color coded the middle line to show buy and sell signals so buy when the line turns green and sell when it turns red.
Let me know if there are any other indicators you want me to publish!
Projected Support And Resistance [CC]Projected Support And Resistance is a custom indicator of mine loosely based on the work done by Ketan Asher (Stocks and Commodities Bonus Issue 2021 pgs 12-14) and generally speaking this does a pretty good job of telling you what the future behavior of the stock will be. As the lines widen apart, there will be either upward or downward momentum. Buy when the line turns green and sell when it turns red.
Let me know what other indicators you would like to see me publish!
[RickAtw] O1 Opening Market LineThis indicator helps to identify current support and resistance based on the opening of the Asian, London and New York sessions.
Function
You can make good trade entries based on these lines. Shows daily and weekly openings of each session
It will also help you to look at which session you are currently trading)
Purple ----> Asian session
Red ----> London session
Blue ----> New York session
Key Signal
buy ---> A strong buy signal is a bounce from the low and the presence of a weekly or day open line.
sell ---> A strong sell signal is a bounce from the maximum and the presence of a weekly or day open line.
P.S. Be sure to test on your pair!
Remarks
This will help you determine the approximate area of support and resistance.
Since we cannot look into the future, it does not inform you about the exact records, but a possible change in trends.
Readme
In real life, I am a professional investor. And I check each of my indicators on my portfolio and how effective it is. I will not post a non-working method. The main thing is to wait for the beginning of trends and make money!
I would be grateful if you subscribe ❤️
Profit Accumulator Support and ResistanceHi Everyone
Thought I'd share this support and resistance script.
This has two settings on it which are resolution (timeframe) and the number of bars back to look. The default setting is 1 Week and 2 bars which is the one I like using the most.
The highest high and lowest low are indicated by the thicker red lines on the chart.
Enjoy using this.
Cheers
Mike
Breach v3 BetaThis is a script that allows you to toggle multiple indicators related to support and resistance, CCI, and Breaches (Crossovers based on William's Fractals).
How to use:
Custom Timeframe (Minutes) - To compare to current candles
Crossovers on custom - Crossovers and breaches on custom timeframe (Blue Triangle up)
Crossunders on custom - Crossunders and breaches on custom timeframe (Blue Triangle down)
Crossovers on current candles - Crossovers and breaches on current timeframe/Candlestick (Purple Triangle up)
Crossunder on current candles - Crossunders and breaches on current timeframe/Candlestick (Purple Triangle down)
CCI - CCI Trend indicator (red/green dots)
CCI - window - Input CCI window size in candlesticks (Integer)
Resistance on current candles - Resistance on current candles (Green Line)
Support on current candles - Support on current candles (Red Line)
Resistance - Custom - Resistance line based on Custom Timeframe (Blue Line)
Support - Custom - Support line based on Custom Timeframe (Purple Line)
Price on current support/resistance - Label displaying the price of current (candlestick) support/resistance
Price on custom support/resistance - Label displaying the price of custom (Custom Timeframe) support/resistance
Moving Averages as Support Resistance MTFHello Traders!
As most of you know that Moving Averages with the lengths 50, 100, 150 and 200 are very important. We should use these this moving averages to figure out S/R levels, the possible reversals points, trend direction etc. we should check these moving averages on Higher Time Frames as well. for example if you look at the chart with 5mins time frame, you should also check it in 1hour and 4hour time frames to see to big picture and main trend. this is important as trend is your friend and you should not take positions against the trend.
I developed this script to show them clearly and make the chart understandable. 1 resistance line above the price and 1 support line below the price, it shows the moving average type, length, time frame and S/R level.
You have option to show SMA or EMA and to include/exclude current time frame, because you may want to see only MAs from higher time frames. you should set higher time frames accordingly.
if you add all moving averages for current and higher time frame the chart looks very crowded as following example:
The script makes it clear to understand the chart better, here an example:
It can show when S/R was broken and you get alert. here an example:
You have coloring and style options, you can change line style and colors as you wish:
Enjoy!
Silen's Pseudo VPVR / Pseudo Volume Profile Custom RangeDisclamer: This indicator does not use actual Volume data and doesn't display any Volume data. It creates a pseudo Volume Profile by counting the high-low-2 values of candles and simulates something that is similar to a Volume Profile without using any Volume data.
Core facts:
Creates a pseudo Volume Profile by counting values of candles and sorting them into a Profile.
Works for charts that don't provide any Volume Information.
Can display up to 5 different Value Levels.
Value level colors are (from largest to smallest level): Red, Orange, Yellow, Green, Blue.
The Value levels can be used as Support and Resistance indicators.
The Custom Range of the Volume Profile can be adjusted from 10 to 1500 bars.
Much faster than the other custom pseudo VPVRs out there.
Shortcomings:
As the chart progresses with bars the line positions will distort to the left side. Refreshing the tradingview page or switching to another time interval fixes this. I might fix this issue in the future.
Does not use actual Volume nor display actual Volume.
Note: For those who wondered what happened to my first version of this indicator: It got taken down by Tradingview because it was misleading as to using the words "Volume Profile" and "Visible Range". I fully support their decision and I hope I could clear any misunderstandings! Give their team a heads up for the hard work they're doing in keeping this place clean and well organized!
Enjoy! :)
[PX] External LevelHello everyone,
today I'd like to share a script, which enables you to use external logic to plot levels on your chart.
How does it work?
The concept is based on two scripts. One script, which uses an external input as a trigger to print a new level and one script that calculates an output, which will be fetched.
Sounds complicated? It really is not! Let's take a closer look.
// This source code is subject to the terms of the Mozilla Public License 2.0 at mozilla.org
// © paaax
//@version=4
study("RSI OS/OB")
l = input(14, "RSI Length")
ob = input(70, "Overbought")
os = input(30, "Oversold")
r = rsi(close, l)
hline(ob)
hline(os)
plot(r, "RSI", color=color.orange)
// The following plot produces an output, which will be fetched the "External Level"-script.
// It evaluates to one of the following three values: 1.0, -1.0 or 0.0
plot(crossover(r, ob) ? 1.0 : crossunder(r, os) ? -1.0 : 0.0, "Output", transp=100)
The example script above uses an RSI and two threshold levels (70 and 30). The logic here is, that whenever the RSI is crossing down the lower threshold or crossing up the upper threshold we'd consider the current movement to be either oversold or overbought. Therefore, it's a point of interest, which we could visualize with a level.
The script creates an output when the crossover or crossunder of a threshold happens. A crossover would result in a value of 1.0, a crossunder in a value of -1.0. In all other cases the value would be 0.0.
The output of the RSI script would then be used as an input of the External Level script, which has a "Source"-parameter in its input-section. If the fetched input shows 1.0, then the script prints a resistance level. If it shows -1.0 a support level will be printed. And that's basically it. A very simple approach to print levels on your chart with an infinite number of use cases.
For example, you could use fetch outputs from a MACD script, MA script, outputs based on volume or price movement. Just remember the output has to evaluate to either 1.0 or -1.0 and has to be selected in the input-section.
Hope that might be useful to some of you :)
Please click the "Like"-button and follow me for future open-source script publications.
If you are looking for help with your custom PineScript development, don't hesitate to contact me directly here on Tradingview or through the link in my signature :)
gannoddsquare levels from DAY high lowGann Square of 9
Odd square to odd square
Start is auto chosen based upon :
day_close greater than day_open
then start equals day_low
or
day_close less than day_open
then start equals to day_high
Gap == 4 then distance is odd to odd square, Example = 121 -169 , 169-225,...
If Gap is increased to 8 then distance will be double the odd square, Example = 121 -225, 225-289,...,
- 1 odd square distance has been filled with purple background
- total 16 targets
-Any doubt feel free to ask.
K2 SR v2This indicator is used to automatically plot the strongest support and resistance points that are nearest to the current price.
This indicator works on all assets and all time frames so it is applicable to all traders whether you are a scalper, intraday or swing trader.
Additionally, you can adjust the settings to have the indicator scan for closer or farther support and resistance points to tailor specifically to your trading strategy.
This indicator was updated to include previous support and resistance price points with the addition of the option to enable zones including the wicked areas.
Use the link below to obtain access to this indicator.