Algo Trading Strategy (Nifty & BankNifty)What is Algo Trading Strategy ( Nifty & Bank Nifty )?
There are many 9 to 5 working professionals who have some spare money to invest each month but they can not do active trading because they are busy with their full time job.
So they wish to have an automated system which could take and close trades for them with a proven back-tested strategy, proper money management, ability to trade within particular timings, pre-defined maximum loss they can bear and so on.
To cater needs of such type of traders, we created from scratch; and published an 'AutoTrading Algo (Nifty & Bank Nifty) in Sep 2021. (The link is given below, please read on).
Many people who want to try this AutoTrading Algo want us to share stats of this algo with them.
In order to fulfil this demand, we have converted that "Algo Trading" Study into a Strategy whose description you are reading right now.
For all other queries related to how our "Algo Trading (Nifty & Bank Nifty)" works, what are its limitations, benefits and other features, please read the description of our main 'Algo Trading (Bank Nifty & Nifty )' study which is available at following link:
Note:
1. in order to test this strategy on longer time period, you must have a Premium TradingView account.
2. If you have premium TradingView account, the stats you generate will exactly match with our stats which we keep sharing in our channel.
3. To Enable Auto-Trading, You will need to connect this Algo with your broker's trading platform through 3rd party platforms. We will guide you on how to do this, when you contact us.
Profitabletrading

StocasticRSI EMAs ATR StrategyA scalping based strategy thats works well with EUR/USD 30 minute time frame.
This strategy uses stochasticRSI for trade entry. Uses two exponential moving averages for trend detection. The strategy uses Average True Range for stop loss and for two profit targets.
We only trade with the trend if the 50 period exponential moving averages is above the 200 period exponential moving averages. StocasticRSI must cross below 30 level by default for a long entry if the rend is up. Likewise with a short entry the stochasticRSI must crossover above 70 level and if the trend is down.
This script does not trail your stop loss as I have noticed it does not give me good results. Stop loss is a fix stoploss based on Average True Range and so are the profit targets.
This script has risk management, it risk a certain percent of the inputed capital amount in the setting. See settings for more details.
Green line is 50 period exponential moving averages and red line is the the 200 period exponential moving average. Blue line is stoploss for short trade and black line stop loss for buy trade.
Since this is a scalping strategy be caution with the commission and slippage. I have inputed 1 for commission and 1 for sllipage.
Many Thanks,
Honest Trader

Buy and Sell Signals (With Stops and TP) - No Repaint
This strategy is primarily based on the MACD-indicator, but signals are filtered with the 200 ema.
This indicator gives you for every trade a stopp loss and take profit line.
As with every other strategy risk management is key. The trades taken have all 1.5:1 risk ratios, so when you lose one trade and win one you are still in profit.
This will only work if you calculate your position size accordingly when actually trading!
Without leverage:
position_size = (portfolio * loss_per_trade) / (stop_loss_in_percent )
Leverage:
position_size = (portfolio * loss_per_trade) / (stop_loss_in_percent * leverage)
For example:
portfolio = 100000
loss_per_trade = 0.01 | I only want to lose 1% per trade
stop_loss_in_percent = 0.04 | The stoploss is 4% away from our entry
(100000 * 0.01) / 0.04 = 2500 => if this trade hits my stop, I will only lose 1 % of my portfolio.
This strategy works well with:
BTCUSD 30m
BANDUSDTPERP 5m
EUR DOLLAR 15m
Of course it can be applied to anything, but you should firstly validate the strategy via backtest for the according trading pair and timeframe as it can perform differenlty in various timeframes.
This script does not repaint.
If you are interested in this strategy dm me.
Good luck on your trades!

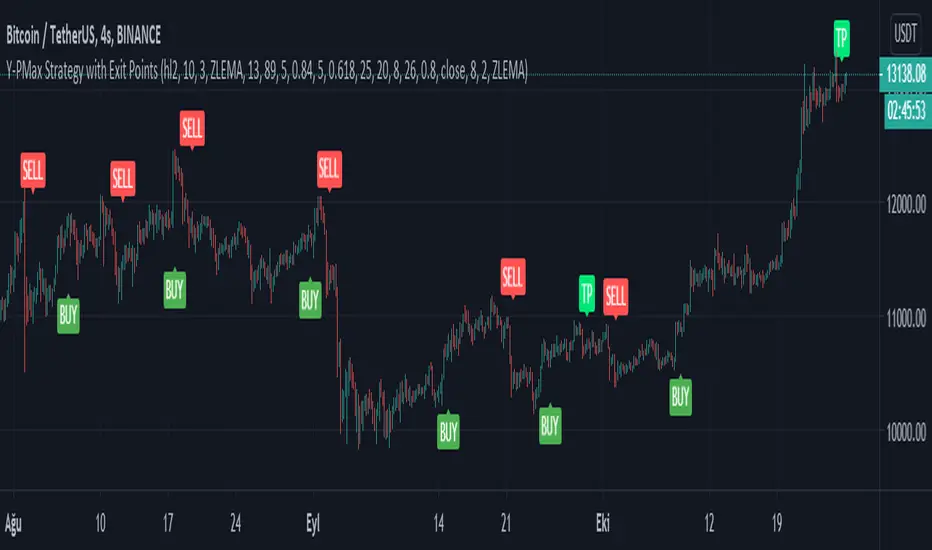
Y-Profit Maximizer Strategy with Exit PointsThis script based on KivancOzbilgic 's PMax indicator. I modified a bit. Added Filters, Exit (TP) Levels and few indicator in it. This script opening only Long Positions.
I have used this indicators in this strategy:
-Moving Stop Loss (Most) by ceyhun
-PMax Explorer STRATEGY & SCREENER
-Bollinger Bands on Macd
-Tillson T3 Moving Average by KIVANÇ fr3762
I am open to suggestions for improve this script.
PS: Script is in Turkish Language.
VWAP + Fibo Dev Extensions StrategyBased on my VWAP + Fibo deviations indicator, I tested some strategies to see if the indicator can be profitable; and I got it !
This strategy uses:
H1 timeframe
Weekly VWAP
+1.618 / +2.618 / -1.618 / -2.618 Deviations Extensions to create 2 bands
The value of the deviation
First, the 2 bands are plotted : +1.618/+2.618 painted in red and -1.618/-2.618 painted in lime.
Then, we wait for the deviation value to reach at least 150 (see thumbnail) to avoid littles moves when the gaps between bands are too short.
Entry long position :
first candle must crossunder the -1.618 level and low have to stay over the -2.618
low of the second one must stay in the lime band
enter the third one if the deviation value is over limit (150)
Exit long position :
TP : when a high crossover VWAP
SL : when a low crossunder -2.618
Entry short position :
first candle must crossover the +1.618 level and high have to stay under the +2.618
high of the second one must stay in the red band
enter the third one if the deviation value is over limit (150)
Exit short position :
TP : when a low crossunder VWAP
SL : when a high crossover +2.618
Notes :
this strategy uses pyramiding (5), be careful and calculate your risk management
the comission value is set to 0.08% to include slippages when entering a trade because of market orders
This strategy is not an advice to invest, make your own decisions.

RSI on VWAP Upgraded strategyFirst of all, the idea of apply RSI to VWAP was inspired by XaviZ; at least, that where I first saw that.
I simply applied the idea and searched for apply this on lower timeframe (M15) to increase the number of positions and improve the profit factor.
The conditions to enter are the same :
long : enter on RSI crossover oversold level
short : enter on RSI crossunder oversell level
To close position, I found a little change to apply :
long : close position when RSI(VWAP) went in overbought zone and crossunder the overbought level OR after being at least x bars in the overbought zone (parameter is 28 by default) => when the first condition happens
short : close position when RSI(VWAP) went in oversold zone and crossover the oversold level OR after being at least x bars in the oversell zone (parameter is 28 by default) => when the first condition happens
With this change, I got better results specially on BTCUSDTPERP (M15) where I reach a 6.8 profit factor with 119 trades closed. Not BAD !
The defaults parameters are the best found for BTCUSDTPERP (M15), but the strategy works fine for other pairs if you take time to find the rights combinations.
In this strategy you can change (with defaults in () ):
RSI length (28)
RSI overbought level (85)
RSI oversell level (30)
Number of bars before leaving as explain above (28)
The choice to take longs only, shorts only or both
The number of coin/token by position
The start date for backtesting
Please note that the script use a pyramiding parameter of 3 (can be changed in the first line of the script); that means that you can take up to 3 positions before closing. It lets you improve average enter price but increase the risk. 3 is the best I found to improve profit factor without expose myself too much.
This script would be better if automated because of the conditions of buy and sell.
It's only for educative purpose, not an advice to invest.
All my free scripts here : fr.tradingview.com
Leave a message and don't forget to follow me ;) !

Trend TradingThe strategy has two scripts coded in it. It uses $10,000 capital, 1 Share is the default quantity, commission of 0.0018.
As you can notice in the AMD chart,
The coded script can do four actions because there are two scripts together.
First script:
A-Buy on red bars
B-sell on green candles.
Second script:
A-buy on red background
B-sell on green background
(This is just to show you the statistics of both scripts).
The way my strategy works is there are multiple weights to gains from certain highs and lows using Fibonacci ratios.
The reason I combined both is I need to know what the trend is to avoid trading against it.
The background color tells me what the trend it.
The bar colors are for entries.
How I filter the signals:
When the background is red, then a down trend. However, my entry would be on green bars.
When the background is green, an uptrend, However, my entry would be on red bars.
The strategy can be used for multiple time frames, please test profitability rate and trade based on your judgment. The indicator is not perfect, and Your skills are important in the decision making. Do not depend solely on the indicator.
Other signals,
1-After a wide green background(uptrend). You could see one a red that could be an entry instead of a downtrend and vice versa.
2-In a wide red background, you could see green bars eventually that could be an overbought condition for a rally and vice versa.
The indicator can help you but will not trade for you. I suggest that you follow the certain conditions I have mentioned (How filter the signals).
If you are interested, please send me private message.

TTS Triple Threat SMA10-30-200 TLTTS Triple Threat SMA10-30-200 TL is a crossover and crossunder trading system that is based on three simple moving averages (SMA).
The default settings are optimized for 4-hour charts.
The TTS Triple Threat trading system works as follows:
1. Enters BULLISH trade when LE Trade & LONG signals are shown on the chart.
2. Enters BEARISH trade when SE Trade & SHORT signals are shown on the chart.
3. LONG and SHORT signals are shown based on SMA crosses for visual inspection but doesn't mean they are trades. Either LE Trade or SE Trade signals need to be present for a trade to take place.
4. TTS Triple Threat SMA10-30-200 TL uses trailing stop loss settings. The ratios between the profit taking settings and trailing loss stops are important to the strategy. Trailing stop loss exits are shown on the chart as XL STOP LOSS or XS STOP LOSS. Profit exits are shown as XL PROFIT EXIT and XS PROFIT EXIT.

Dominator Ladder StrategyThe Dominator is a technical indicator. Based on algorithm calculations, this indicator extrapolates the previous price for the next bar.
Here is how Dominator is calculated:
1. The study estimates the price projected for the next bar. The estimated price is based on the algorithm method.
2. The study extrapolates this value to find a projected price change for the next bar.
The resulting extrapolated value is shown as a histogram on a lower subgraph. By default, sections of the histogram where the extrapolated value is increasing are shown in green; sections corresponding to the decreasing value are shown in red.
Note: Value projection is purely mathematical as all calculations are based on algorithm averaging of previous values.
Note: lower subgraph it's just for you to understand and view the waves during the Strategy process Study it's not included in this strategy.
Overlay True
The strategy includes 3 different adjustable levels for the ladder , plus automatic adjustable stop loss and takes profit calculated from your average entry price after each ladder adds.
Adjustable BAcktest Window.
1 long signals
3 ladder long add signals
1 short signals
3 ladder short add signals
1 dynamic stop calculated from your average entry price
1 dynamic take profit calculated from your average entry price

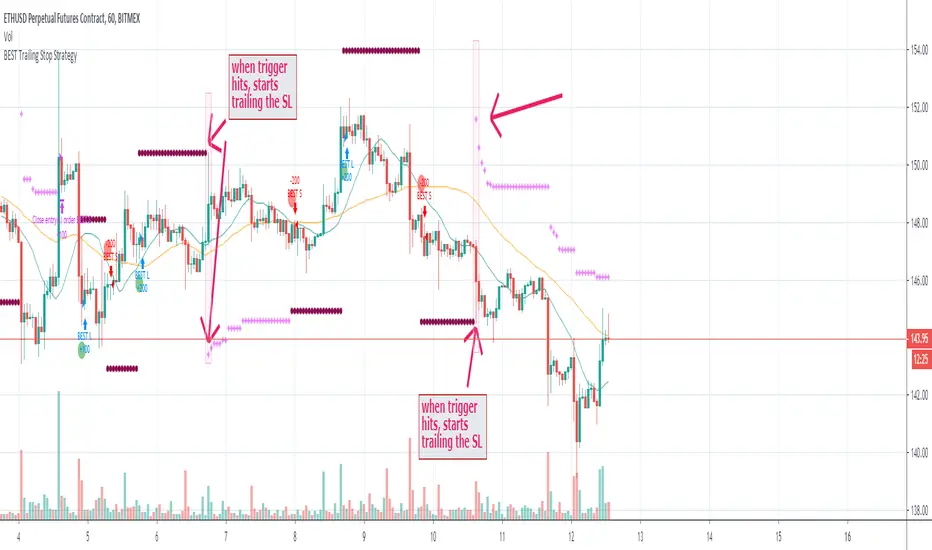
BEST Trailing Stop StrategyHello traders
Here we go again.... with the second strategy snippet.
Reminder: the first snipper was a Trailing Profit strategy script
What's on the menu?
A trailing stop is designed to protect gains by enabling a trade to remain open and continue to profit as long as the price is moving in the investor's favor.
The order closes the trade if the price changes direction by a specified percentage or dollar amount.
Trigger me I'm famous
I developed many trading strategies in my career and often I've been asked to trigger a trailing-stop once a certain % move has been made.
On the screenshot below, the SL trigger is plotted in maroon.
Once the price goes past that level for the first time, I'll start trailing the trailing stop level.
In other words, when we see a price makes an interesting move in percentage value - we decide to trail the stop for at least not losing any more
All the BEST
Dave
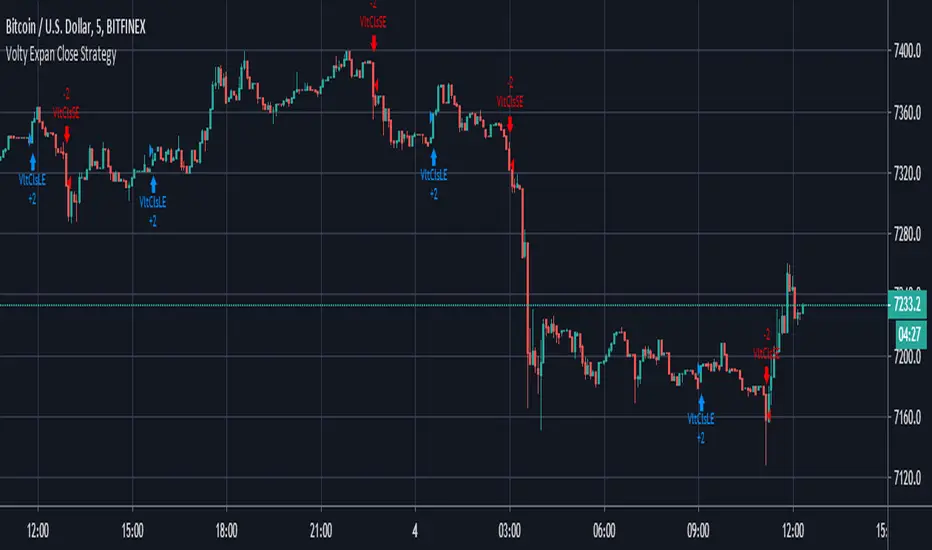
Volty Expan Close Strategy with Backtest Date RangeInput Information
Length Numeric 5 Number of bars used to determine the average true range.
NumATRs Numeric .75 Factor used to calculate a percentage of the average true range, used to
Long and short entry based on a percentage of price movement beyond the average range.
Profitable and simple strategy..
TradersAI_UTBotCREDITS to @HPotter for the orginal code.
CREDITS to @Yo_adriiiiaan for recently publishing the UT Bot study based on the original code -
I just added some simple code to turn it into a strategy. Now, anyone can simply add the strategy to their chart to see the backtesting results!
While @Yo_adriiiiaan mentions it works best on a 4-hour timeframe or above, I am happy to share that this seems to be working on a 15-minute chart on e-mini S&P 500 Index (using the KeyValue setting at 10)! You can play around with the different settings, and may be you might discover even better settings.
Hope this helps. Btw, if any of you play with different settings and discover great settings for a specific instrument, please share them with the community here - it will be rewarded back multiple times!

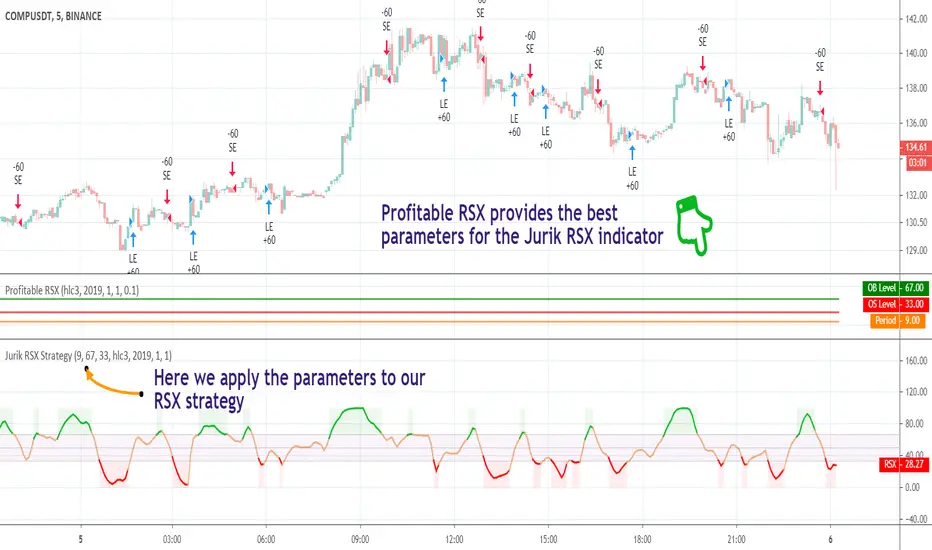
Profitable Jurik RSXIntroduction
As you know the Jurik RSX is a "noise free" smoothed version of RSI (Relative Strength Index), with no added lag.
It was originally developed by Mark Jurik and is used the same way as RSI. To learn more about this indicator see www.jurikres.com
The most basic and common strategy is to use the crossovers between Jurik RSX and its overbought/oversold levels as trade signals:
when RSX crosses above 30, go Long
when RSX crosses below 70, go Short
exit when a crossover occurs in the opposite direction
What is this tool?
This tool is a performance scanner that uses a decision tree-based algorithm under the hood to find the most profitable settings for Jurik RSX. It analyzes the range of periods between 2 to 100 and backtests the Jurik RSX for each period (using the strategy mentioned above) across the entire history of an instrument. If the more profitable parameter was found, the indicator will switch its value to the found one immediately.
So, instead of manually selecting parameters just apply it to your chart and relax - the algorithm will do it for you, everywhere you want.
The algorithm can work in two modes: Basic and Early Switch. The Early Switch algorithm makes some assumptions and activates a set of optimizations to find a better setting DURING the trades, not after they were actually closed.
The difference is illustrated on the screenshot below
But two modes can show identical values depending on timeframe
Additionally you can set up a backtest window through indicator's settings (the optimizers which were published before will get this feature soon).
Alerts
It has a special alert that notifies when a more profitable period was detected.
NOTE: It does not change what has already been plotted.
NOTE 2: This is not a strategy, but an algorithmic optimizer.
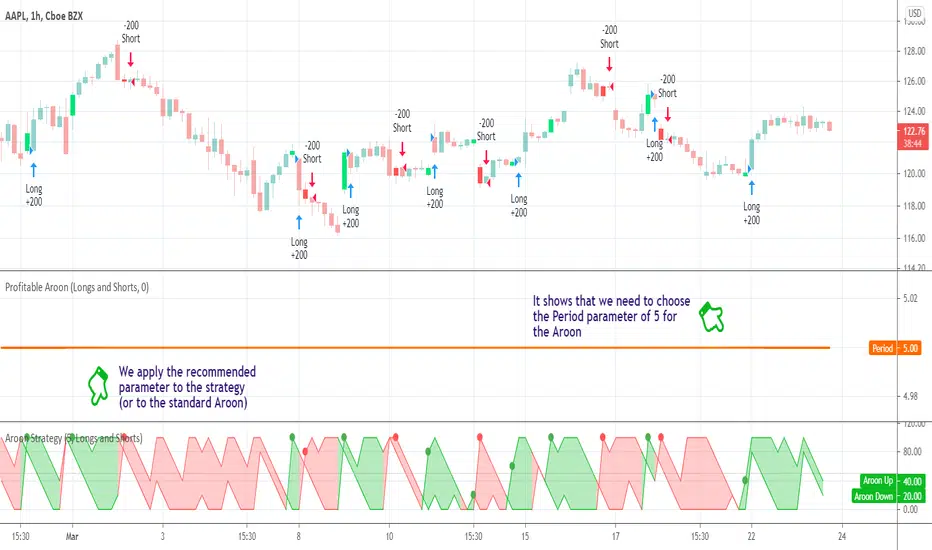
Profitable AroonIntroduction
The Aroon indicator was developed by well-known technical analyst Tushar Chande in 1995 and is used to identify trend changes in the price of an asset, as well as the strength of that trend. The fact that he named the indicator "Aroon" which is Sanskrit for "Dawn’s Early Light" demonstrates his belief in his indicator's trend discovery capabilities.
It is composed of two lines, Aroon Up and Aroon Down .
The most basic strategy is to use the crossovers as trade signals:
when Aroon Up crosses above Aroon Down , go Long
when Aroon Down crosses above Aroon Up , go Short
Exit when a crossover occurs in the opposite direction
What is this tool?
This tool is a performance scanner that uses a decision tree-based algorithm under the hood to find the most profitable period setting for the Aroon. It analyzes the range of periods between 2 to 100 and backtests the Aroon indicator for each period using the strategy mentioned above across the entire history of an instrument. If a more profitable parameter was found, the indicator will switch its value to the found one immediately.
Alerts
It has an alert that notifies when a more profitable period was found.
NOTE : It does not change what has already been plotted.
Good luck and Happy Trading!
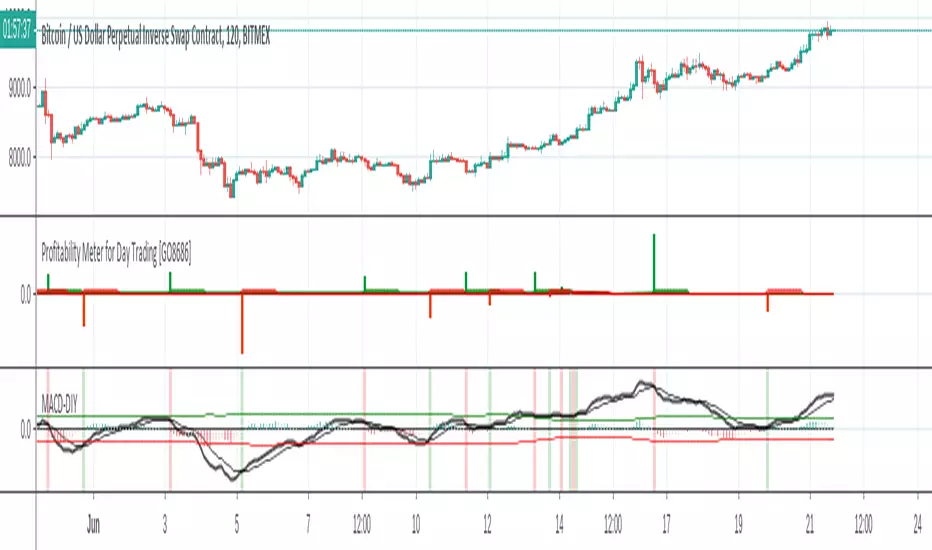
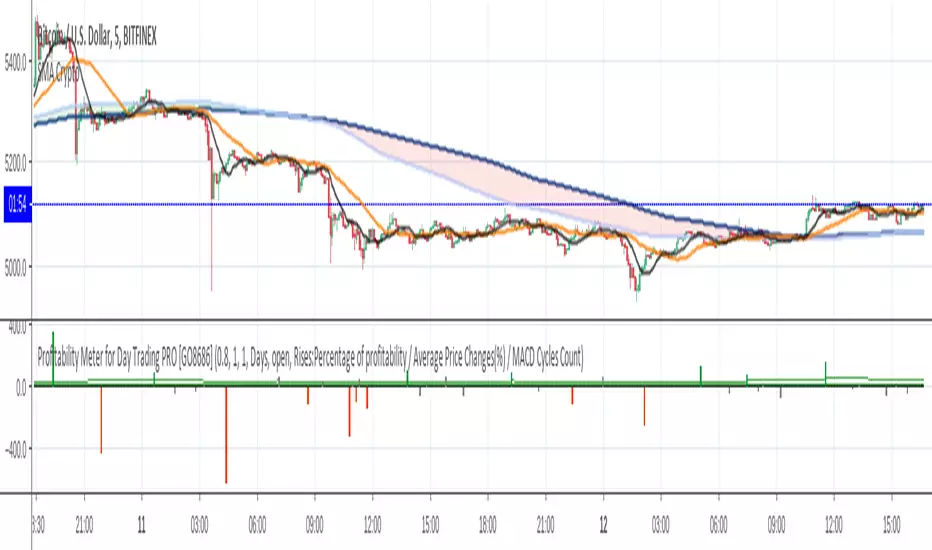
Profitability Meter for Day Trading PRO [GO8686]For day traders, keeping a position is risky and costly, a popular strategy is to open a position ONLY when volatility is active, in other words, only when profitability is back.
This indicator reveals the movements of the underlying profitability of a trading security in different time dimensions.
This indicator calculates and displays price change percentage of MACD cycles, highlights those MACD cycles that are over the profitability threshold, helping traders identify range area, the start of a new trend and the fading of a trend.
Multiple time frames: This indicator is designed for day trading, so suggested time frames are: 3m, 5m, 15m, 30m, 1H. Users can try other time frames (< 1D) if it fits their trading practice.
Range area in general: a small green column and a small red column appear alternately, or most columns are gray within the period.
The start of a new trend: an outstanding green or red column means the macd cross brought a price change that was higher than the profitability threshold, which could mean a new trend, especially when it was from a range area.
The fading of a trend: for instance, when green columns are getting smaller and red columns appear, a fading of bull trend could be on the way.
This is PRO version of Profitability Meter for Day Trading
PRO excluded functions:
Alert Function: allowing user to set alert for price change with Profitability, or set alert for statistics results.
Statistics within Customisable Time Span: Percentage of MACD cycles with profitability, the average of price change(%) and MACD cycles count. Users can customize the time range by days,hours or bars (up to the maximum backtracking value that Tradingview allows).
Subscribers of this indicator may apply for two-month free-trial of "Crypto Currency Profitability Rankings PRO with Customisable List"
Free trial of two-week: Please leave a comment asking for a trial, you should get access in 48 hours. In case it doesn't happen, please message the author.
Visibility:Invite-Only
Format Configuration:
Profitability Threshold: a percentage of price movement within a MACD cycle that a user thinks is good to define profitability, defval: 0.8%.
Alertthreshold: Threshold percentage for alert.
timeSpan: Time span for statistics
timeSpanType: Time span type for statistics
Related Indicators:
Crypto Currency Profitability Rankings Standard with Popular List (Protected): The Indicator calculates and compares the profitability of a group of popular crypto currencies - based on MACD cycles and user-defined time span, helping traders to find the most suitable trading security.
Crypto Currency Profitability Rankings PRO with Customisable List (Invite-Only): Contact the author for a free trial.
List of the author's Indicators
www.tradingview.com
Disclaim: By using or requesting access to this indicator, you acknowledge that you have read and accepted that this indicator is for study purposes only and it does NOT guarantee you will make money.
I am not financial advisor and I am NOT responsible for any profits or losses you may incur by using this indicator!
Users should make their own decisions, carefully assess risks and be responsible for investment and trading activities.
The latest updates override the previous description. Please check the updates.
日内交易盈利潜力指示仪PRO
这是日内交易盈利潜力指示仪的PRO版本
PRO专属功能:
预设警报:方便用户为赢利性变动和统计学结果设置警报。
统计功能:过去特定时间段的可赢利波动的百分比,波动百分比平均值和MACD周期计数。用户可以自定义时间幅度:可以用天数,小时数,蜡烛数(上至Tradingview最大回溯值)
本指标用户可以申请免费试用两个月“Crypto Currency Profitability Rankings PRO with Customisable List (Invite Only)”
指标特征描述
本指标帮助交易员认知交易标的在不同时间维度的赢利潜力的变化。
对于日内交易,保持仓位是要承担风险和成本的,一种交易策略是只在波动率被激活至可赢利水平后才开仓位。
本指标计算和展示赢利潜力-基于MACD周期的波动百分比,用颜色来突出高赢利性的波动周期。方便交易员辨识非交易区间,新趋势的开始和旧趋势的衰减。
多时间维度:本指标为日内交易设计,因此建议使用时间维度:3m,5m,15m,30m,1H; 如果用户需要,也可以用于其他不大于1D的维度。
盘整区的一般特征:当波动率消减时,波动率低于可赢利门槛,呈现灰色; 或者小的绿色和红色波动率间隔出现。
新趋势的开始:在盘整后期,新出现的绿色或者红色波动率可能标识着新趋势的开始。
旧趋势的衰减:以上升趋势为例,当绿色波动率逐渐缩小,而红色波动率开始出现时,可能标识着上升趋势衰减。
设置:盈利能力阈值:用户自定义的MACD单次波动的可赢利的百分比,默认为0.8%
免费试用两周:跟帖评论, 要求试用,您应该会在48小时内获得访问权限。 如果没有获得,请私信作者。
相关指标:
Crypto Currency Profitability Rankings Standard with popular list (Protected) 加密货币赢利潜力排行指标 标准版 热门列表: 指标计算和比对一组热门虚拟货币的可赢利属性 - 基于MACD波动周期和用户自定义的时间周期,帮助交易员发掘最适合自己赢利和风险偏好的交易品种。
Crypto Currency Profitability Rankings PRO with Customisable List (Invite-Only): 加密货币赢利潜力排行指标 PRO 自定义列表
试用开发者的其他指标
www.tradingview.com
免责声明:在要求获得本指标使用权之前以及在使用本指标之前,用户认可已经完全了解和接受:本指标仅供教育和研究目的, 它不提供任何赢利的可能性。
本指标的开发者并非专业投资顾问,因此不对用户的任何赢亏负责。
用户应独立判断,审慎评估并自负投资和交易风险!
最新更新会覆盖之前的说明。 请检查更新。
Profitability Meter for Day Trading [GO8686]Disclaim:
By using or requesting access to this indicator, you acknowledge that you have read and accepted that this indicator is for study purposes only and it does NOT guarantee you will make money.
I am not financial adviser and I am NOT responsible for any profits or losses you may incur by using this indicator.
Users should make their own decisions, carefully assess risks and be responsible for investment and trading activities.
Indicator Description
Visibility:Protected
This indicator helps traders understand the movements of the underlying profitability of a trading security in different time dimensions.
For day trading, keeping a position is risky and costly, a popular strategy is to open a position ONLY when volatility is active, in other words, only when profitability is back.
This indicator calculates and displays price movement percentage of MACD cycles, highlights those MACD cycles that are over the profitability threshold, helping traders identify range area, the start of a new trend and the fading of a trend.
Multiple time frames: This indicator is designed for day trading, so suggested time frames are: 3m, 5m, 15m, 30m, 1H. Users can try other time frames (< 1D) if they find it useful.
Range area in general: a small green column and a small red column appear alternately, or most columns are gray within the period.
The start of a new trend: an outstanding green or red column means the MACD cross brought a price change that was higher than the profitability threshold, which could mean a new trend, especially when it was from a range area.
The fading of a trend: for instance, when green columns are getting smaller and red columns appear, a fading of bull trend could be on the way.
Format Configuration:
Profitability Threshold: a percentage of price movement within a MACD cycle that a user thinks is good to define profitability, defval: 0.8%.
PRO Version of this Indicator: Profitability Meter for Day Trading - PRO (Invite-Only)
Alert Function: allowing user to set alert for price change with profitability, or set alert for statistics results.
Statistics with Customisable Time Span: Percentage of MACD cycles with profitability, the average of price change(%) and MACD cycles count. Users can customize the time range by days,hours or bars (up to the maximum backtracking value that Tradingview allows).
Related Indicators:
Crypto Currency Profitability Rankings Standard with Popular List (Protected):
This indicator calculates and generate a ranking of profitability from a popular list of crypto currencies, based on MACD cycles within user-defined time span, helping crypto traders to find the trading securities that suit their risk and volatility preference.
Crypto Currency Profitability Rankings PRO with Customisable List (Invite-Only): Contact the author for a free trial.
List of the author's Indicators
www.tradingview.com
The latest updates override the previous description. Please check the updates.
日内交易盈利潜力指示仪
免责声明:在要求获得本指标使用权之前以及在使用本指标之前,用户认可已经完全了解和接受:本指标仅供教育和研究目的, 它不提供任何赢利的可能性。
本指标的开发者并非专业投资顾问,因此不对用户的任何赢亏负责。
用户应独立判断,审慎评估并自负投资和交易风险!
指标特征描述
本指标帮助交易员认知交易标的在不同时间维度的赢利潜力的变化。
对于日内交易,保持仓位是要承担风险和成本的,一种交易策略是只在波动率被激活至可赢利水平后才开仓位。
本指标计算和展示赢利潜力-基于MACD周期的波动百分比,用颜色来突出高赢利性的波动周期。方便交易员辨识非交易区间,新趋势的开始和旧趋势的衰减。
多时间维度:本指标为日内交易设计,因此建议使用时间维度:3m,5m,15m,30m,1H; 如果用户需要,也可以用于其他不大于1D的维度。
盘整区的一般特征:当波动率消减时,波动率低于可赢利门槛,呈现灰色; 或者小的绿色和红色波动率间隔出现。
新趋势的开始:在盘整后期,新出现的绿色或者红色波动率可能标识着新趋势的开始。
旧趋势的衰减:以上升趋势为例,当绿色波动率逐渐缩小,而红色波动率开始出现时,可能标识着上升趋势衰减。
设置:盈利能力阈值:用户自定义的MACD单次波动的可赢利的百分比,默认为0.8%
高级版本功能: Profitability Meter for Day Trading - PRO (Invite Only)
预设警报:方便用户为赢利性变动和统计学结果设置警报。
统计功能:过去特定时间段的可赢利波动的百分比,波动百分比平均值和MACD周期计数。用户可以自定义时间幅度:可以用天数,小时数,蜡烛数(上至Tradingview最大回溯值)
相关指标:
Crypto Currency Profitability Rankings Standard with popular list (Protected) 加密货币获利机会排行指标 标准版 热门列表(保护,开放使用权): 指标计算和比对一组热门虚拟货币的可赢利属性 - 基于MACD波动周期和用户自定义的时间周期,帮助交易员发掘最适合自己赢利和风险偏好的交易品种。
Crypto Currency Profitability Rankings PRO with Customisable List (Invite-Only): 加密货币获利机会排行指标 PRO - 自定义列表
试用开发者的其他指标
www.tradingview.com
最新更新会覆盖之前的说明。 请检查更新。